Abstract
Raman spectroscopy has been playing an increasingly significant role for cell classification. Here, we introduce a novel microfluidic chip for non-invasive Raman cell natural fingerprint collection. Traditional Raman spectroscopy measurement of the cells grown in a Polydimethylsiloxane (PDMS) based microfluidic device suffers from the background noise from the substrate materials of PDMS when intended to apply as an in vitro cell assay. To overcome this disadvantage, the current device is designed with a middle layer of PDMS layer sandwiched by two MgF2 slides which minimize the PDMS background signal in Raman measurement. Three cancer cell lines, including a human lung cancer cell A549, and human breast cancer cell lines MDA-MB-231 and MDA-MB-231/BRMS1, were cultured in this microdevice separately for a period of three days to evaluate the biocompatibility of the microfluidic system. In addition, atomic force microscopy (AFM) was used to measure the Young's modulus and adhesion force of cancer cells at single cell level. The AFM results indicated that our microchannel environment did not seem to alter the cell biomechanical properties. The biochemical responses of cancer cells exposed to anti-cancer drug doxorubicin (DOX) up to 24 h were assessed by Raman spectroscopy. Principal component analysis over the Raman spectra indicated that cancer cells untreated and treated with DOX can be distinguished. This PDMS microfluidic device offers a non-invasive and reusable tool for in vitro Raman measurement of living cells, and can be potentially applied for anti-cancer drug screening.
I. INTRODUCTION
Over the last two decades, Raman spectroscopy, as a label-free technique, has become an increasingly powerful tool for cell characterization and classification.1,2 It is a label-free and noninvasive technique, and is also well suitable to monitor live cell behaviors.2 It is, based on inelastic scattering, is a spectroscopic technique that can identify chemical compositions by characteristic fingerprints in living cells.3 Raman spectroscopy has been applied to the area of diagnostics, tissue engineering, and toxicological testing,4 and the toxicological research of pharmaceuticals on living cells in vitro.5 It also has been applied for real time measurement of biochemical alterations in living tumor cells treated with anticancer drugs.6,7 Besides, confocal Raman spectroscopy is employed to trace the anticancer drug paclitaxel in living Michigan Cancer Foundation-7 cells.7
Microfluidic devices also referred to as “lab-on-a-chip (LOC)” have received much attention. The use of microfluidics to conduct biomedical and clinical research has a variety of advantages. First, fabrication of the microfluidic device is relatively low cost and very amenable to highly elaborate, multiplexed devices. Some designs may be mass produced. Second, microfluidic bioreactors are potentially advantageous for cellular applications as they provide a large surface-area-to-volume ratio so a large number of cells can be produced by a low volume device.8 Third, because the volume of fluids within these devices is very small, usually from several nanoliters to several microliters, the reagent consumption is quite small. It helps to save expensive reagents. Microfluidic devices have been applied to detect bacteria, viruses, and cancers. Some other biochemical assays have been shift into a LOC format for the analysis of samples such as whole blood, bacteria, cell suspensions or solutions.9–14
Recently, the combination of microfluidic platform and Raman spectroscopy for biological application has been extensively reported for variety of applications.15–18 One of the major challenge for integrating microfluidic platform and Raman spectroscopy for cell analysis is the high noise background spectrum throughout the spectral range, such as polydimethylsiloxane (PDMS) and glass.19 In order to minimize the influence of such background noise, and also enhance the signals, Surface-Enhanced Raman Spectroscopy (SERS) is commonly implemented in combination with a traditional microfluidic platform.20,21 Surface enhanced Raman spectroscopy (SERS) is a surface-sensitive technique that enhances Raman scattering by molecules adsorbed on rough metal surfaces or by nanostructures.
Microfluidics in combination with SERS has gained respect as an analytical technique with attractive chemical and biological applications in order to enhance the Raman signal, such as immunoassay,22,23 in-solution strategy,24,25 nanoparticles embedded inside the microfluidic channel.15,24 Nevertheless, the SERS technique must introduce external nanomaterials for Raman signal enhancement purpose, the enhanced Raman signals only provide selective structural information (typically from the Raman reporter molecules) and did not usually reflect the original signals from cells themselves.26 In addition, metal cytotoxicity should be considered a potential problem when applying SERS nano-particles in the living cell culture.27–29 Thus, it is necessary to develop new techniques and approaches with new materials and designs that are capable of tracking or monitoring of characteristic Raman spectra from cells themselves.
Selection of an appropriate substrate for Raman measurement is another option to minimize the background signal. Quartz has been reported as a substrate material2,17 for device detection chamber in Raman measurement, which has been shown to reduce the background signal from the substrate materials in the spectral range of 600–1800 cm−1. However, several characteristic Raman peaks still can be observed in this range when quartz is used as the substrate.30
In this paper, we demonstrate a novel and reusable MgF2 based microfluidic device that realizes in situ monitoring of single cells in response to anticancer drugs in a non-invasive way. Compared with quartz, MgF2 offers a minimal background in the cell fingerprint region without any distinct background noise peak. The performance of the proposed MgF2 based microfluidic measurement platform was tested by investigating anticancer drug interaction with three model cancer cell lines including the human lung carcinoma cell (A549), human breast cancer cell MDA-MB-231 (231), and MDA-MB-231 cells expressing breast metastatic suppressor gene 1 (231-B), which is a gene to prevent metastases from spreading in the body. Cells were long-term cultured in the device up to three days and viability tests were then conducted to evaluate biocompatibility of the microfluidic device system. Additionally, atomic force microscopy (AFM) and Raman spectroscopy were applied to examine the responses of A549, 231, and 231-B cells to doxorubicin (DOX) exposure (24 h) at the single cell level.
II. METHODS AND MATERIALS
A. Fabrication of the PDMS microfluidic device integrated with the MgF2 substrate
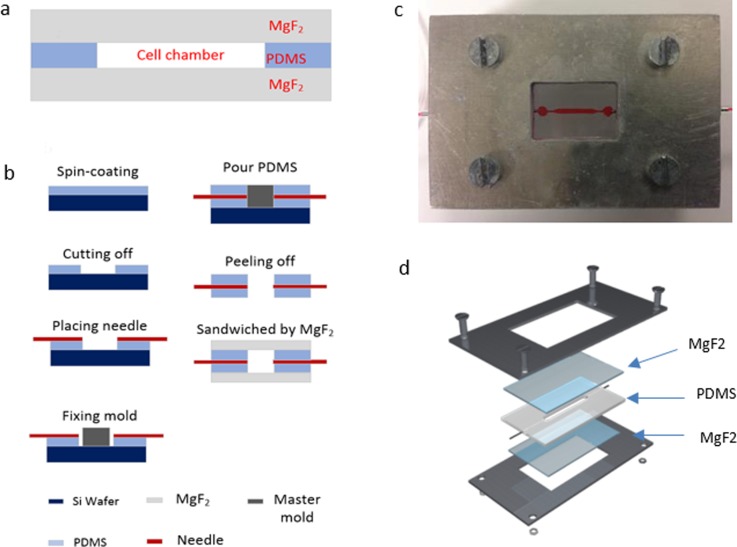
To enable Raman measurements of single cells in microfluidic chips, a magnesium fluoride (MgF2) optical window is used. The device is composed of three layers [Fig. 1(a)]: top and bottom MgF2 slices; middle polydimethylsiloxane (PDMS) (Sylgard 184 elastomer, Dow corning, Midland, MI) chamber layers molded from custom-patterned materials (University of Utah, UT). The fabrication procedure is illustrated in Fig. 1(b). First, PDMS was mixed in a 10:1 ratio, stirred vigorously for 5 min, and then degassed for 30 min under dynamic vacuum to remove all air bubbles. A 200 μm layer PDMS is spun on to the 3-in. silicon wafer at the speed of 500 rpm,31 and cured at 60 °C for 30 min. After cooling, the center area (2 cm × 2 cm) of the thin film is removed by a knife plotter. The master mold is placed onto the PDMS peel-off wafer area. A 25 G needle (B-D®) is placed on the PDMS and connected to the master mold (800 μm height and 1000 μm width in the center area) to define the inlet and outlet ports. Then, the cleaned PDMS precursor is poured onto the master mold and heated at 60 °C for 3 h. After cooling, the PDMS was peeled off the mold, the inlet and outlet needles are replaced by new ones, and then placed between two flat MgF2 (1 mm thickness) glass plates to provide a microfluidic channel. Finally, the three layers are pressurized together by four clamps at four corners of the holder consisting of two aluminum frame chips (Central Valley Machine, Logan, Utah). Figure 1(c) is the device in use and Fig. 1(d) is a 3D structure layout of the designed device.
FIG. 1.
MgF2 based device architecture and fabrication. Cross-section view of the fabricated microfluidic device (a); device fabrication procedure (b); device currently in use (c); and icrofluidic device 3D architecture (d).
B. Cell preparation
Human lung carcinoma A549 cells passage number 4 (ATCC, USA) were maintained in HyClone® DME/F-12k 1:1(1X) medium supplemented with 5% fetal bovine serum (FBS) (Gibco® by Life Technologies UT) and 1% penicillin-streptomycin (Invitrogen™) in an incubator (37 °C with 5% CO2). Cells were passaged at 80%–90% confluence using trypsin-EDTA (Gibco® by Life Technologies).
Human breast adenocarcinoma cell lines MDA-MB-231 and MDA-MB-231/BRMS1 were cultured in HyClone® DME/F-12 1:1(1X) medium containing 10% fetal bovine serum (FBS) (Gibco® by Life Technologies UT) at an incubator environment (37 °C with 5% CO2). Cells were passaged at 80%–90% confluency and used for experiments. No antibiotics or antimycotics were used during cell culture.
C. Device sterilization and cell seeding
The device was assembled and sterilized by autoclaving for 20 min under 121 °C; after sterilization, ethanol was flowed through the channels at 30 μl/min for 30 min, followed by a Phosphate-buffered saline (PBS) wash. Finally, the device was coated with fetal bovine serum overnight at 4 °C in a fridge. The channels were tested for leakage by flowing food dye through the microchannels. Cells were trypsinized and fully suspended in a vertex mixer (Corning LSE) before injection into microchannels. A 1 ml syringe (B-D®) was used for cell injection to the microfluidic device. The seeding density for all cell types was 5000 cells/cm2.
D. Anticancer drug doxorubicin (DOX) treatment
Doxorubicin (DOX) powder (Sigma-Aldrich, St Louis, MO) was dissolved in PBS and stored at 4 °C as a stock solution (100 nM) within one day prior to use. For full attachment, A549, 231, and 231-B cells were incubated for 24 and 48 h, respectively, after seeding, then the DOX contained medium was injected by a syringe pump at a speed of 500 μl/min at a IC50 concentration of 71 nM for A549 cells, 49 nM for 231 cells, and 71 nM for 231-B cells, respectively.32 The drugs were washed away by normal medium after 24 h incubation before the test. The cells were then ready for measurement.
E. Atomic force microscopy measurement
In order to measure mechanical properties of the cells (cell elasticity and adhesion force), the devices were unclamped after culture. The bottom MgF2 glass substrate was removed from the device and placed into the 10 cm (ID) culture dish (Cole-Parmer). The cells were tested in FBS buffer solution and the whole measurement was accomplished within 2 h to the approximate physiological condition.
PicoPlus contact mode AFM from (Picoplus, Agilent Technologies, USA) controlled by the Picoview 1.18 software was applied to measure cellular samples at room temperature (25 °C). The tip on the cantilever is of thickness between 0.55 μm–0.65 μm, and the Si3N4 tip curvature radius is 20 nm. The spring constant of the cantilever was at 0.03–0.12N/m (Bruker USA) and its corresponding deflection sensitivities were 45–50 nm/v.
For biomechanical properties' measurement, force-distance curves were determined by software Picoview 1.18 to calculate the cellular Young's modulus and adhesion force of each individual cell. For each cell line, 20 cells and 15 force curves were measured on the central area of different cells to avoid spurious detections. The Scanning Probe Image Processor (SPIP) software 6.0.13 (Image Metrology, Denmark) was used to calculate cell Young's modulus and adhesion force by fitting the Sneddon variation of Hertz model. The cellular Poisson's ratio was 0.5 and the half cone-opening angle of tip was 36°. Equation (1)33 listed below was used to calculate cell Young's modulus
| (1) |
where is Young's modulus; F is the loading force; is the passion ratio; is the indentation; and is the tip half cone opening angle.
F. Raman micro-spectroscopy and data acquisition
The Renishaw inVia Raman spectrometer connected to a Leica microscope was used for the cell spectra collection. A 785 nm near-IR laser was equipped for the Raman spectrometer. A silicon wafer was used for calibration before data collection (adjusted to 520.5 ± 0.1 cm−1 for the silicon peak).
Samples of A549 and 231/231-B cells were cultured in the MgF2 based PDMS microfluidic device for 48 h and Raman measurement was conducted for the cells in the culture medium. The Raman spectra were collected from the range 600 cm−1 to 1800 cm−1. The exposure time was 10 s for 1 accumulation at 100% laser power for all the cell samples. Cosmic rays in raw spectra were removed using the “zap” function in the Renishaw Wire 3.4 software. Matlab Principal Component Analysis (PCA) was applied to qualitatively distinguish the difference between the control and treatment groups.34,35
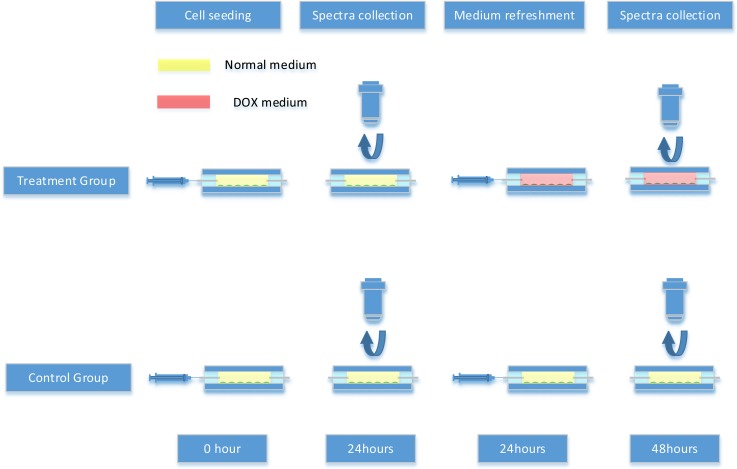
Raman measurements for the cells with and without exposure to DOX are shown in Scheme 1. The first Raman spectra datasets were collected from both control and treatment groups 24 h after cell seeding. After that, the treatment groups and control groups were refreshed with DOX media and normal media, respectively, and the second spectra datasets were collected from both control and treatment groups 24 h after the medium refreshment.
SCHEME 1.
The experimental procedure for Raman analysis of tumor cell interaction with DOX.
G. Raman data analysis
Software Renishaw Wire 3.4 was used to remove cosmic rays in raw spectra. Since Raman spectra are affected by the background noise and physical properties of the cell samples, mathematical processes are necessary to apply in order to reduce systematic noise, and also enhance the resolution of chemical compositions from target cells. In this study, principal component analysis (PCA)36 was performed on the spectral dataset with the purpose of defining a new dimensional space in which the major variance in the original dataset can be captured and represented by only a few principal component (PC) variables and hence allows the most significant variables responsible for these differences to be identified. PCA methods were applied to extract useful information from the raw dataset. First, PCA was applied to examine the differences between the groups of untreated and treated of 231, 231B, and A549 cell lines after the same length of culture time. Then, the differences between pre and post treatment (24 h after treatment) of the treated group were also compared by PCA. Therefore, we compared the datasets from different groups (treated and untreated) at the same time point (48 h after seeding) and the same group (treated group) at different time points (pre-treatment and 24 h post-treatment). All algorithms were implemented in Matlab R2017b (Mathworks Inc., Natick, USA).
H. Cell culture in the device and viability test
To evaluate biocompatibility of the microfluidic device, three types of tumor cells (A549, 231, 231-B) were cultured in the MgF2 based device individually for a period of 3 days. The cells were injected manually to three individual devices and cultured in the incubator under a 5% CO2 37 °C environment. The medium was refreshed every 24 h. After 3-day culture, viability tests were conducted to verify the cell condition of proliferation. The live/death dye (Invitrogen™) was injected into the device at the injection speed of 500 μl/min by a syringe pump, and incubated for 45 min before removal of the dye by PBS buffer. Fluorescence images were collected by an Olympus IX71 inverted fluorescence microscope equipped with an Olympus DP30BW CCD camera. Image collection was operated using a Olympus DP-BSW Controller and Manager Software. Phase or bright field images were acquired with a 10X Phase lens (Olympus).
III. RESULTS AND DISCUSSION
A. Magnesium fluoride (MgF2) substrate caused Raman laser signal attenuation
Magnesium fluoride (MgF2) is introduced as a substrate material for both microfluidic device fabrication and cancer cell culture. The in-device cancer cell culture assay had been discussed in this session. There are several reasons that we use the MgF2 substrate rather than other materials in Raman measurement; (1) MgF2 has an extremely wide transmission Range. Windows and lenses made of this material can be used over the entire range of wavelengths from about 0.2 μm (vacuum ultraviolet) to around 7.0 μm (infrared).37 (2) Magnesium fluoride does not produce a intense background noise signal in the cell fingerprint area (Fig. 2, black curve). The Raman spectrum of MgF2 is of low counts, flat, and smooth. (3) MgF2 is biocompatible for cell culture and suitable for cell adhesion after protein coating.
FIG. 2.
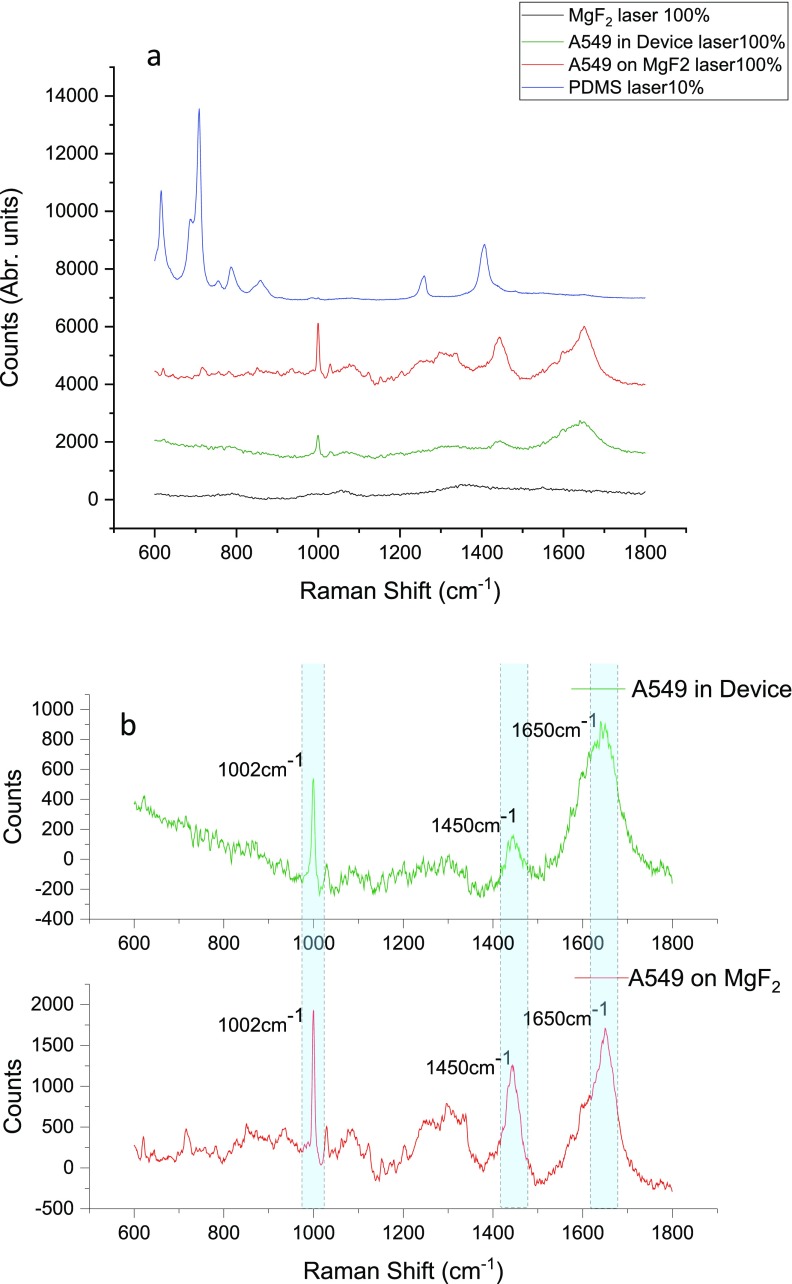
The Raman spectra of the A549 cell cultured inside the microfluidic device (green); and cultured on the MgF2 substrate in a dish (Red) with 100% laser power; as well as Raman spectrum of the MgF2 substrate at 100% laser power (Black); and Raman spectrum of the PDMS substrate at 10% laser power (Blue). All spectra collected under 63X aqueous lens with 10 s exposure time and 100% laser power (a). The Raman spectra of A549 cells cultured inside the microfluidic device (red); and cultured on the MgF2 substrate in the dish (Green), both subtracted with MgF2 substrate background spectra, several peak intensity differences are highlighted in cyan color (b).
Although it has many advantages, the MgF2 substrate for microfluidic device Raman detection also has its drawbacks. One main challenge is signal attenuation, the MgF2 substrate would cause an optical light intensity attenuation and Raman laser power attenuation while light or laser travel through the MgF2 optical window or substrate. During each individual Raman spectrum collection, the laser passes through the MgF2 optical windows for four times in total (twice of each on both the top and bottom MgF2 window). Although the transmittance of MgF2 is as high as over 90% in the optical light range,38 the counts of the Raman spectrum still drop significantly after attenuations.
Figure 2 shows the average Raman spectrum of A549 cells detected when cells cultured on the MgF2 substrate (Red), cultured inside of the microfluidic device (Green), as well as the PDMS substrate background peak (Blue) and the background Raman spectrum of the MgF2 substrate (Black). According to the result illustrated in Fig. 2(a), the characteristic PDMS peaks are much stronger than cells Raman peaks, even just used 10% laser power. The counts of the highest peak of PDMS (710 cm−1) was 5701, however, the highest peak for cell culture in the device and on the MgF2 slice were 1204 (1650 cm−1) and 2122(1002 cm−1), respectively. These peak intensities are much lower than PDMS peaks. The PDMS background peaks will overwhelm the cell peaks and no nature cell peaks could be found at the final mixed Raman spectra. Figure 2(b) is the Raman spectra of A549 cells cultured in the device and on the MgF2 slide, both are subtracted with the MgF2 background spectra. For most peaks from the cells cultured inside the MgF2 device, the peak intensity decayed to be approximately 30%–50% of the peaks of the cells cultured on the MgF2 slide placed in the dish culture. Peaks such as 1002 cm−1, 1450 cm−1, and 1650 cm−1 which represent Phenylalanine, C-C skeletal in protein, CH2 deformation of proteins and lipid, and (C=C) Amide I, respectively,39 declined to approximately 38.2%, 33.5%, and 52.7% compared to those obtained from the cells cultured on the MgF2 slide.
B. Long-term cancer cell culture in the device and live cell imaging
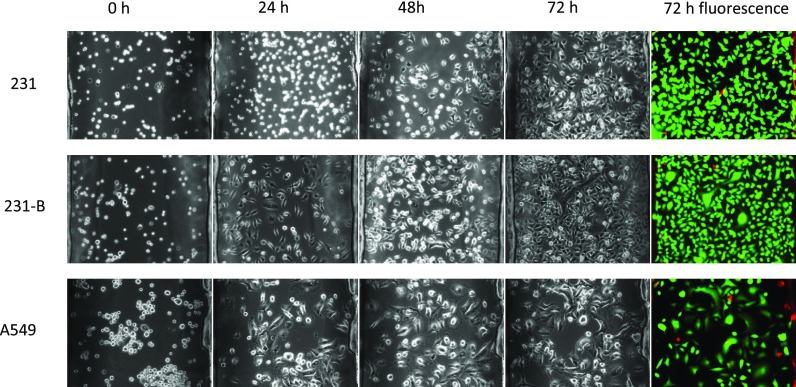
Cells were cultured in the device for three days to evaluate the device biocompatibility. Figure 3 illustrated the results of cells cultured in the device at the time points of seeding, 24h, 48 h, 72h and after staining. It can be seen that 231 and 231-B cells both grown and reached to confluence at day 3, while A549 cells showed a relatively slower proliferation rate. For all three groups, only few death cells were observed, and the cells retained a high viability ratio after 72h culture.
FIG. 3.
Cancer cells long-term cultured in the device and viability test; the graphs in each group were obtained on the same spot.
Malignant cancer cells typically display anchorage-independent growth patterns and cell rounding, and normal cells show a large, flat morphology.40 Comparing with the 231 and 231-B results at time points of 24h, 48h, and 72h, obviously, 231 cells took longer time to attach onto the substrate, under the same conditions. Moreover, 231 (malignant cancer cell) apparently showed a higher proportion of round cells than 231-B (benign cancer cell) at culture time points of 24 and 72 h. As one kind of malignant cancer cell, 231 is likely to have lower adhesion force/weak attachment than that of the 231-B. This argument had been supported in previous AFM tumor cell research.40
During the 3-day culture, all three types of cells proliferate at a certain growth rate. Both 231 and 231-B cells reached to confluence at day 3 with an extremely high viability rate. Apparently, the results showed our device are biocompatible for a variety of cell types.
C. AFM measurements of nanomechanical properties of cancer cells
Recently, biomechanics of cancer cells, in particular stiffness or elasticity, has been identified as an important factor relating to cancer cell biological function, adherence, motility, transformation, and invasion. It also influences significantly on the biophysical properties in terms of cell elasticity and adhesion.
In order to determine the biomechanical response of cells (231, 231-B, and A549) to DOX exposure and also how the microfluidic environment affects the nanomechanical properties of the cells, we assessed the biomechanical properties including Young's modulus (cell elasticity) and cell adhesion force of all cell lines under two different conditions: (1) cells grew in the fabricated microfluidic device for 48 h before test with normal culture media only(control); (2) cells were cultured in the microfluidic device with normal media for the 1st 24 h and treated by media with DOX at the IC50 concentration of individual cell types for the 2nd 24 h. Before measurement, devices were disassembled and the MgF2 substrates, where cells were cultured on, were immersed in PBS buffer.
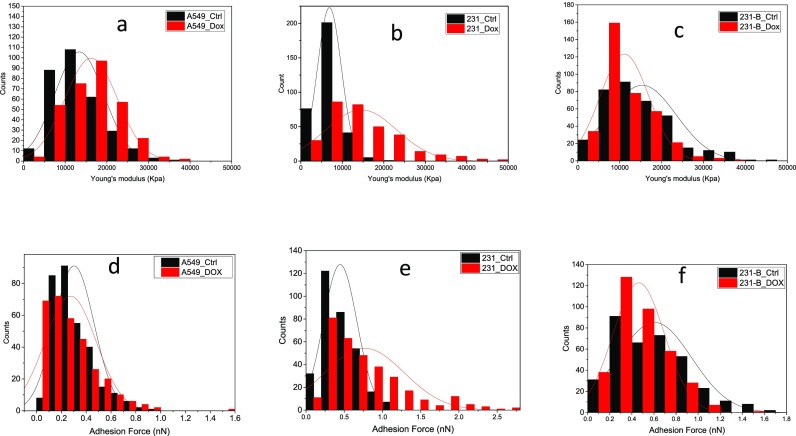
Figure 4 illustrated the Young's modulus (a, b, and c) and adhesion force (d, e, and f) distributions of A549 cells, 231, and 231-B cells with and without DOX exposure. For both malignant cells, the distribution of the Young's moduli and adhesion force turned to wider and lower, which means the samples in the treatment group have larger standard deviation. The results may indicate these cells stayed in various biological conditions after DOX treatment. It may because the resistance to DOX varies massively between individual cells. While before treatment cells are more alike to each other. Compared with A549, the 231 cells had more alteration on its distribution of control and treatment groups. However, for benign cell line 231-B, the treatment group has a narrower distribution. This result may also suggest the A549 cell line has higher resistance to DOX under 24 h IC50 treatment. We also found that in the control group, 231 tumor cells are more than 50% softer than benign 231-B cells with a distribution over three times narrower than that of benign 231-B cells (Fig. S1). While after 24 h DOX treatment, the stiffness of 231 cells increased to as the same level as untreated 231-B cells (Fig. 4.).
FIG. 4.
Young's modulus (a)–(c) and adhesion force (d)–(f) distributions of A549 cells (a) and (d), 231 (b) and (e) and 231-B (c) and (f) cells with and without DOX exposure. *“Ctrl” group is cultured with normal media for 48 h and “DOX” group is 24-h cultured with normal media and 24-h cultured with DOX media.
Figure 5(a) shows a typical topography image of A549 cancer cells. Figure 5(b) illustrated the histograms of the measured Young's modulus for all three cancer cell lines. In the control group, the measured cell elasticity values (mean ± SD) were 13.375 ± 5.994 KPa (n = 321, A549 cells), 6.888 ± 2.899 KPa (n = 336, 231 cells), and 15.372 ± 8.166 KPa (n = 366, 231-B cells), respectively; and in the DOX treatment group, such measured values for A549, 231, and 231-B were 16.242 ± 6.310 KPa (n = 323), 14.556 ± 8.590 KPa (n = 331), and 11.134 ± 3.874 KPa (n = 367), respectively. The measured Young's moduli showed a significant difference (P < 0.01) not only between control and treatment groups, but also between different cell types. The Young's moduli of both A549 and 231 cells increased after DOX treatment, which was observed in our previous work conducted in the culture dish.35 Notably, the Young's modulus of the benign cancer cell line (231-B) decreased after 24 h DOX treatment. Besides, the benign 231-B showed larger Young's modulus than malignant 231 cells, which is consistent with previous work.41
FIG. 5.
An example of topography imaging of the A549 cell (a); comparison of (b) Young's modulus and (c) adhesion force of A549 cells 231 and 231-B groups and DOX (70 nM, 24 h) treated groups. Laser exposure time 10 s and power 100% values represent mean ±SD (bar) of multiple cells. *p < 0.05, **p < 0.01.
Figure 5(c) gives the histograms of the measured adhesion force for all three cell lines. The average cell adhesion values (mean ± SD) for control groups, for A549, 231, and 231-B were 0.3032 ± 0.1605 nN (n = 321), 0.4467 ± 0.2204 nN (n = 331), and 0.6047 ± 0.3377 nN (n = 366), respectively. In DOX treated groups, the average cell adhesion values (mean ± SD) for A549, 231, and 231-B were 0.3290 ± 0.2063, nN (n = 321), 0.7647 ± 0.5183 nN (n = 336), and 0.4621 ± 0.2327 nN (n = 367), respectively. Although the average adhesion force of the A549 DOX treated group is slightly higher than the control group, the values did not show distinct alteration (P = 0.505), However, the adhesion force of 231 and 231-B cells follows the same trend of that of Young's modulus.
The results showed that, under the described experiment condition, DOX treatment would lead to the increase in Young's modulus on both A549 and 231 cells (malignant cell), but decrease on 231-B cell (benign cell). Meanwhile, DOX treatment would cause the increase in adhesion force on 231 cells and decrease on 231-B, nevertheless, it would not significantly affect cellular adhesion behavior for A549 cells. In summary, the in-device cultured cell AFM results have the same trend with previously published results tested by the dish culture method.35 The results also indicated the microfluidic environment did not affect the mechanical property of the cancer cells.
D. Microfluidic Raman assay of cellular biochemical changes induced by chemotherapy
Since Raman intensities are linearly related to the concentrations of particular molecular bonds of cellular bio-components, the changes in their characteristic peak intensities reflect the alterations of corresponding biochemical compositions of cells. Three cell models (A549, 231, and 231-B) have been introduced to evaluate the fabricated microfluidic device for cell discrimination. For each cell type, we seeded into two devices (one for the control group and the other for the treatment group) separately, with a seeding density of around 100,000cells/ml. The 1st group of spectra were collected from the treatment group after 24 h culture before DOX treatment. The DOX containing media was then injected into the device. The DOX treatment time was 24 h and the DOX final concentration is the IC50 concentration of the individual cells.32 After 24 h of DOX exposure, the 2nd group of data were collected (Scheme 1). For both groups of all three cell lines, 10–15 cells were randomly chosen for spectra acquisition. At each location, three samples from each cell type were obtained (that means there were 30–45 spectra for each cell type).
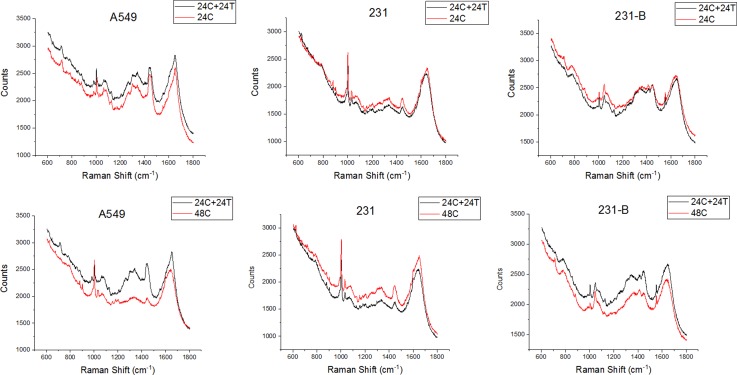
Figure 6 shows the average Raman spectra of randomly selected A549, 231, and 231-b cells cultured in the device with and without DOX treatment.
FIG. 6.
The mean Raman spectra comparison of the three types of cancer cells with and without DOX treatment. *“24hC” is 24-h negative control culture; “24hC + 24hT” means 24-h negative control culture + 24-h DOX treatment culture.
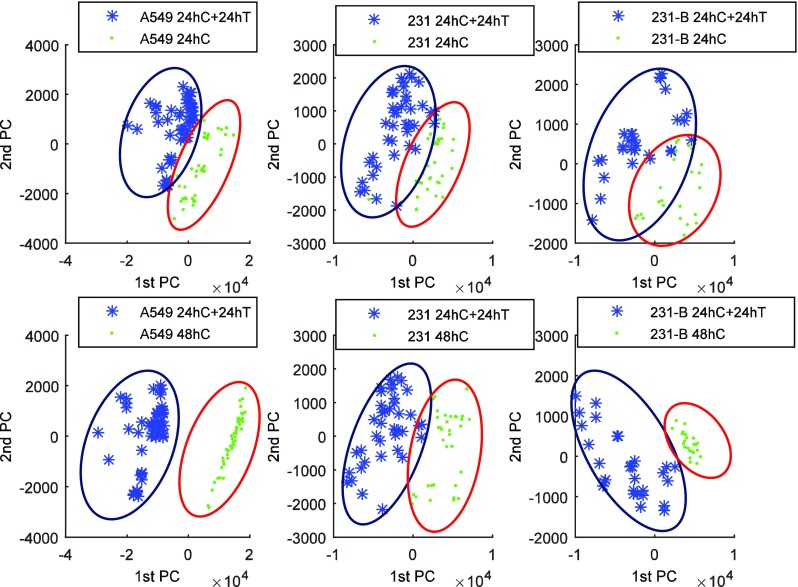
Principal component analysis (PCA) was conducted over the raw Raman spectra in the range (600–1800 cm−1). Figure 7 depicts the PCA-scores plot of PC1 vs PC2 obtained from our analysis. It was clearly seen that PCA results can distinguish the spectral differences for all cell types before and after DOX treatment. In the PCA score plot, the 1st principal component was found to incorporate 85.12%, 97.50%, 68.78%, 81.87%,74.35%, and 83.99% of the total variance for subplot “top left,” “top middle,” “top right,” “lower left,” “lower middle,” and “lower right,” respectively, and the 1st and 2nd principal components accounted for 89.39%, 78.49%,79.46%, 98.14%, 87.03%, and 85.69% of the total variance for subplots in the same order, respectively.
FIG. 7.
PCA analysis of the three types of cancer cells with and without DOX treatment. *designation of “C,” “T” is referred to Fig. 6.
The label “24hC” means the Raman spectra were acquired 24 h after control media control in the device. “24h C + 24hT” represents the cells were cultured for 48 h culture (24-h control culture and 24-h treatment culture). Data groups “24hC” and “24hC + 24hT” are both collected in the same microfluidic device. “48hC” indicates the cells were control-cultured for 48 h, whereas, cells were cultured and measured using different microfluidic devices.
In subplots (“lower left,” “top middle,” and “lower right”), a more dispersive distribution of sample points was observed in the treatment group compared with that of the control group. The DOX resistance varies in individual cells, and an uneven effect of DOX to individual cells may explain the dispersive distribution on the control group. Nevertheless, the majority of cells lined in the same trend. Our device for Raman detection was functionally proved as a non-invasive platform for cell fingerprint collection and cell discrimination.
IV. CONCLUSIONS
We introduced a novel microfluidic device that integrates Raman measurement and in situ single cell analysis. The device consists of three layers with the middle PDMS flow layer sandwiched by the top and bottom MgF2 optical window. This device has been proven useful in the detection of cancer cell interaction with anti-cancer drugs. The device is reusable and biocompatible for long-term cell culture (up to 72 h). AFM and Raman spectroscopy were applied to detect the responses of cancer cells exposed to anticancer drug DOX up to 24 h at the single cell level. The AFM cell biomechanics results from these cancer cells cultured in this microfluidic devices agreed well with our previously published results that were obtained from the same type of cells cultured in traditional culture dishes, suggesting that the biomechanical properties (Young's modulus and adhesion force) of the cells cultured in this microfluidic device were not affected, compared to the cells in the traditional culture dish. PCA results clearly distinguished the spectral differences before and after DOX treatment across all three cancer cell types. Most importantly, this device realizes the monitoring of cancer cell-drug interactions in the microfluidic device in a non-invasive way with the capability of measurements in different time points during the culturing, and minimizes the cross contamination in the otherwise the dish culture method that often occurs. Although this device dissipated the Raman signal a little, it still offers a new microfluidic based cell assay platform for in situ Raman spectroscopy monitoring of cell/drug interaction, and this device could be expanded with multiple channels for the application of potential multiplex and high throughput detection of anticancer drug/cancer cell interaction.
V. SUPPLEMENTARY MATERIAL
See supplementary material Fig. S1 for Young's modulus and adhesion force of 231 and 231-B cells with and without DOX exposure.
ACKNOWLEDGMENTS
We appreciate the financial support from the USU Presidential Innovation Initiative and the Utah Water Research Laboratory.
References
- 1. Ashton L., Lau K., Winder C. L., and Goodacre R., Future Microbiol. 6(9), 991–997 (2011). 10.2217/fmb.11.89 [DOI] [PubMed] [Google Scholar]
- 2. Dochow S., Beleites C., Henkel T., Mayer G., Albert J., Clement J., Krafft C., and Popp J., Anal. Bioanal. Chem. 405(8), 2743–2746 (2013). 10.1007/s00216-013-6726-3 [DOI] [PubMed] [Google Scholar]
- 3. Ling J., Weitman S. D., Miller M. A., Moore R. V., and Bovik A. C., Appl. Opt. 41(28), 6006–6017 (2002). 10.1364/AO.41.006006 [DOI] [PubMed] [Google Scholar]
- 4. Owen C. A., Notingher I., Hill R., Stevens M., and Hench L. L., J. Mater. Sci.-Mater. Med. 17(11), 1019–1023 (2006). 10.1007/s10856-006-0438-6 [DOI] [PubMed] [Google Scholar]
- 5. Owen C. A., Selvakumaran J., Notingher I., Jell G., Hench L. L., and Stevens M. M., J. Cell. Biochem. 99(1), 178–186 (2006). 10.1002/jcb.20884 [DOI] [PubMed] [Google Scholar]
- 6. Ock K.-S., Ganbold E. O., Park J., Cho K., Joo S.-W., and Lee S. Y., Analyst 137(12), 2852–2859 (2012). 10.1039/c2an35170f [DOI] [PubMed] [Google Scholar]
- 7. Salehi H., Derely L., Vegh A. G., Durand J. C., Gergely C., Larroque C., Fauroux M. A., and Cuisinier F. J. G., Appl. Phys. Lett. 102(11), 113701 (2013). 10.1063/1.4794871 [DOI] [Google Scholar]
- 8. Yeon J. H. and Park J.-K., BioChip J. 1(1), 17–27 (2007). [Google Scholar]
- 9. Jakeway S. C., de Mello A. J., and Russell E. L., Fresenius J. Anal. Chem. 366(6-7), 525–539 (2000). 10.1007/s002160051548 [DOI] [PubMed] [Google Scholar]
- 10. Kamholz A. E., Schilling E. A., and Yager P., Biophys. J. 80(4), 1967–1972 (2001). 10.1016/S0006-3495(01)76166-8 [DOI] [PMC free article] [PubMed] [Google Scholar]
- 11. Beebe D. J., Mensing G. A., and Walker G. M., Annu. Rev. Biomed. Eng. 4, 261–286 (2002). 10.1146/annurev.bioeng.4.112601.125916 [DOI] [PubMed] [Google Scholar]
- 12. Chovan T. and Guttman A., Trends Biotechnol. 20(3), 116–122 (2002). 10.1016/S0167-7799(02)01905-4 [DOI] [PubMed] [Google Scholar]
- 13. Balagadde F. K., You L. C., Hansen C. L., Arnold F. H., and Quake S. R., Sci. 309(5731), 137–140 (2005). 10.1126/science.1109173 [DOI] [PubMed] [Google Scholar]
- 14. Zaouk R., Park B. Y., and Madou M. J., Methods Mol. Biol. 321, 5–15 (2006). [DOI] [PubMed] [Google Scholar]
- 15. Huang C., Wang Q., Yao H.-L., Wang G.-W., and Li Y.-Q., Chin. J. Anal. Chem. 35(10), 1410–1414 (2007). [Google Scholar]
- 16. Ramser K., Wenseleers W., Dewilde S., Van Doorslaer S., and Moens L., Spectroscopy 22(4), 287–295 (2008). 10.1155/2008/463191 [DOI] [Google Scholar]
- 17. Dochow S., Krafft C., Neugebauer U., Bocklitz T., Henkel T., Mayer G., Albert J., and Popp J., Lab Chip 11(8), 1484–1490 (2011). 10.1039/c0lc00612b [DOI] [PubMed] [Google Scholar]
- 18. Perozziello G., Catalano R., Francardi M., Rondanina E., Pardeo F., De Angelis F., Malara N., Candeloro P., Morrone G., and Di Fabrizio E., Microelectron. Eng. 111, 314–319 (2013). 10.1016/j.mee.2013.02.023 [DOI] [Google Scholar]
- 19. Chrimes A. F., Khoshmanesh K., Stoddart P. R., Mitchell A., and Kalantar-zadeh K., Chem. Soc. Rev. 42(13), 5880–5906 (2013). 10.1039/c3cs35515b [DOI] [PubMed] [Google Scholar]
- 20. Syme C. D., Sirimuthu N. M. S., Faley S. L., and Cooper J. M., Chem. Commun. 46(42), 7921–7923 (2010). 10.1039/c0cc02209h [DOI] [PubMed] [Google Scholar]
- 21. Pallaoro A., Hoonejani M. R., Braun G. B., Meinhart C., and Moskovits M., J. Nanophotonics 7, 073092 (2013). 10.1117/1.JNP.7.073092 [DOI] [Google Scholar]
- 22. Wang Z., Zong S., Wu L., Zhu D., and Cui Y., Chem. Rev. 117(12), 7910–7963 (2017). 10.1021/acs.chemrev.7b00027 [DOI] [PubMed] [Google Scholar]
- 23. Smolsky J., Kaur S., Hayashi C., Batra S. K., and Krasnoslobodtsev A. V., Biosensors 7(1), 7 (2017). 10.3390/bios7010007 [DOI] [PMC free article] [PubMed] [Google Scholar]
- 24. Tycova A., Prikryl J., and Foret F., Electrophoresis 38(16), 1977–1987 (2017). 10.1002/elps.201700046 [DOI] [PubMed] [Google Scholar]
- 25. Morla-Folch J., Xie H. N., Gisbert-Quilis P., Pedro S. G. D., Pazos-Perez N., Alvarez-Puebla R. A., and Guerrini L., Angew. Chem. 127(46), 13854–13858 (2015). 10.1002/ange.201507682 [DOI] [PubMed] [Google Scholar]
- 26. Abu-Hatab N. A., John J. F., Oran J. M., and Sepaniak M. J., Appl. Spectrosc. 61(10), 1116–1122 (2007). 10.1366/000370207782217842 [DOI] [PubMed] [Google Scholar]
- 27. Katsumiti A., Arostegui I., Oron M., Gilliland D., Valsami-Jones E., and Cajaraville M. P., Nanotoxicology 10(2), 185–193 (2016). [DOI] [PubMed] [Google Scholar]
- 28. Fraga S., Faria H., Soares M. E., Duarte J. A., Soares L., Pereira E., Costa-Pereira C., Teixeira J. P., Bastos M. d L., and Carmo H., J. Appl. Toxicol. 33(10), 1111–1119 (2013). 10.1002/jat.2865 [DOI] [PubMed] [Google Scholar]
- 29. AshaRani P. V., Mun G. L. K., Hande M. P., and Valiyaveettil S., ACS Nano 3(2), 279–290 (2009). 10.1021/nn800596w [DOI] [PubMed] [Google Scholar]
- 30. Dracinsky M., Benda L., and Bour P., Chem. Phys. Lett. 512(1-3), 54–59 (2011). 10.1016/j.cplett.2011.06.077 [DOI] [Google Scholar]
- 31. Sundani H., Devabhaktuni V. K., Melkonian C., and Alam M., Journal of Micro/Nanolithography, MEMS, and MOEMS 12(1), 013002 (2013). 10.1117/1.JMM.12.1.013002 [DOI] [Google Scholar]
- 32. Vaidya K. S., Sanchez J. J., Kim E. L., and Welch D. R., Cancer Lett. 281(1), 100–107 (2009). 10.1016/j.canlet.2009.02.035 [DOI] [PMC free article] [PubMed] [Google Scholar]
- 33. Li Q., Xiao L., Harihar S., Welch D. R., Vargis E., and Zhou A., Anal. Methods 7(24), 10162–10169 (2015). 10.1039/C5AY01810B [DOI] [PMC free article] [PubMed] [Google Scholar]
- 34. McEwen G. D., Wu Y., Tang M., Qi X., Xiao Z., Baker S. M., Yu T., Gilbertson T. A., DeWald D. B., and Zhou A., Analyst 138(3), 787–797 (2013). 10.1039/C2AN36359C [DOI] [PubMed] [Google Scholar]
- 35. Xiao L., Tang M., Li Q., and Zhou A., Anal. Methods 5(4), 874–879 (2013). 10.1039/c2ay25951f [DOI] [Google Scholar]
- 36. Notingher I., Jell G., Notingher P. L., Bisson I., Tsigkou O., Polak J. M., Stevens M. M., and Hench L. L., J. Mol. Struct. 744–747, 179–185 (2005). 10.1016/j.molstruc.2004.12.046 [DOI] [Google Scholar]
- 37. Dodge M. J., Appl. Opt. 23(12), 1980–1985 (1984). 10.1364/AO.23.001980 [DOI] [PubMed] [Google Scholar]
- 38. Chang C. S. and Hon M. H., Mater. Chem. Phys. 81(1), 27–32 (2003). 10.1016/S0254-0584(02)00460-1 [DOI] [Google Scholar]
- 39. Wu Y., McEwen G. D., Harihar S., Baker S. M., DeWald D. B., and Zhou A., Cancer Lett. 293(1), 82–91 (2010). 10.1016/j.canlet.2009.12.016 [DOI] [PubMed] [Google Scholar]
- 40. Cross S. E., Jin Y.-S., Tondre J., Wong R., Rao J., and Gimzewski J. K., Nanotechnology 19(38), 384003 (2008). 10.1088/0957-4484/19/38/384003 [DOI] [PubMed] [Google Scholar]
- 41. Swaminathan V., Mythreye K., O'Brien E. T., Berchuck A., Blobe G. C., and Superfine R., Cancer Res. 71(15), 5075–5080 (2011). 10.1158/0008-5472.CAN-11-0247 [DOI] [PMC free article] [PubMed] [Google Scholar]
Associated Data
This section collects any data citations, data availability statements, or supplementary materials included in this article.
Supplementary Materials
See supplementary material Fig. S1 for Young's modulus and adhesion force of 231 and 231-B cells with and without DOX exposure.


