

Abstract
Objectives
To evaluate three testing strategies to identify new HIV diagnoses in Rhode Island (RI).
Methods
RI deployed three testing strategies, by using rapid HIV tests at clinical settings, community-based organization (CBO) settings, and the Partner Notification Services (PNS) program from 2012 to 2014. We reviewed the rapid HIV test results and confirmatory test results to identify new diagnoses, and conducted a cost-utility analysis.
Results
The average cost per new diagnosis was $33,015 at CBO settings, $5,446 at clinical settings, and $33,818 at the PNS program. The cost-utility analysis showed the state-wide program was cost-saving; testing was cost-saving at clinical settings, and cost-effective at CBO settings and the PNS program. Further analyses showed that cost-effectiveness varied widely across CBOs.
Conclusions
The HIV testing expansion program in RI was cost-saving overall. The heterogeneity of cost-effectiveness across settings should provide guidance to officials for allocation of future resources to HIV testing.
Keywords: HIV testing, rapid HIV tests, cost utility, economic evaluation
Introduction
In 2014, 1.2 million people lived with human immunodeficiency virus (HIV) infections in the United States, 13% of whom were unaware of their HIV status (1). A 2015 study found that infected individuals who are unaware of their HIV status contribute to more than one third of the ongoing HIV transmissions in the United States (US) (2). In an effort to reduce HIV transmissions due to undiagnosed infections, the Centers for Disease Control and Prevention (CDC) has called for an expansion of HIV testing outside of clinical settings to target high-risk individuals since 2003 (3). Specifically, the CDC recommended the use of rapid HIV tests in community-based organizations (CBOs). One advantage of using rapid HIV tests in CBOs is that they are conducted by non-laboratory personnel and produce results in less than 30 minutes, instead of having patients wait one to two days to return for their results.
More recently in 2015, the CDC awarded $216 million to CBOs across the nation to deliver the most effective HIV prevention strategies to high-risk populations, demonstrating CDC’s continued support for CBOs as important resources for HIV prevention (4). Indeed, studies have shown that the use of rapid HIV tests at CBOs increased the number of new diagnoses among high-risk groups: a review of national and international CBOs found that HIV testing at CBOs increased HIV testing and counseling uptake, and increased the proportion of first-time testers and proportion of patients linked to care (5); Bowles et al. showed that of the new HIV-positive cases identified at CBOs in seven US cities, 76% were from racial/ethnic minority groups, 58% identified themselves as men who have sex with men (MSM), and 72% reported having multiple sex partners in the past year (6). Targeting high-risk populations by CBOs has also been shown to be effective: Schulden et al. reported that the CBOs in three US cities that routinely provided services to transgender communities had a 12% diagnosis rate among participants. Twenty-seven CBOs funded by the CDC from 2001 to 2006 had an average diagnosis rate of 2.1% (7). These diagnosis rates are much higher than the national goal of 1%, indicating effective testing (8).
While the abovementioned studies confirmed that CBOs are effective in targeting high-risk populations, they did not examine comprehensively the cost aspect of HIV testing at CBOs nor its comparisons with other strategies. As funding for HIV prevention has decreased in recent years, research into how to make CBOs more cost-effective would be informative to policymakers for allocation of future resources to HIV testing programs. Rhode Island, with a diverse population of 1 million, expanded its HIV testing program between 2012 and 2014 in both clinical and CBO settings. In this study, we use data from the state of Rhode Island to compare the cost-effectiveness of HIV testing performed through three HIV case-finding strategies: (a) at a variety of CBO settings frequented by high-risk populations, such as bathhouses or social support centers, (b) at clinical settings, and (c) at the state’s Partner Notification Services (PNS) program. The objectives of the study were to identify the settings that are more cost-effective in identifying new HIV cases, and to make recommendations to policymakers on allocating future resources to the three strategies for HIV testing.
Methods
From 2012 to 2014, the Rhode Island Department of Health (DOH) provided funding to eight entities, including one sexually transmitted disease (STD) clinic, CBOs, and the state’s PNS program, for their efforts in targeting high-risk individuals for rapid HIV testing. To preserve their anonymity, the eight entities will not be named here. These entities provided the rapid HIV tests to clients at both clinical and CBO settings. Testing setting was the unit of analysis. The clinical setting was the only publicly-funded STD clinic in the state. The CBOs provided testing at various venues, including AIDS Services Organizations (ASOs), bathhouses, colleges, domestic violence support centers (DVSCs), social support centers such as substance abuse treatment facilities, behavioral health support facilities, and shelters for individuals with unstable housing, male sex worker (MSW) support centers, and female sex worker (FSW) support centers. In addition, we analyzed data for the DOH PNS program and the Rhode Island Department of Corrections Facilities. Testing settings varied in their level of outreach for testing. Some settings rely on walk-in interest for HIV testing, while others actively recruit individuals through street outreach or advertising campaigns. Most clients tested at the PNS program were referred by individuals who were recently diagnosed with HIV and voluntarily offered information on the individuals they thought were at risk. Referrals may also come from health professionals or social workers because of reported high-risk behaviors.
All rapid HIV tests were performed by testers who have been trained and licensed by the DOH to perform HIV rapid tests in the field. All clients being tested completed a standardized interview form, which includes self-reported demographic information, HIV testing history, and risk history. If a client had a reactive test, he/she was referred to a physician or medical clinic for a confirmatory test, which was the gold standard Western blot test to confirm an HIV infection. A client was deemed a new HIV-positive case if the confirmatory test was positive. Once the confirmatory test was complete, the DOH-funded entity was informed by the confirmatory testing lab. The DOH-funded entity then reported the confirmatory test result to the DOH, whose staff entered both rapid HIV test results and confirmatory test results into EvaluationWeb, a CDC-supported database for counselling, testing, and referral activities. While it is possible that a client was deemed HIV-positive by the confirmatory test multiple times, a de-duplication process was conducted between EvaluationWeb and the Rhode Island DOH Enhanced HIV/AIDS Reporting System (eHARS) to ensure that reported HIV cases were truly new diagnoses and not previous positives already in the system. That is, if the client had previously been deemed HIV-positive, he or she would be denoted in EvaluationWeb as a “previously positive.” Each client denoted “previously positive” was only counted once in our analyses.
We obtained de-identified testing data from 2012 to 2014 extracted from EvaluationWeb, which contains the rapid HIV test results and the confirmatory test results, as well as de-identified demographic information, HIV test history, and risk history from the client interviews. We also obtained cost data from the DOH, which contains the funds that the DOH allocated to each entity from 2012 to 2014. The DOH funded the entities through only one mechanism: the funding of rapid HIV test kits. To obtain DOH funding, the entities submitted monthly invoices for the number of rapid HIV test kits used, and the DOH paid for all test kits used. Because this study was conducted from the DOH’s perspective, we excluded any cost incurred by the entities, such as staff time, administrative cost, among others. In addition, we excluded all cost related to confirmatory tests, since the DOH only funded the rapid HIV tests. The PNS program was managed by the DOH, so the cost data was based on the number of staff members who managed the program and their pay scales. All analyses were conducted in 2015 dollars.
We reviewed the testing and cost data, and calculated the positivity rate by setting, which is the percentage of newly-confirmed positive cases among everyone who got tested at each setting. In addition, we calculated the cost per test and cost per newly-confirmed positive test by setting, by dividing the number of tests and the number of newly-confirmed positive tests, respectively, by the total cost at each setting. Because the funding was provided to each entity instead of each setting, we made the assumption that the cost per test was the same within each entity, regardless of the testing setting where it occurred. For example, if Entity A provided 70% of its tests at bathhouses and 30% at colleges, then we assume that Entity A spent 70% of its DOH funds on testing at bathhouses and 30% at colleges.
To carry out an economic evaluation of HIV testing settings, we conducted a cost-utility analysis. A setting’s cost-utility (R) was defined as R = (C-AT)/AQ, where C is the societal cost of a program’s cost of implementation, A is the number of HIV infections averted by each setting, T is the treatment cost of an HIV infection in a lifetime, and Q is the number of Quality Adjusted Life Years (QALYs) gained if one HIV infection is averted. In our analysis, the societal cost, C, only represented the cost from the perspective of the DOH, as other costs separately incurred to each setting was not available to us. As a result, C was proxied by the all funds allocated to each setting from the DOH. The number of HIV infections averted, A, was calculated by multiplying the total number of newly-identified cases at setting i, ni, by the difference in the transmission rates between HIV patients unaware of their HIV status (10.8 transmissions per 100 persons) and those aware of their status (3.0 transmissions per 100 persons) (2). Thus, the A for setting i is equal to ni * (10.8/100–3.0/100). The lifetime treatment cost of an HIV infection, T, is estimated to be $300,000 in 2011 (9). After being adjusted to 2015 dollars, the value of T was $347,719 (10). Finally, averting one HIV infection resulted in 5.83 QALYs (Q) gained (9). All these values are used to calculate cost utility, R.
A setting’s cost-saving threshold, defined by the term “C-AT,” is the value at which the setting’s implementation cost offsets the lifetime HIV treatment cost averted by the setting. Thus, a setting was considered cost-saving if its cost-utility was less than 0. A setting was considered cost-effective if its cost-utility was equal or less than $100,000 (9). A setting was considered not cost-effective if its cost-utility was greater than $100,000.
We also conducted sensitivity analyses to the cost-utility function at each setting. Given the lack of data and information on staffing and administrative costs at each setting, we think that varying staff time and administrative costs separately per test in sensitivity analyses would not be as informative as we hoped. However, it would be still helpful for the settings to know their cost-effective “threshold” spending, i.e., how much in total they can allocate staff time and administrative costs per rapid HIV test, and can still be cost-effective at identifying new positive cases. This number will help each setting decide how much more resources they can allocate to rapid HIV tests. Therefore, we calculated such thresholds at each setting by back-calculating the maximum societal cost C using the cost-utility equation R = (C − AT)/AQ, assuming that each setting has the maximum R at which the setting is still cost-effective, at 100,000 ($/QALY), while A, T, and Q stay the same. Each setting’s total cost-effective threshold spending, now part of the societal cost, is equal to the maximum societal cost calculated above minus the DOH funds to each setting. Each setting’s total threshold spending is then divided by the number of rapid HIV tests conducted to obtain the threshold spending per test, i.e., the maximum spending each setting can allocate to rapid HIV testing and still be cost-effective. The threshold spending was not calculated for the PNS program because the total cost to PNS included all program staff salaries, which represented all associated staff time and administrative costs.
Results
From 2012 to 2014, a total of 11,364 rapid HIV tests were performed across all settings, and 50 new positive cases were identified, 86% of whom were male (Table 1). Of all new positive cases, 42% were whites, 34% were Hispanics, and 14% were blacks. Most of the positive cases (62%) were MSM, 18% had low-risk heterosexual contacts, 6% had high-risk heterosexual contacts, 4% were intravenous drug users (IDUs), and 2% were both MSM and IDU.
Table 1.
Characteristics of everyone tested and newly-confirmed HIV-positive in the State of Rhode Island, 2012–2014
| All Tested | Newly-confirmed HIV-positive |
||||
|---|---|---|---|---|---|
| N | % | N | % | ||
| Total | 11,364 | 100% | 50 | 100% | |
|
| |||||
| Male | 7,439 | 65% | 43 | 86% | |
|
| |||||
| Race | White | 5,379 | 47% | 21 | 42% |
| Black/African American | 1,779 | 16% | 7 | 14% | |
| Hispanic | 3,108 | 27% | 17 | 34% | |
| Asian | 390 | 3% | 2 | 4% | |
| American Indian or Alaska Native | 119 | 1% | 1 | 2% | |
| Declined | 164 | 1% | 1 | 2% | |
|
| |||||
| Age | 13 to 19 | 785 | 7% | 0 | 0% |
| 20 to 29 | 4,296 | 38% | 22 | 44% | |
| 30 to 39 | 2,592 | 23% | 14 | 28% | |
| 40 to 49 | 2,022 | 18% | 7 | 14% | |
| 50 to 59 | 1,203 | 11% | 7 | 14% | |
| 60 and over | 451 | 4% | 0 | 0% | |
|
| |||||
| Risk Group | High-risk heterosexual contact | 413 | 4% | 3 | 6% |
| Low-risk heterosexual contact | 5,268 | 46% | 9 | 18% | |
| IDUa | 504 | 4% | 2 | 4% | |
| MSMb | 3,473 | 31% | 31 | 62% | |
| MSM/IDUc | 149 | 1% | 1 | 2% | |
| Unknown | 1,294 | 11% | 4 | 8% | |
IDU = intravenous drug users
MSM = men who have sex with men
MSM/IDU = individuals who are both men who have sex with men and intravenous drug users
The majority of the cases were identified at three types of settings (Figure 1). Thirty-two percent were identified at clinical settings, 30% at ASOs, and 22% at the PNS program, compared to 8% at bathhouses, 6% at MSW support centers, and 2% at social support centers. Colleges, DVSCs, correctional facilities, and FSW support centers did not identify any positive cases and thus were not shown in the figure.
Figure 1.
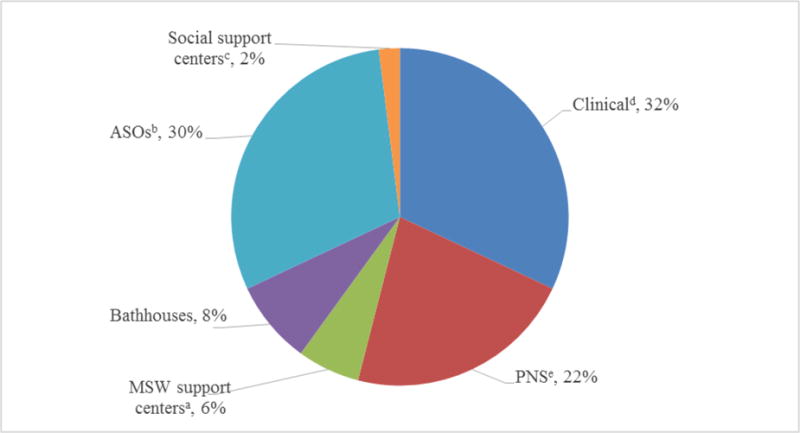
HIV-positive cases newly-identified by each clinical or non-clinical setting as a percentage of all HIV-positive cases, State of Rhode Island, 2012–2014*
*Colleges, domestic violence support centers (DVSCs), correctional facilities, and female sex workers (FSW) support centers were not shown in the figure because they did not identify any positive cases.
aMSW = male sex workers
bASOs = AIDS services organizations
cSocial support centers include substance abuse treatment facilities, behavioral health support facilities, and shelters for individuals with unstable housing
dClinical setting is the sexually transmitted disease (STD) clinic
ePNS = Partner Notification Services
The overall positivity rate of all tests provided by the DOH-funded strategies was 0.44% (Table 2). Clinical settings performed 2,545 tests, of which 0.63% were new positive cases. CBO settings performed 8,551 tests, of which 0.27% were new positive cases. The PNS program and the correctional facilities performed 158 and 110 tests, with positivity rates of 6.96% and 0%, respectively. Clinical settings received a total of $87,136 from the DOH for HIV testing from 2012 to 2014, the average cost per test was therefore $34, while the average cost per positive test was $5,446. The CBOs received a total of $759,346; the average cost per test was therefore $89, while the average cost per positive test was $33,015. The PNS program received $372,000, the average cost per test was $2,354, while the average cost per positive test was $33,818. The correctional facilities received $3,766; the average cost per test was therefore $34 (Its average cost per positive test cannot be calculated since no positive case was identified).
Table 2.
Comparison of clinical and non-clinical settings in HIV testing outcomes and program costs, State of Rhode Island, 2012–2014
| Total | Clinicala | CBOsb | PNSc | Correction facilities | |
|---|---|---|---|---|---|
| No. of Positives | 50 | 16 | 23 | 11 | 0 |
| Total No. of tests | 11,364 | 2,545 | 8,551 | 158 | 110 |
| Positivity rate (%)d | 0.44 | 0.63 | 0.27 | 6.96 | 0.00 |
| No. of averted HIV infections (A) | 3.90 | 1.25 | 1.79 | 0.86 | 0.00 |
| Cost ($, in 2015 dollars) | |||||
| Total costs (C) | 1,222,248 | 87,136 | 759,346 | 372, 000 | 3,7 66 |
| Average cost per positive test | 24,445 | 5,446 | 33,015 | 33,818 | – |
| Average cost per test | 108 | 34 | 89 | 2,354 | 34 |
| Cost-utility: R = (C − AT)/AQ ($/QALY)e | −5,887 | −47,667 | 12,959 | 14,725 | – |
| Interpretationf | cost-saving | cost-saving | cost-effective | cost-effective | not cost-effective |
| Threshold spending at which each setting is still cost-effective ($)g | 212 | 422 | 106 | – | – |
Clinical setting is the sexually transmitted disease (STD) clinic
CBOs = community-based organizations
PNS = Partner Notification Services
Positivity rate is the percentage of newly-confirmed positive test results among everyone who got tested. For example, the overall positivity rate of the program was .
Cost-utility: R = (C − AT)/AQ ($/QALY), where C is the societal cost of a program’s cost of implementation, A is the number of HIV infections averted by each setting, T is the treatment cost of an HIV infection in a lifetime, and Q is the number of Quality Adjusted Life Years (QALYs) gained if one HIV infection is averted. The number of HIV infections averted, A, was calculated by multiplying the total number of newly-identified cases at setting i, ni, by the difference in the transmission rates between HIV patients unaware of their HIV status (10.8 transmissions per 100 persons) and those aware of their status (3.0 transmissions per 100 persons). Thus, the A for setting i is equal to ni, * (10.8/100–3.0/100). The lifetime treatment cost of an HIV infection, T, is estimated to be $300,000 in 2011, or $347,719 in 2015 dollars. Finally, averting one HIV infection resulted in 5.83 QALYs (Q) gained. All these values are then used to calculate cost utility, R.
Interpretation of cost-utility: cost-saving if R<$0 per QALY; cost-effective if R<$100,000 per QALY; not cost-effective if R>$100,000 per QALY.
The threshold spending at each setting by back-calculating the maximum societal cost C using the cost-utility equation R = (C − AT)/AQ, assuming that each setting has the maximum R at which the setting is still cost-effective, at 100,000 ($/QALY), while A, T, and Q stay the same. Each setting’s total cost-effective threshold spending, now part of the societal cost, is equal to the maximum societal cost calculated above minus the DOH funds to each setting. Each setting’s total threshold spending is then divided by the number of rapid HIV tests conducted to obtain the threshold spending per test, i.e., the maximum spending each setting can allocate to rapid HIV testing and still be cost-effective.
The DOH’s HIV testing expansion program spent a total of $1.2 million, and averted 3.90 new HIV infections from 2012 to 2014. The cost-saving threshold was determined to be $27,122 per new HIV diagnosis. The cost-utility analysis showed that the state program as a whole was cost-saving with a cost-utility of $-5,887. The analysis also showed that the clinical setting was cost-saving with a cost-utility of $-47,667; while the CBO settings and PNS program were cost-effective with cost-utilities of $12,959 and $14,725, respectively. Testing at correctional facilities was not cost-effective.
The positivity rates varied widely across all CBO settings, ranging from 0% to 1.02% (Table 3). Colleges, DVSCs, and FSW support centers did not identify any positive cases. Because of the wide range of positivity rates across non-clinical settings, the average cost per test and average cost per positive test also varied widely across the settings. The average cost per test ranged from $49 at colleges to $901 at the FSW support centers. The average cost per positive test ranged from $9,168 at bathhouses to $119,245 at social support centers. Cost-effectiveness varied widely across CBO settings. Of all CBO settings, testing at bathhouses and ASOs were cost-saving with cost-utilities of $-39,482 and $-29,082, respectively, while testing at MSW support centers was cost-effective with a cost-utility of $4,117. All other CBO settings were not cost-effective.
Table 3.
Comparison of community-based organization settings in mean rapid HIV testing outcomes and program costs, State of Rhode Island, 2012–2014
| Total | MSWa support centers | Bathhouses | ASOsb | Social support centersc | Colleges | DVSCsd | FSWe support centers | Other | |
|---|---|---|---|---|---|---|---|---|---|
| No. of Positives | 23 | 3 | 4 | 15 | 1 | 0 | 0 | 0 | 0 |
| Total No. of tests | 8,551 | 295 | 688 | 3,657 | 1,794 | 968 | 104 | 163 | 882 |
| Positivity Rate (%)f | 0.27 | 1.02 | 0.58 | 0.41 | 0.06 | 0.00 | 0.00 | 0.00 | 0.00 |
| No. of averted HIV infections (A) | 1.79 | 0.23 | 0.31 | 1.17 | 0.08 | 0.00 | 0.00 | 0.00 | 0.00 |
| Cost ($, in 2015 dollars) | |||||||||
| Total costs (C) | 759,346 | 86,982 | 36,673 | 208,457 | 119,245 | 47,373 | 48,868 | 146,933 | 64,815 |
| Average cost per positive test | 33,015 | 28,994 | 9,168 | 13,897 | 119,245 | – | – | – | – |
| Average cost per test | 89 | 295 | 53 | 57 | 66 | 49 | 470 | 901 | 73 |
| Cost-utility: | |||||||||
| R = (C − AT)/AQ ($/QALY)g | 12,959 | 4,117 | −39,482 | −29,082 | 202,583 | – | – | – | – |
| Interpretationh | cost-effective | cost-effective | cost-saving | cost-saving | not cost-effective | not cost-effective | not cost-effective | not cost-effective | not cost-effective |
| Threshold spending at which each setting is still cost-effective ($)i | 106 | 443 | 369 | 241 | – | – | – | – | – |
MSW = male sex workers
ASOs = AIDS services organizations
Social support centers include substance abuse treatment facilities, behavioral health support facilities, and shelters for individuals with unstable housing
DVSCs = domestic violence support centers
FSW = female sex workers
Positivity rate is the percentage of newly-confirmed positive test results among everyone who got tested. For example, the overall positivity rate of the program was .
Cost-utility: R = (C − AT)/AQ ($/QALY), where C is the societal cost of a program’s cost of implementation, A is the number of HIV infections averted by each setting, T is the treatment cost of an HIV infection in a lifetime, and Q is the number of Quality Adjusted Life Years (QALYs) gained if one HIV infection is averted. The number of HIV infections averted, A, was calculated by multiplying the total number of newly-identified cases at setting i, ni, by the difference in the transmission rates between HIV patients unaware of their HIV status (10.8 transmissions per 100 persons) and those aware of their status (3.0 transmissions per 100 persons). Thus, the A for setting i is equal to ni * (10.8/100–3.0/100). The lifetime treatment cost of an HIV infection, T, is estimated to be $300,000 in 2011, or $347,719 in 2015 dollars. Finally, averting one HIV infection resulted in 5.83 QALYs (Q) gained. All these values are then used to calculate cost utility, R.
Interpretation of cost-utility: cost-saving if R<$0 per QALY; cost-effective if R<$100,000 per QALY; not cost-effective if R>$100,000 per QALY.
The threshold spending at each setting by back-calculating the maximum societal cost C using the cost-utility equation R = (C − AT)/AQ, assuming that each setting has the maximum R at which the setting is still cost-effective, at 100,000 ($/QALY), while A, T, and Q stay the same. Each setting’s total cost-effective threshold spending, now part of the societal cost, is equal to the maximum societal cost calculated above minus the DOH funds to each setting. Each setting’s total threshold spending is then divided by the number of rapid HIV tests conducted to obtain the threshold spending per test, i.e., the maximum spending each setting can allocate to rapid HIV testing and still be cost-effective.
Our sensitivity analysis showed that overall, each setting can spend an additional $212 and still be cost-effective. Notably, clinical settings can spend an additional $422 and still be cost-effective, while the CBO settings can spend an additional $106. This threshold spending varied across CBO settings, highest at MSW support centers at $433, and lowest at ASOs at $241.
Discussion
Our study examined the cost and cost-utility of the rapid HIV testing expansion program in the state of Rhode Island between 2012 and 2014. It showed that across all testing settings, cost and positivity rate both varied considerably, resulting in wide ranges of cost per positive test and cost per test. Most notably, our study showed that the state HIV testing program, as a whole, was overall cost-saving; that is, on average, the resources invested on HIV testing will be more than recouped in the future in terms of HIV treatment costs avoided. Initial analysis showed that testing at clinical settings was cost-saving, and thus the best strategy compared to testing at CBO settings overall and the PNS program. Further stratification of CBO settings, nevertheless, revealed substantial variation in cost-effectiveness across CBO settings. Specifically, testing at bathhouses and ASOs were both cost-saving, and MSW support centers cost-effective, even though most other CBO settings were not cost-effective.
This study contributes to the literature in three important ways. First, to the best of our knowledge, this is the first to examine the cost-effectiveness of rapid HIV testing at a state level in the US. Similar studies such as Shrestha et al. and Castel et al. have been conducted in urban centers or at specific programs, but none has been done for the general population at a state level (11,12). Second, few studies, besides Shrestha et al. 2008, have been able to categorize the community settings where CBOs provided rapid HIV testing. Our study is able to do so with detailed information on the type of settings and compare the cost-effectiveness across various types of CBO settings. Third, we were able to compare the cost-effectiveness at clinical and CBO settings with the state’s Partner Notification Service program and correctional facilities providing a full picture of the policy options at the state level.
Our cost-utility analysis determined that a setting was cost-saving if it identified at least one new case per $21,122 invested, which is comparable to what was found in a study on men who have sex with men in the US, at $21,005 (adjusted to 2015 dollars from $20,645 in 2013 dollars) (13). As policymakers regularly monitor an HIV testing program, this threshold provides a standard that policymakers can readily use to assess the performance of an HIV testing program. While some of the testing settings in our analysis had a cost-utility under the cost-saving, many were not cost-effective either because they identified too few cases (in most cases, zero new cases), or they cost considerably more. This underscored the need for HIV testing programs to regularly monitor their performance, and when the cost-utility of the program changes, the programs can promptly evaluate the reasons for success and failures. This result may also suggest that the settings that are not cost-effective may need to improve their efforts in targeting higher-risk populations, in order to improve their cost-utility.
The low positivity rate of 0.27% at CBO settings is lower than what other studies have found at CBO settings: Shrestha et al. reported 0.7% and 1.5% in Kansas City, Missouri and Detroit, Michigan, respectively (14); Bowles et al. reported an average of 1.1% among seven major US cities (6). The positivity rate among CBOs also falls short of the CDC goal of 1% nationally, which indicates room for improvement for the DOH-funded entities at targeting high-risk populations. The low positivity rate among groups with historically high HIV rates (e.g. FSWs) could indicate a low prevalence in these groups in the state, or that further efforts may be needed to engage sub-populations with higher risk. This study also suggests that testing at the PNS program, with positivity rates of 6.96%, is more effective than all other settings at identifying new positive cases. This result is consistent with current literature. A review found that the median new diagnosis rate in PNS programs is 8% (15). Another systematic review of nine studies found that PNS new diagnosis rates range from 1% to 8% (16). Because the positivity rate is significantly higher at the PNS program and the individuals tested come from notification of potential exposure, it is important for the PNS program staff to document the individuals’ risk profile and by whom these individuals were referred in the future. This information may help strengthen high-risk targeting efforts by the health professionals or facilities that referred the new positive cases.
The cost per test per new positive case in clinical settings, at $5,446, is consistent with what has been reported in other studies, from $2,065 to $10,870 (in 2015 dollars) (17). The average cost per HIV-positive test at CBO settings is $33,015, which is higher than the range found in existing studies, from $11,233 to $22,188 (2015 dollars) (17). Of note is that the cost per positive case in the social support centers, at $119,245, is the driver of the high cost (and clearly an outlier); the other CBO settings are reasonably close to the national range, from $9,168 to $28,994.
There are three main limitations. First, this study attempted to investigate the cost-utility of HIV testing by setting, not by entity. But because the DOH funding was allocated to the entities, not setting types, we assumed that the cost per HIV rapid test was the same across all settings employed by an entity, which may not be true, as some settings may require more resources than others for their outreach efforts. Second, because the DOH funded the entities only through rapid HIV test kits, we were not able to account for all the cost associated with testing an individual, such as staff time, administrative cost, among others. Thus, the cost-utility analysis does not fully account for all societal costs, and instead is a partial analysis from the perspective of the DOH funds, which may underestimate the cost that the society is paying for avoiding one future HIV infection. Third, the risk categories were self-reported, so recall bias may be present as individuals may misreport risk categories to avoid stigma or discrimination.
In spite of the limitations, this cost-utility analysis of public health HIV case-finding strategies at the state level provides important insights for future research and programmatic decisions. This study showed the variability in positivity rates found by different rapid HIV testing settings and the variability in costs and cost-utility associated with conducting a rapid HIV test and identifying a new case of HIV. These data are critical for allocating resources and planning HIV prevention initiatives that target high risk populations. Rhode Island is a low morbidity state with a mature HIV epidemic. Like other jurisdictions, Rhode Island is also experiencing a reduction in state and federal HIV prevention funding. These findings should be considered in future program planning and in the planning of continual monitoring and evaluation activities. The ongoing monitoring of rapid HIV testing strategies in the state from a positivity and cost-effectiveness perspective can help the strategies use funding efficiently and target high-risk populations more effectively.
Acknowledgments
Funding: This study was funded by the Rhode Island Department of Health through a Preventive Health and Health Services (PHHS) Block Grant from the Centers for Disease Control and Prevention (CDC).
Footnotes
Compliance with Ethical Standards
Conflict of Interest: All coauthors declare no conflict of interest.
Ethical approval: This article does not contain any studies with human participants or animals performed by any of the authors.
References
- 1.Centers for Disease Control and Prevention. HIV in the United States: At A Glance [Internet] [cited 2016 Aug 8]. Available from: http://www.cdc.gov/hiv/statistics/overview/ataglance.html.
- 2.Skarbinski J, Rosenberg E, Paz-Bailey G, Hall HI, Rose CE, Viall AH, et al. Human immunodeficiency virus transmission at each step of the care continuum in the United States. JAMA Intern Med. 2015 Apr;175(4):588–96. doi: 10.1001/jamainternmed.2014.8180. [DOI] [PubMed] [Google Scholar]
- 3.Centers for Disease Control and Prevention. Advancing HIV Prevention: New Strategies for a Changing Epidemic — United States, 2003 [Internet] 2003 doi: 10.1001/jama.289.19.2493. [cited 2016 Jun 12]. Available from: https://www.cdc.gov/mmwr/preview/mmwrhtml/mm5215a1.htm. [DOI] [PubMed]
- 4.Press Release: Community-Based Organization Awards for HIV Prevention [Internet] Centers for Disease Control and Prevention, Division of HIV/AIDS Prevention, Capacity Building Branch; 2015. [cited 2016 Jul 19]. Available from: http://www.cdc.gov/nchhstp/newsroom/2015/cbo-foa-awards-press-release.html. [Google Scholar]
- 5.Suthar AB, Ford N, Bachanas PJ, Wong VJ, Rajan JS, Saltzman AK, et al. Towards Universal Voluntary HIV Testing and Counselling: A Systematic Review and Meta-Analysis of Community-Based Approaches. PLOS Med. 2013 Aug 13;10(8):e1001496. doi: 10.1371/journal.pmed.1001496. [DOI] [PMC free article] [PubMed] [Google Scholar]
- 6.Bowles KE, Clark HA, Tai E, Sullivan PS, Song B, Tsang J, et al. Implementing Rapid HIV Testing in Outreach and Community Settings: Results from an Advancing HIV Prevention Demonstration Project Conducted in Seven U.S. Cities. Public Health Rep. 2008;123(Suppl 3):78–85. doi: 10.1177/00333549081230S310. [DOI] [PMC free article] [PubMed] [Google Scholar]
- 7.Stein R, Green K, Bell K, Toledo CA, Uhl G, Moore A, et al. Provision of HIV counseling and testing services at five community-based organizations among young men of color who have sex with men. AIDS Behav. 2011 May;15(4):743–50. doi: 10.1007/s10461-010-9821-x. [DOI] [PubMed] [Google Scholar]
- 8.Centers for Disease Control and Prevention. Planning and Implementing HIV Testing and Linkage Programs in Non-Clinical Settings: A Guide for Program Managers [Internet] CDC; [cited 2017 Jan 3]. Available from: https://effectiveinterventions.cdc.gov/docs/default-source/public-health-strategies-docs/HIVTestingImplementationGuide_Final.pdf?sfvrsn=0.
- 9.Farnham PG, Holtgrave DR, Gopalappa C, Hutchinson AB, Sansom SL. Lifetime costs and quality-adjusted life years saved from HIV prevention in the test and treat era. J Acquir Immune Defic Syndr 1999. 2013 Oct 1;64(2):e15–18. doi: 10.1097/QAI.0b013e3182a5c8d4. [DOI] [PubMed] [Google Scholar]
- 10.CPI Inflation Calculator [Internet] [cited 2017 Jan 10]. Available from: https://www.bls.gov/data/inflation_calculator.htm.
- 11.Golden MR, Gift TL, Brewer DD, Fleming M, Hogben M, St Lawrence JS, et al. Peer referral for HIV case-finding among men who have sex with men. AIDS Lond Engl. 2006 Oct 3;20(15):1961–8. doi: 10.1097/01.aids.0000247118.74208.6a. [DOI] [PubMed] [Google Scholar]
- 12.Shrestha RK, Sansom SL, Richardson-Moore A, French PT, Scalco B, Lalota M, et al. Costs of voluntary rapid HIV testing and counseling in jails in 4 states–advancing HIV Prevention Demonstration Project, 2003–2006. Sex Transm Dis. 2009 Feb;36(2 Suppl):S5–8. doi: 10.1097/olq.0b013e318148b69f. [DOI] [PubMed] [Google Scholar]
- 13.Zulliger R, Maulsby C, Solomon L, Baytop C, Orr A, Nasrullah M, et al. Cost-utility of HIV Testing Programs Among Men Who Have Sex with Men in the United States. AIDS Behav. 2017 Mar;21(3):619–25. doi: 10.1007/s10461-016-1547-y. [DOI] [PubMed] [Google Scholar]
- 14.Shrestha RK, Clark HA, Sansom SL, Song B, Buckendahl H, Calhoun CB, et al. Cost-effectiveness of finding new HIV diagnoses using rapid HIV testing in community-based organizations. Public Health Rep Wash DC 1974. 2008 Dec;123(Suppl 3):94–100. doi: 10.1177/00333549081230S312. [DOI] [PMC free article] [PubMed] [Google Scholar]
- 15.Brewer DD. Case-finding effectiveness of partner notification and cluster investigation for sexually transmitted diseases/HIV. Sex Transm Dis. 2005 Feb;32(2):78–83. doi: 10.1097/01.olq.0000153574.38764.0e. [DOI] [PubMed] [Google Scholar]
- 16.Hogben M, McNally T, McPheeters M, Hutchinson AB. The effectiveness of HIV partner counseling and referral services in increasing identification of HIV-positive individuals a systematic review. Am J Prev Med. 2007 Aug;33(2 Suppl):S89–100. doi: 10.1016/j.amepre.2007.04.015. [DOI] [PubMed] [Google Scholar]
- 17.HIV Cost-effectiveness [Internet] Centers for Disease Control and Prevention; 2015. Sep, [cited 2016 Jun 21]. Available from: http://www.cdc.gov/hiv/programresources/guidance/costeffectiveness/index.html. [Google Scholar]