Abstract
Front-line tuberculosis (TB) drugs have been characterized extensively in vitro and in vivo with respect to gene expression and cell viability. However, little work has been devoted to understanding their effects on physiology of the cell envelope, one of the main targets of this clinical regimen. Here, we use metabolic labeling methods to visualize the effects of TB drugs on cell envelope dynamics in mycobacterial species. We developed a new fluorophore-trehalose conjugate to visualize trehalose monomycolates of the mycomembrane with super-resolution microscopy. We also probed the relationship between mycomembrane and peptidoglycan dynamics using a dual metabolic labeling strategy. Finally, we found that metabolic labeling of both cell envelope structures reports on drug effects on cell physiology in two hours, far quicker than a genetic sensor of cell envelope stress. Our work provides insight into acute drug effects on cell envelope biogenesis in live mycobacteria.
Keywords: mycobacteria, cell envelope, metabolic labeling, live-cell imaging, front-line TB drugs
TOC image
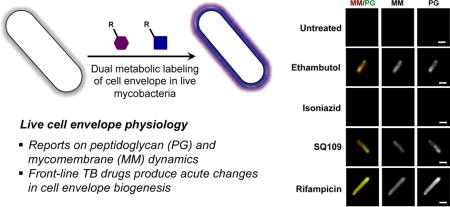
Over a fourth of the world’s population is thought to be infected with TB, which is caused by the bacterial pathogen Mycobacterium tuberculosis (Mtb).[1] Clinical treatment requires a cocktail of up to 4 drugs prescribed during 6 months. Furthermore, failure to complete extensive drug treatments has led to increased drug resistance.[2,3] As part of front-line TB treatment, ethambutol and isoniazid[2] disrupt the biosynthesis of components of the cell envelope, a formidable barrier to many host stresses and therapeutics.[4–7] Despite the identification of enzymatic drug targets, our current understanding of how existing drugs alter live cell physiology remains inadequate due to a lack of tools to monitor cell envelope dynamics in real-time at the single-cell level. Therefore, new molecular methods that interrogate TB drug effects on cell envelope physiology are needed.
Mycobacterial peptidoglycan (PG), a major component of the cell envelope, is covalently modified with arabinogalactan polymers, which in turn are elaborated with long lipid chains called mycolic acids (Figure 1).[8] These mycolic acids form the inner leaflet of the mycomembrane (MM), which also includes an outer leaflet constituted by a variety of non-covalently associated lipids (Figure 1A). The most abundant glycolipids are trehalose monomycolate (TMM) and trehalose dimycolate (TDM), which together with remaining lipids account for 60% of the cell envelope.[9] Historically, the cell envelope has been characterized by bulk isolation and purification of individual components, an approach that necessarily destroys important information regarding its native architecture and dynamics.[8]
Figure 1.
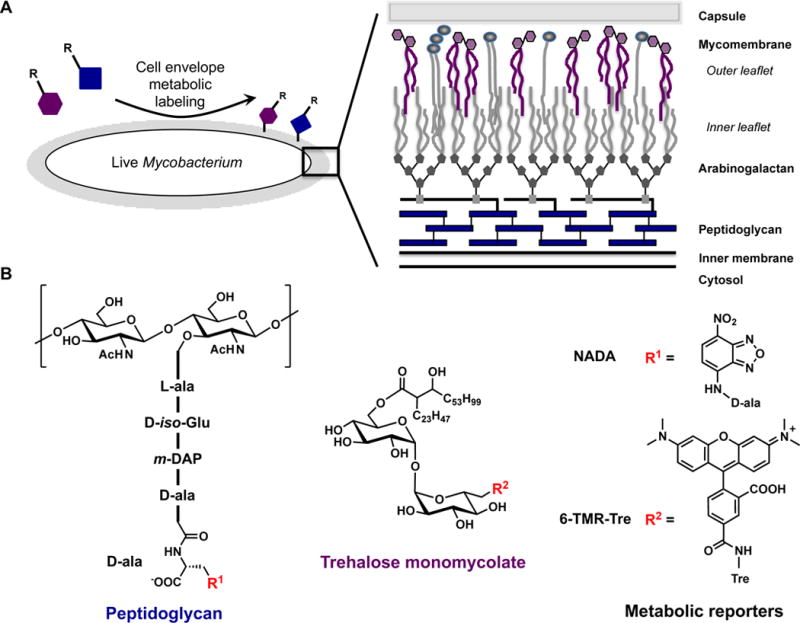
Metabolic labeling of the mycobacterial cell envelope with peptidoglycan and trehalose monomycolate reporters. A) Metabolic labeling of the mycobacterial cell envelope, which is compromised of inner membrane, peptidoglycan, arabinogalactan, mycomembrane, and capsule. B) Chemical structures for peptidoglycan and trehalose monomycolate with metabolic reporters NADA and 6-TMR-Tre.
For this reason, methods for molecular imaging of intact mycobacterial cell envelope components have become the subject of much recent attention, particularly the use of metabolic labeling to deliver synthetic probes to specific structures.[10] For example, PG[11–14] and trehalose glycolipids[15–20] can be imaged using synthetic metabolic precursors modified with fluorophores or bioorthogonal handles that exploit enzyme promiscuities during biosynthesis. These tools have been used to individually probe the distribution of the respective structures during cell growth and host cell infection.[10,21] However, these metabolic labeling reagents have not yet been used in combination to provide a more holistic view of how mycobacteria orchestrate multiple cell envelope components during cell growth and biological stresses. Simultaneous labeling of multiple cell envelope components may reveal aspects of cell physiology, metabolic state, and population heterogeneity that are not evident through the lens of a single molecular structure. As well, dual visualization of PG and MM perturbations induced by front-line drug treatment may shed light on their mechanisms of toxicity and inform the design of next-generation drug cocktails.
Here, we developed a new trehalose fluorophore conjugate to image TMM by super-resolution microscopy in live mycobacteria. We utilized a dual metabolic labeling strategy to monitor the biosynthetic dynamics and subcellular distribution of both PG and TMM in Mycobacterium marinum (Mm), a pathogenic species that is one of the closest genetic relatives to Mtb[22] (Figure 1B). With this dual metabolic labeling approach, we found that mycobacteria undergo a drastic shift in their cell envelope biosynthesis program when cells are treated with MM-targeting front-line TB drugs. Our work revealed a fast biochemical modulation of cell envelope biogenesis during TB drug exposure that precedes a transcriptional response.
Seminal work from Barry, Davis and coworkers demonstrated that synthetic trehalose reporters are processed by the antigen 85 complex (Ag85), a family of mycolyltransferases that resides in the cell envelope and converts 2 molecules of TMM to form TDM and free trehalose.[15,23] Work from our lab and others has shown that certain fluorescein-conjugated trehalose analogs are processed by mycolyltransferases from a range of mycolic acid-producing actinobacteria.[15,20] However, the poor photostability of fluorescein limited our ability to perform fluorescence imaging over extended time periods and super-resolution microscopy studies. A tetramethylrhodamine (TAMRA)-trehalose conjugate would be far better suited to these goals, and likewise, TAMRA has been a popular choice for super-resolution imaging of both bacterial and mammalian cells.[24] Our previous studies showed that, among a panel of regioisomeric fluorescein-trehalose conjugates, the 6-fluorescein analog (6-FlTre) was incorporated most efficiently into TMM of Mycobacterium smegmatis (Ms),[20] an established model organism with a MM similar to that of Mtb. We installed TAMRA at this position to afford TAMRA-trehalose conjugate, 6-TMR-Tre, synthesized from the corresponding 6-azido trehalose[25] precursor (see SI methods). Treatment of Ms in liquid culture with 6-TMR-Tre for short pulses produced polar fluorescence labeling (Figure S1), in agreement with the known polar localization of cell envelope biosynthetic enzymes during log phase growth.[26–28] Gratifyingly, 6-TMR-Tre did not label bacteria devoid of trehalose mycolates such as Gram-positive Bacillus subtilis or Gram-negative Escherichia coli (Figure S2).
We performed several experiments to confirm that 6-TMR-Tre was being processed by Ag85 and incorporated into TMM. Consistent with this notion, 6-TMR-Tre labeling was reduced in Ms and Mm when co-incubated with unmodified trehalose in a dose-dependent fashion (Figure 2A). In addition, we tested the effect of ebselen, a covalent Ag85 inhibitor,[29] on 6-TMR-Tre labeling efficiency. With the same incubation periods used for trehalose competition studies, ebselen treatment significantly reduced metabolic incorporation of 6-TMR-Tre in both mycobacterial species (Figure 2B). Finally, we extracted the apolar total lipid fraction of 6-TMR-Tre-labeled mycobacteria and analyzed it by thin layer chromatography (TLC). Fluorescence scanning of TLC plates revealed a single fluorescent band corresponding to TMM labeled with 6-TMR-Tre in both Ms and Mm (Figure S3). These experiments were also carried out with Corynebacterium glutamicum to demonstrate selective labeling of TMM by 6-TMR-Tre (Figure S4). Collectively, these results show that 6-TMR-Tre is metabolically incorporated into TMM within the cell envelope.
Figure 2.
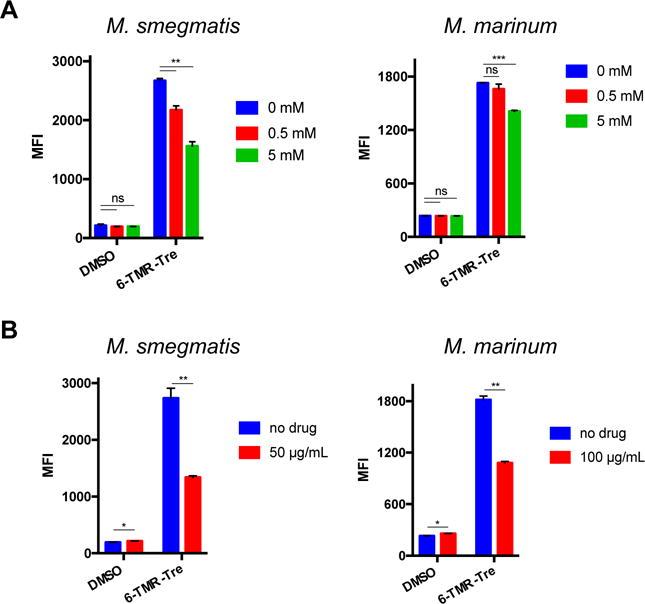
6-TMR-Tre is incorporated into the mycomembrane through an Ag85-mediated pathway. Ms and Mm were labeled with 100 μM 6-TMR-Tre for 3 and 4 h, respectively. A) Trehalose reduces 6-TMR-Tre labeling in a dose-dependent manner during bacterial growth. B) Ebselen treatment during to 6-TMR-Tre labeling decreases incorporation of 6-TMR-Tre into the mycomembrane of both species. Error bars depict standard deviation of three replicate experiments. Results are representative of at least two independent experiments. Statistical significance is given by *P < 0.05, **P < 0.01, ***P < 0.001. Mean fluorescence intensity (MFI)
We employed 6-TMR-Tre labeling to visualize the subcellular organization of TMM by structured illumination microscopy (SIM). We pulsed Ms cells with 6-TMR-Tre for 5, 15 or 30 min, where increasing incubation times afforded stronger labeling of the polar regions of cells (Figure 3A). Labeled glycolipids were observed at the very tips of cell poles, where 6-TMR-Tre is likely processed by Ag85 in the cell envelope.[15,20] We also observed heterogeneous labeling along the cell length when Mm was incubated with 6-TMR-Tre for 45 min (Figure 3B). To our knowledge, this is the first example of super-resolution microscopy of trehalose mycolates in mycobacteria.
Figure 3.
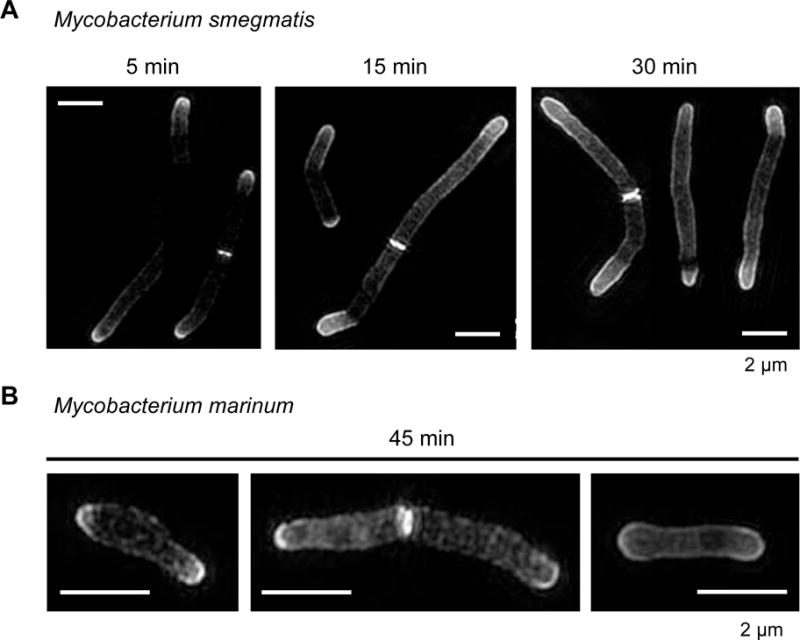
Structured illumination microscopy reveals polar addition of 6-TMR-Tre in mycobacteria. (A) Ms cells were incubated for 5, 15 or 15 min with 6-TMR-Tre prior to SIM visualization. (B) Short pulse of 45 min in Mm reveals ultrastructural information on TMM mycomembrane organization. Maximum intensity projections of z-stack images are shown. Scale bar, 2 μm
We then sought to simultaneously monitor the dynamics of labeled TMM and PG, which we labeled with the fluorescent D-alanine derivative NADA.[11] In a single labeling step, we treated Mm in liquid culture with short pulses of both NADA and 6-TMR-Tre. We found strong colocalization of NADA and 6-TMR-Tre fluorescence at the poles, where enzymes involved in new PG and TMM biosynthesis are primarily localized (Figure 4).[26,27] Interestingly, we observed increasing labeling of the mycobacterial side-wall at longer incubations with both reporters, suggesting the occurrence of remodeling or maturation processes within the existing cell envelope. These observations were also made for Ms cells that were labeled for 5, 15 or 30 min (Figure 4A). Taken together, our results demonstrate that dual labeling of live mycobacteria reveals real-time dynamics of cell envelope components with subcellular resolution during cell growth.
Figure 4.
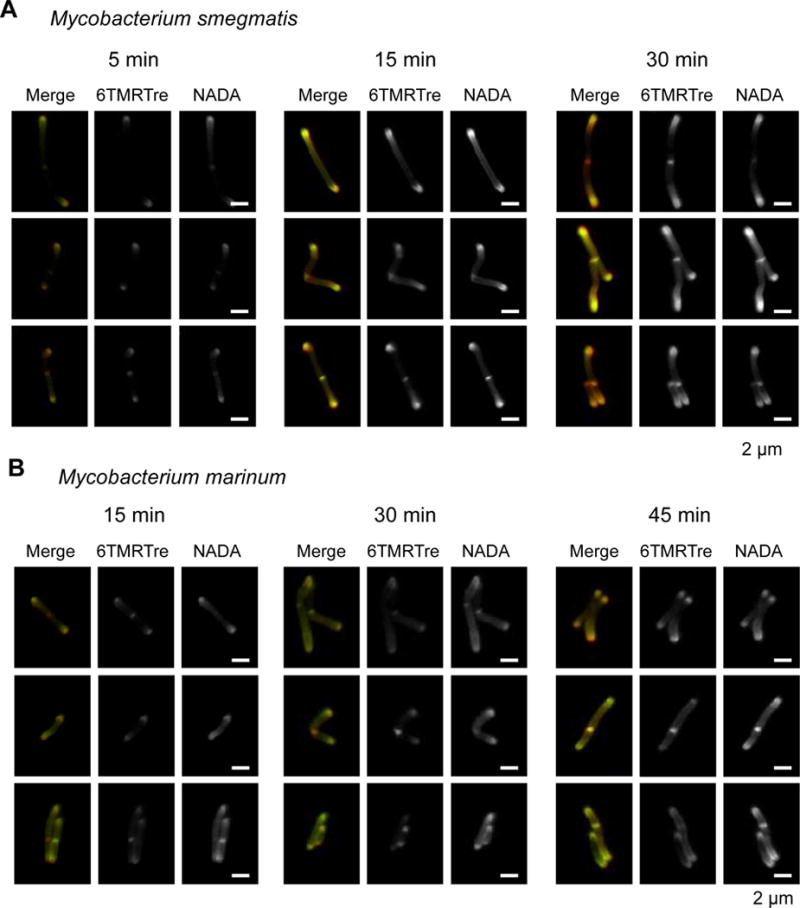
Short pulse dual cell envelope labeling in mycobacteria reveals subcellular distribution of PG and TMM biosynthesis in Ms (A) and Mm (B). Cells were incubated with 100 μM 6-TMRTre and 1 mM NADA for the indicated times. Representative images are shown for widefield fluorescence microscopy. Scale bar, 2 μm
The current understanding of stress responses upon exposure to cell envelope-targeting drugs is limited to genetic readouts[30–34] or endpoint electron microscopy,[35] which are not amenable to live cell visualization. In principle, metabolic labeling methods can report on changes in PG and MM dynamics upon front-line TB drug treatment in live mycobacteria. In particular, we sought to visualize the changes that cells incur when treated with MM-compromising agents such as ethambutol (EMB) and isoniazid (INH), inhibitors of arabinogalactan and mycolic acid biosynthesis, respectively.[2] We also included SQ109 to examine alterations produced by inhibition of MmpL3, a TMM-specific transporter.[35] As a negative control, we included rifampicin (RIF), which targets RNA polymerase to inhibit transcription.[2] Furthermore, fluorescent vancomycin conjugate (Vanco-Fl) was used to report on the MM’s integrity, which must penetrate this structure to bind PG.
We treated Mm with a range of concentrations (below and above MIC) of EMB, INH, SQ109, and RIF for 2 h, in the presence of NADA, 6-TMR-Tre, or Vanco-Fl reporters (Figure 5, Figure S5 for Ms). Overall, NADA and 6-TMR-Tre labeling decreased with increasing concentrations of drugs by flow cytometry, which suggests general cellular toxicity. Notably, EMB treatment produced a dose-dependent increase in 6-TMR-Tre labeling after 2 h, which is consistent with upregulated mycolic acid and trehalose mycolate biosynthesis upon EMB treatment.[36,37] On the other hand, SQ109 treatment resulted in unchanged 6-TMR-Tre staining while Vanco-Fl staining drastically increased, suggesting a compromised MM. As expected, RIF treatment produced only minor changes in NADA, 6-TMR-Tre and Vanco-Fl labeling. These results pointed at different global effects of TB drugs on cell envelope dynamics.
Figure 5.
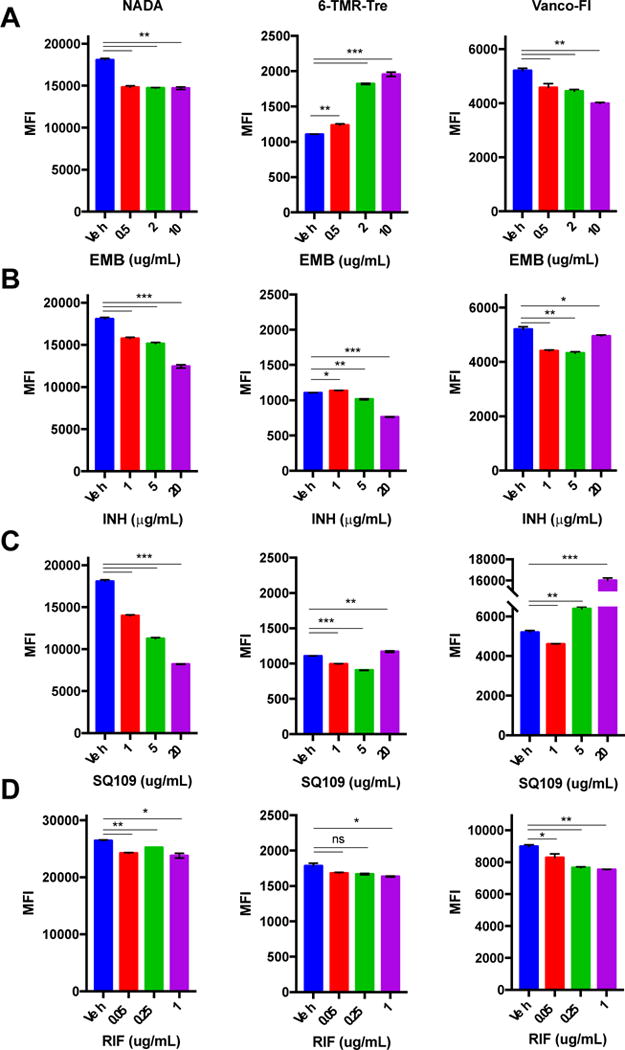
Effects of short (2 h) drug treatment at different concentrations in Mm. Bacteria were treated with EMB (A), INH (B), SQ109 (C), RIF (D) and labeled with NADA, 6-TMR-Tre or Vanco-Fl followed by flow cytometry analysis. Error bars depict standard deviation of three replicate experiments. Results are representative of at least two independent experiments. Statistical significance is given by *P < 0.05, **P < 0.01, ***P < 0.001. Mean fluorescence intensity (MFI)
Upon closer examination, fluorescence microscopy revealed drug-specific cell labeling patterns in live mycobacteria (Figure S6 and S7). For instance, EMB treatment induced more intense side-wall labeling at all concentrations tested. We proceeded to quantify this phenomenon at the individual cell level. Fluorescence intensities for NADA and 6-TMR-Tre reporters were plotted against the cell length to illustrate their spatial distributions (Figure S8). We also calculated the polarity index to account for cell envelope remodeling differences during treatment, defined as the intensity ratio of the dimmest region to the brightest pole. These measurements indicate that Mm differentially modulates cell envelope biogenesis under specific drug treatment conditions after only 2 h (Figure 6). Notably, we observed significant increase and decrease in labeling polarity for EMB and SQ109 treatment, respectively. In addition, treatment of Ms cells with the same drugs produced different polarity profiles, highlighting species-specific drug responses (Figure S9). Our results are consistent with the upregulation of cell envelope remodeling enzymes in response to drug treatment by gene expression profiling.[30,32,33] However, transcriptional responses are unable to report on immediate changes to cell envelope physiology.
Figure 6.
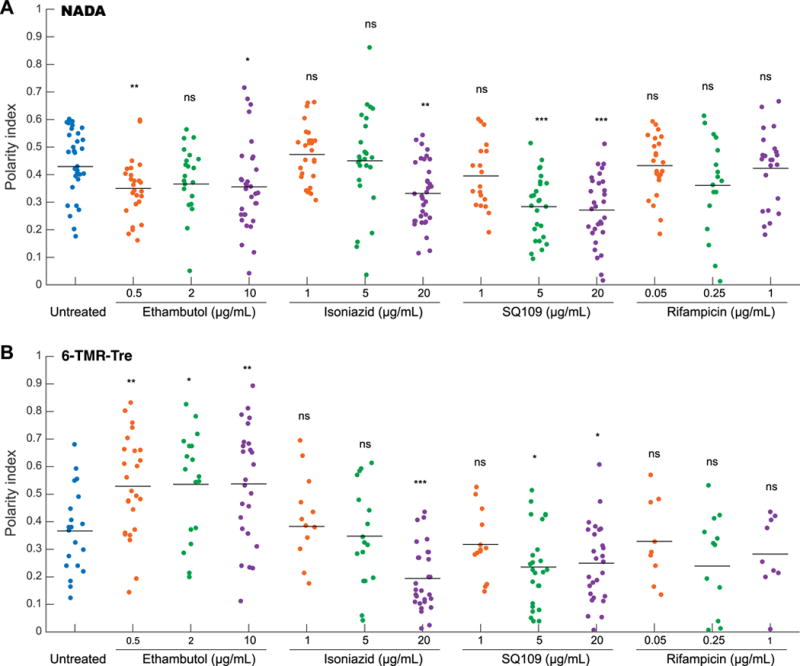
Front-line TB drugs alter cell envelope metabolic labeling profile in Mm. Cells were incubated with NADA and 6-TMR-Tre reporters during short 2 h drug treatment with EMB, INH, SQ109, and RIF. Traces of normalized fluorescence intensity profile along the cell axis were obtained to measure spatial distribution of labeling intensity. Polarity index was calculated as the ratio of the highest intensity at the pole to the lowest intensity along the cell body for NADA (A) and 6-TMR-Tre (B) channels. Statistical significance was calculated by a rank sum test and is given by *P < 0.05, **P < 0.01, ***P < 0.001.
Cell envelope targeting drugs have been reported to directly affect the iniBAC operon, which is involved in alleviating cell envelope stress.[31,34] However, using an iniBAC genetic reporter Mm strain we did not observe upregulation upon short drug treatment (Figure S10). Conversely, a robust response was observed after 24 h, which is consistent with previous findings[34] (Figure S10). Collectively, our results show that front-line TB drug pressures can alter cell envelope biogenesis before significant activation of the iniBAC operon, suggesting a faster biochemical response than genetic regulation of cell envelope stress.
A fundamental understanding of how effective TB drugs alter cell physiology can inform the development of new approaches. To date, drug effects on Mtb cell physiology have been studied primarily at the levels of transcription[30–34] and metabolism[38,39]. However, far less is known about the state of the cell envelope during drug treatment. Gross morphological changes have been observed by electron microscopy[35] and cell envelope signatures have been studied by vibrational imaging,[40] but these methods provide static views of cell envelope physiology.
In summary, we used metabolic reporters to study mycobacterial cell envelope architecture by super-resolution microscopy. We observed a spatially regulated cell envelope maturation process during growth in rich media. Simultaneous labeling with NADA and 6-TMR-Tre allowed real-time dual visualization of PG and TMM dynamics at the single-cell level. We probed the effects of front-line TB drug treatment on metabolic labeling and discovered drug-specific effects on the distribution of cell envelope components. Our observations suggest that cell envelope biogenesis can be localized to the side-wall during drug treatment. In addition, we were able to capture changes in cell envelope structure as early as 2 h after drug exposure, a time frame that is hard to interrogate using other methods. The metabolic labeling technique revealed responses to drug treatment that precede transcriptional adaptations. Thus, mycobacterial cell envelope labeling offers a new, operationally simple mode of probing drug effects in parallel with gene expression profiling. This method is also well suited to interrogate how the host environment affects cell envelope physiology in relevant in vivo models of TB pathogenesis.
Supplementary Material
Acknowledgments
We thank Douglas Fox for critical reading of the manuscript, and Maikel Boot and Prof. Wilbert Bitter for the generous gift of the Mm iniBAC reporter strain. F.P.R-R. was supported by a Ford Foundation Predoctoral Fellowship and University of California Chancellor’s Fellowship. X.Z. was supported by a Stanford University Interdisciplinary Graduate Fellowship. This work was supported by NIH grants GM058867 and AI051622 (to C.R.B.) and AI036929 (to J.A.T.), and the Stanford Center for Systems Biology grant P50-GM107615 (to J.A.T.). Structured illumination microscopy in this project was supported, in apart, by Award Number 1S10OD01227601 from the National Center for Research Resources (NCRR). Its contents are solely the responsibility of the authors and do not necessarily represent the official views of the NCRR or the NIH.
References
- 1.WHO | Global tuberculosis report 2017. http://www.who.int/tb/publications/global_report/en/
- 2.Zumla A, Nahid P, Cole ST. Nat Rev Drug Discov. 2013;12:388–404. doi: 10.1038/nrd4001. [DOI] [PubMed] [Google Scholar]
- 3.Cole ST. Phil Trans R Soc B. 2016;371:20150506. doi: 10.1098/rstb.2015.0506. [DOI] [PMC free article] [PubMed] [Google Scholar]
- 4.Russell DG. Nat Rev Mol Cell Biol. 2001;2:569–586. doi: 10.1038/35085034. [DOI] [PubMed] [Google Scholar]
- 5.Philips JA, Ernst JD. Annu Rev Pathol Mech Dis. 2012;7:353–384. doi: 10.1146/annurev-pathol-011811-132458. [DOI] [PubMed] [Google Scholar]
- 6.Jarlier V, Nikaido H. FEMS Microbiol Lett. 1994;123:11–18. doi: 10.1111/j.1574-6968.1994.tb07194.x. [DOI] [PubMed] [Google Scholar]
- 7.Zhang Y. Annu Rev Pharmacol Toxicol. 2005;45:529–564. doi: 10.1146/annurev.pharmtox.45.120403.100120. [DOI] [PubMed] [Google Scholar]
- 8.Jankute M, Cox JAG, Harrison J, Besra GS. Annu Rev Microbiol. 2015;69:405–423. doi: 10.1146/annurev-micro-091014-104121. [DOI] [PubMed] [Google Scholar]
- 9.Kolattukudy PE, Fernandes ND, Azad AK, Fitzmaurice AM, Sirakova TD. Mol Microbiol. 1997;24:263–270. doi: 10.1046/j.1365-2958.1997.3361705.x. [DOI] [PubMed] [Google Scholar]
- 10.Siegrist MS, Swarts BM, Fox DM, Lim SA, Bertozzi CR. FEMS Microbiol Rev. 2015;39:184–202. doi: 10.1093/femsre/fuu012. [DOI] [PMC free article] [PubMed] [Google Scholar]
- 11.Kuru E, Hughes HV, Brown PJ, Hall E, Tekkam S, Cava F, de Pedro MA, Brun YV, VanNieuwenhze MS. Angew Chem Int Ed. 2012;51:12519–12523. doi: 10.1002/anie.201206749. [DOI] [PMC free article] [PubMed] [Google Scholar]
- 12.Siegrist MS, Whiteside S, Jewett JC, Aditham A, Cava F, Bertozzi CR. ACS Chem Biol. 2013;8:500–505. doi: 10.1021/cb3004995. [DOI] [PMC free article] [PubMed] [Google Scholar]
- 13.Shieh P, Siegrist MS, Cullen AJ, Bertozzi CR. Proc Natl Acad Sci. 2014;111:5456–5461. doi: 10.1073/pnas.1322727111. [DOI] [PMC free article] [PubMed] [Google Scholar]
- 14.Kuru E, Tekkam S, Hall E, Brun YV, Van Nieuwenhze MS. Nat Protoc. 2015;10:33–52. doi: 10.1038/nprot.2014.197. [DOI] [PMC free article] [PubMed] [Google Scholar]
- 15.Backus KM, Boshoff HI, Barry CS, Boutureira O, Patel MK, D’Hooge F, Lee SS, Via LE, Tahlan K, Barry CE, 3rd, et al. Nat Chem Biol. 2011;7:228–235. doi: 10.1038/nchembio.539. [DOI] [PMC free article] [PubMed] [Google Scholar]
- 16.Swarts BM, Holsclaw CM, Jewett JC, Alber M, Fox DM, Siegrist MS, Leary JA, Kalscheuer R, Bertozzi CR. J Am Chem Soc. 2012;134:16123–16126. doi: 10.1021/ja3062419. [DOI] [PMC free article] [PubMed] [Google Scholar]
- 17.Urbanek BL, Wing DC, Haislop KS, Hamel CJ, Kalscheuer R, Woodruff PJ, Swarts BM. ChemBioChem. 2014;15:2066–2070. doi: 10.1002/cbic.201402288. [DOI] [PubMed] [Google Scholar]
- 18.Foley HN, Stewart JA, Kavunja HW, Rundell SR, Swarts BM. Angew Chem Int Ed. 2016;55:2053–2057. doi: 10.1002/anie.201509216. [DOI] [PubMed] [Google Scholar]
- 19.Rundell SR, Wagar ZL, Meints LM, Olson CD, O’Neill MK, Piligian BF, Poston AW, Hood RJ, Woodruff PJ, Swarts BM. Org Biomol Chem. 2016;14:8598–8609. doi: 10.1039/c6ob01734g. [DOI] [PMC free article] [PubMed] [Google Scholar]
- 20.Rodriguez-Rivera FP, Zhou X, Theriot JA, Bertozzi CR. J Am Chem Soc. 2017;139:3488–3495. doi: 10.1021/jacs.6b12541. [DOI] [PMC free article] [PubMed] [Google Scholar]
- 21.Kocaoglu O, Carlson EE. Nat Chem Biol. 2016;12:472–478. doi: 10.1038/nchembio.2109. [DOI] [PMC free article] [PubMed] [Google Scholar]
- 22.Stinear TP, Seemann T, Harrison PF, Jenkin GA, Davies JK, Johnson PDR, Abdellah Z, Arrowsmith C, Chillingworth T, Churcher C, et al. Genome Res. 2008;18:729–741. doi: 10.1101/gr.075069.107. [DOI] [PMC free article] [PubMed] [Google Scholar]
- 23.Backus KM, Dolan MA, Barry CS, Joe M, McPhie P, Boshoff HIM, Lowary TL, Davis BG, Barry CE., 3rd J Biol Chem. 2014;289:25041–25053. doi: 10.1074/jbc.M114.581579. [DOI] [PMC free article] [PubMed] [Google Scholar]
- 24.Dempsey GT, Vaughan JC, Chen KH, Bates M, Zhuang X. Nat Methods. 2011;8:1027–1036. doi: 10.1038/nmeth.1768. [DOI] [PMC free article] [PubMed] [Google Scholar]
- 25.Hanessian, S., Lavallee, P. J., 1972, 25, 683–684.
- 26.Carel C, Nukdee K, Cantaloube S, Bonne M, Diagne CT, Laval F, Daffé M, Zerbib D. PLOS ONE. 2014;9:e97148. doi: 10.1371/journal.pone.0097148. [DOI] [PMC free article] [PubMed] [Google Scholar]
- 27.Meniche X, Otten R, Siegrist MS, Baer CE, Murphy KC, Bertozzi CR, Sassetti CM. Proc Natl Acad Sci. 2014;111:E3243–E3251. doi: 10.1073/pnas.1402158111. [DOI] [PMC free article] [PubMed] [Google Scholar]
- 28.Neres J, Pojer F, Molteni E, Chiarelli LR, Dhar N, Boy-Röttger S, Buroni S, Fullam E, Degiacomi G, Lucarelli AP, et al. Sci Transl Med. 2012;4:150ra121–150ra121. doi: 10.1126/scitranslmed.3004395. [DOI] [PMC free article] [PubMed] [Google Scholar]
- 29.Favrot L, Grzegorzewicz AE, Lajiness DH, Marvin RK, Boucau J, Isailovic D, Jackson M, Ronning DR. Nat Commun. 2013;4:2748. doi: 10.1038/ncomms3748. [DOI] [PMC free article] [PubMed] [Google Scholar]
- 30.Wilson M, DeRisi J, Kristensen HH, Imboden P, Rane S, Brown PO, Schoolnik GK. Proc Natl Acad Sci. 1999;96:12833–12838. doi: 10.1073/pnas.96.22.12833. [DOI] [PMC free article] [PubMed] [Google Scholar]
- 31.Alland D, Steyn AJ, Weisbrod T, Aldrich K, Jacobs WR. J Bacteriol. 2000;182:1802–1811. doi: 10.1128/jb.182.7.1802-1811.2000. [DOI] [PMC free article] [PubMed] [Google Scholar]
- 32.Betts JC, McLaren A, Lennon MG, Kelly FM, Lukey PT, Blakemore SJ, Duncan K. Antimicrob Agents Chemother. 2003;47:2903–2913. doi: 10.1128/AAC.47.9.2903-2913.2003. [DOI] [PMC free article] [PubMed] [Google Scholar]
- 33.Boshoff HIM, Myers TG, Copp BR, McNeil MR, Wilson MA, Barry CE., 3rd J Biol Chem. 2004;279:40174–40184. doi: 10.1074/jbc.M406796200. [DOI] [PubMed] [Google Scholar]
- 34.Boot M, Sparrius M, Jim KK, Commandeur S, Speer A, van de Weerd R, Bitter W. J Biol Chem. 2016;291:19800–19812. doi: 10.1074/jbc.M116.724088. [DOI] [PMC free article] [PubMed] [Google Scholar]
- 35.Tahlan K, Wilson R, Kastrinsky DB, Arora K, Nair V, Fischer E, Barnes SW, Walker JR, Alland D, Barry CE, et al. Antimicrob Agents Chemother. 2012;56:1797–1809. doi: 10.1128/AAC.05708-11. [DOI] [PMC free article] [PubMed] [Google Scholar]
- 36.Telenti A, Philipp WJ, Sreevatsan S, Bernasconi C, Stockbauer KE, Wieles B, Musser JM, Jacobs WR. Nat Med. 1997;3:567–570. doi: 10.1038/nm0597-567. [DOI] [PubMed] [Google Scholar]
- 37.Kilburn JO, Takayama K. Antimicrob Agents Chemother. 1981;20:401–404. doi: 10.1128/aac.20.3.401. [DOI] [PMC free article] [PubMed] [Google Scholar]
- 38.Gomez JE, McKinney JD. Tuberculosis. 2004;84:29–44. doi: 10.1016/j.tube.2003.08.003. [DOI] [PubMed] [Google Scholar]
- 39.Baek SH, Li AH, Sassetti CM. PLOS Biol. 2011;9:e1001065. doi: 10.1371/journal.pbio.1001065. [DOI] [PMC free article] [PubMed] [Google Scholar]
- 40.Liu TT, Lin YH, Hung CS, Liu TJ, Chen Y, Huang YC, Tsai TH, Wang HH, Wang DW, Wang JK, et al. PLOS ONE. 2009;4:e5470. doi: 10.1371/journal.pone.0005470. [DOI] [PMC free article] [PubMed] [Google Scholar]
Associated Data
This section collects any data citations, data availability statements, or supplementary materials included in this article.


