Abstract
Isolating and characterizing mutants with altered senescence phenotypes is one of the ways to understand the molecular basis of leaf aging. Using ethyl methane sulfonate mutagenesis, a new rice (Oryza sativa) mutant, brown midrib leaf (bml), was isolated from the indica cultivar ‘Zhenong34’. The bml mutants had brown midribs in their leaves and initiated senescence prematurely, at the onset of heading. The mutants had abnormal cells with degraded chloroplasts and contained less chlorophyll compared to the wild type (WT). The bml mutant showed excessive accumulation of reactive oxygen species (ROS), increased activities of superoxide dismutase, catalase, and malondialdehyde, upregulation of senescence-induced STAY-GREEN genes and senescence-related transcription factors, and down regulation of photosynthesis-related genes. The levels of abscisic acid (ABA) and jasmonic acid (JA) were increased in bml with the upregulation of some ABA and JA biosynthetic genes. In pathogen response, bml demonstrated higher resistance against Xanthomonas oryzae pv. oryzae and upregulation of four pathogenesis-related genes compared to the WT. A genetic study confirmed that the bml trait was caused by a single recessive nuclear gene (BML). A map-based cloning using insertion/deletion markers confirmed that BML was located in the 57.32kb interval between the L5IS7 and L5IS11 markers on the short arm of chromosome 5. A sequence analysis of the candidate region identified a 1 bp substitution (G to A) in the 5′-UTR (+98) of bml. BML is a candidate gene associated with leaf senescence, ROS regulation, and disease response, also involved in hormone signaling in rice. Therefore, this gene might be useful in marker-assisted backcrossing/gene editing to improve rice cultivars.
Keywords: rice, Oryza sativa L., brown midrib leaf (bml), leaf senescence, chlorophyll biosynthesis, gene mapping, defense responses, hormone signaling
1. Introduction
Leaf senescence is governed by a finely tuned and multifaceted regulatory network [1]. It brings major changes in the cellular metabolism and gene expression patterns of leaves [2]. These changes allow the controlled breakdown of chlorophyll and the recycling of cellular components. The most striking aspect of such changes in the leaf is yellowing caused by the disintegration of chlorophyll by the action of chlorophyllase (CLH), which converts chlorophyll into chlorophyllide [3]. The visible yellowing reflects chloroplast degradation in mesophyll cells [1]. Later on, CLH takes part in the dissociation of macromolecules such as lipids and nucleic acids, which finally leads to cell death through degradation of mitochondria and nuclei [1]. Premature leaf aging can decrease crop yield [4], because senescent leaves with degraded chlorophyll cannot photosynthesize. Therefore, the maintenance of a proper timing of leaf senescence might enhance a plant's photosynthetic capability and increase crop yield [5]. It is possible for a plant to initiate leaf senescence depending on the environmental conditions, but the genetic mechanisms underlying this phenomenon remain poorly characterized. Notably, senescence-associated genes (SAGs) are upregulated in various plant species during senescence [6].
Abscisic acid (ABA), ethylene, jasmonic acid (JA), and salicylic acid (SA) signaling pathways can speed up senescence in older leaves [4,7,8]. ABA accelerates leaf aging by inducing the genes associated with chlorophyll breakdown and the genes linked to senescence [9,10]. JA and its derivatives are involved in leaf aging by inducing the expression of key chlorophyll degradation enzymes, like chlorophyllase [3,11]. JA also induces leaf senescence by upregulating JA biosynthesis genes [12]. The transcription factor WRKY53, associated with SA, stimulates the expression of ORESARA9 (ORE9), SENESCENCE-ASSOCIATED GENE12 (SAG12), and CATALASE1, 2, and 3 (CAT1, 2, and 3), which are involved in advancing leaf senescence [13].
Several biotic and abiotic factors, dark, disease, and water stress can induce leaf senescence. Various molecular systems are also involved; for example, transcription of WRKY transcription factor 22 (WRKY22) is stimulated during dark-induced senescence [14]. However, few mutants associated with leaf senescence and abiotic stresses have been identified. Studying such mutants could help to elucidate the leaf senescence mechanism [15,16]. Plant defenses against pathogens with a hypersensitive response are characterized by localized cell death at the infection site. Lesion mimic mutations, which cause cell death in the absence of pathogen, often show enhanced resistance against pathogen infection [17]. Studies of these mutants could increase our understanding of the relationship between leaf senescence and plant defenses.
Leaf color is an important morphological trait recognizable by eye that can act as a reliable marker for plant breeding. Combinations of phenotypes and genotypes need to be scrutinized to elucidate the genetics of leaf color traits and physically map leaf color genes. The aim of this work was to identify the novel lesion mimic mutant brown midrib leaf (bml) and understand its role in leaf aging and defense responses against bacterial pathogens in rice. BML encodes an APK1A protein kinase, a typical receptor-like cytoplasmic kinase (RLCK), encoded by LOC_Os05g02020 or OsRLCK176. The function of this gene was characterized on the basis of leaf color phenotypes in the segregating progeny of the cross between bml and wild-type (WT) parents. The mutation in LOC_Os05g02020 causing the bml phenotype was detected by map-based cloning. The current findings will help to elucidate the roles of this mutation in different hormone signaling pathways and defense responses.
2. Materials and Methods
2.1. Plant Materials andGrowth Conditions
The rice (Orzya sativa L.) mutant bml, generated from the ethylmethane sulfonate (EMS)-induced indica cultivar ‘Zhenong 34’, was isolated by visual observation of phenotypes with early leaf senescence in an M2 population. The F2 population used for the genetic analysis was generated by crossing bml with WT ‘Zhenong 34’ (10 crosses were done using 10 WT plants). For gene mapping, the F2 population was developed by crossing ‘Zhenong 34’ with a Oryza sativa japonica cultivar ‘Zhenogda104’. All plants were grown to maturity in the rice fields of Zhejiang University in Hangzhou, China (30°15′49″ N, 120°7′15″ E), during March–July 2016.
2.2. Gene Mapping
Gene mapping was carried out using the bulk segregant analysis (BSA) method to select linked markers and the candidate gene [18]. The NCBI database [19], Gramene [20], DNASTAR, and Primer 5 software were used to design new polymorphic primers (Table S1). The Database of the Rice Genome Annotation Project [21] was used to obtain the function of each candidate gene in the region. Sequencing was conducted using candidate genes for the mutant and WT, and the mutation site was confirmed using NCBI BLAST [22].
2.3. Phylogenic Analysis of BML
The predicted PKc-like super family domain (OsRLCK) protein sequences of rice were aligned against a wide range of monocot and dicot crop species using Clustal Omega [23]. A phylogenetic tree was constructed with the MEGA 6.06 software using the neighbor-joining (NJ) algorithm [24]. To consistently analyze tree topology, 1000 replications for bootstrap values were used with full removal mode.
2.4. Estimation of Chlorophyll Content and Photosynthetic and Chlorophyll Fluorescence Parameters
The flag leaves of bml and WT plants were used to measure chlorophyll a (Chl a), chlorophyll b (Chl b), and total chlorophyll contents [25]. Photosynthetic parameters (i.e., net photosynthetic rate (Pn); stomatal conductance (gs); transpiration rate (Tr); intracellular CO2 concentration (Ci)) were quantified using an LI-6400 transportable photosynthesis system (LI-COR, Lincoln, NE, USA). The measurements were taken between 9:00 and 11:30 a.m. on a single day at the reproductive stage of growth. Using an imaging pulse-amplitude-modulated fluorometer (IMAG-MAXI; Heinz Walz, Effeltrich, Germany), the chlorophyll fluorescence of flag leaves of both bml and WT was measured after 30 min of adjustment to dark, as reported previously [26]. The maximal quantum yield of photosystem II (PSII) (Fv/Fm) for bml and WT was then calculated.
2.5. Microscopic Structure Analysis and Histochemistry Assayss
Paraffin section analysis was conducted as previously reported by Alamin et al. [27]. Briefly, the leaves were soaked overnight in FAA (10% formaldehyde, 50% ethanol, and 5% glacial acetic acid) at 4 °C, thereafter dehydrated in a 50–100% ethanol series, and finally set in paraplast. Microtome sections (10 μm) were stained using safranin (Sangon Biotech, Shanghai, China) and fast green (Sangon Biotech) and examined under an Image Pro-Plus 6.0 light microscope (Sangon Biotech). For transmission electron microscopy (TEM), the middle part of the second leaf blade and midrib from bml and WT leaves were fixed in 2.5% glutaraldehyde, subsequently set in 1% osmium tetraoxide (Sangon Biotech), desiccated in a graded acetone progression, finally permeated in Epox 812, and fixed. After staining with methylene blue (Sangon Biotech), ultra-thin pieces were sliced and stained with uranyl acetate with lead citrate (Sangon Biotech). The sections were observed using a transmission electron microscope (HITACHI, H-600IV, Tokyo, Japan).
Histochemical cell death experiments and assays of reactive oxygen species (ROS) aggregation, were carried out as previously described by Zhou et al. [28]. The samples were flooded with a lactic acid–phenol–trypan blue (Sangon Biotech) solution (2.5 mg/mL trypan blue, 25% (w/v) lactic acid, 23% water-soaked phenol) at 70 °C, along with 25% glycerol, then permeated for 20 min, warmed in hot water for 2 min, chilled for 1.5 h to allow trypan blue staining, and destained using chloral hydrate (2.5 g/mL). To measure the levels of superoxide (O2−), the leaf samples were absorbed in 0.5 mg/mL nitro blue tetrazolium (NBT) (Sangon Biotech) in 10 mM potassium phosphate buffer (pH 7.8) in the dark for 16h. To measure hydrogen peroxide (H2O2), the leaf samples were steeped in 1mg/mL 3,3′-diaminobenzidine (DAB) (Sangon Biotech) and 10 mM 2-(N-morpholino) methanesulfonic acid (MES, pH 6.5) (Sangon Biotech) in the dark for 18 h. Leaf chlorophyll was removed by treating with 75% ethanol in hot water for 10 min, then placing in absolute ethanol.
2.6. Dark-Induced Treatment
Naturally grown, healthy (green and spotless) flag leaves were wrapped in aluminum foil to maintain the dark conditions in the rice field for 10 days during heading. Five flag leaves from the mutant and five from the WT were randomly chosen for the treatment, as described previously by Sun et al. [29].
2.7. Measurement of Antioxidant Enzyme Activity
To measure the activities of the antioxidant enzymes superoxide dismutase (SOD), catalase (CAT), and peroxidase (POD), and the malondialdehyde (MAD) content, 0.5 g samples of leaf were used for each treatment. The samples were homogenized in 8 mL of 50 mM potassium phosphate buffer (pH 7.8) by using a chilled mortar and pestle to maintain an ice-cold environment, as described by Ahmed et al. [30].
2.8. Hormone Measurement
Different phytohormones from the tips of the second leaves of bml and WT plants were extracted and measured 10 days after flowering [31]. The leaves were frozen and crushed in liquid nitrogen, and endogenous indole-3-acetic acid (IAA), ABA, JA, and SA were quantified using three replicated samples from independent plants with ABA, IAA, JA, and SA ELISA kits (MLBio ELISA Kit producers, Shanghai, China), according to the manufacturer’s instructions. A multilevel calibration graph was made with internal standards.
2.9. Inoculation with Bacterial Blight Pathogen
New, fully expanded leaves of six independent bml and WT plants at the tillering stage were inoculated with Guangzhou-C (Gz-C) suspensions of Xanthomonas oryzae pv. oryzae bacteria (absorbance at 600 nm was 0.5) using the clipped leaf technique. Disease progress, measured as damage lengths in the leaves, was scored 21 days after inoculation [32].
2.10. RNA Extraction and Quantitative Reverse Transcription Polymerase Chain ReactionAnalysis
Ex Taq II was used for reverse transcription polymerase chain reaction (qRT-PCR) as described in the Takara instruction leaflet (Takara, Tokyo, Japan). The primers for qRT-PCR are listed in Table S2. PCR was executed using the following profile: denaturation at 95 °C for 30 s, then 40 cycles of denaturation at 95 °C for 5 s, annealing at 55 °C for 20 s, extension at 72 °C for 10 s. Rice actin was used as a reference gene [33].
2.11. Statistical Analysis
All data are shown as means ± standard deviation (SD) of five replicates. The statistical software package SPSS (version 20) (IBM corporation, Armonk, North Castle, NY, USA) was used for data analysis. One-way analysis of variance and subsequently a Tukey’s test were performed for pair-wise statistical significance difference of means. The graphs were prepared using Origin Pro version 8.0 (Origin LabCorporation, Wellesley Hills, MA, USA). A Χ2-test was used to detect the separation ratio of the bml mutant in the segregating F2 population.
3. Results
3.1. Effect of the bml Mutation on Phenotype
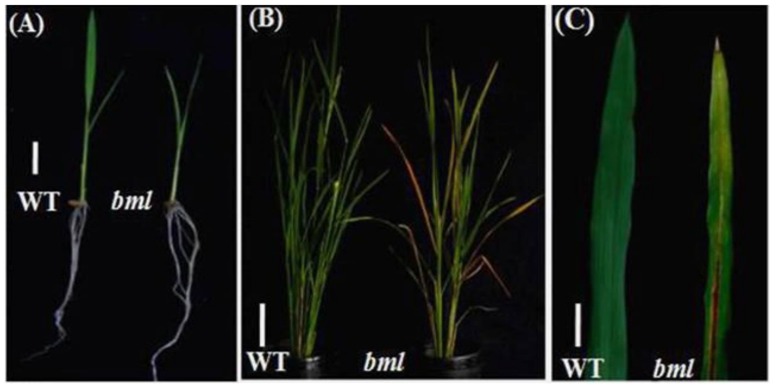
Plants with the bml mutation were identified from a screen of mutants in the M2 generation by the appearance of the early senescence phenotype compared with WT. The bml mutants did not display a browning phenotype at the seedling stage (Figure 1A). However, compared with WT, whose leaves stayed green, the lower leaves of bml began to turn yellow with progressive senescence at the heading stage under natural conditions (Figure 1B). The midrib of the bml leaves started to brown, and lesion-like spots appeared on the leaf blade, gradually covering the whole leaf, which became senescent (Figure 1C). In addition, the bml plants grew very slowly, resulting in small plants with a significantly reduced number of tillers per plant, panicle length, and seed-setting compared to WT (Figure S1). Reduced numbers of grains in the panicles, lower 1000-grain weight, and smaller seed size (grain length and width) were also recorded in the mutant (Figure S1).
Figure 1.
Phenotypic characterization of brown midrib leaf (bml) mutant and wild-type (WT) rice plants. (A) Morphologically similar phenotypes observed in bml and WT at the seedling stage. Bar = 2 cm. (B) Phenotypes of bml and WT at the heading stage. Bar = 10 cm. (C) Enlarged view of part of the second leaves from the top of the plant shown in (B). Bar = 5 cm.
A microscopic observation of cross sections of the leaves of bml and WT (Figure 1C) revealed that the leaves of bml plants were narrower than those of WT. Obvious variations between bml and WT were seen in terms of the number, size, and shape of bulliform cells (Figure S2A,B) that were small and shrunken in bml but fully expanded in WT (Figure S2C,D). The narrower bml leaves might be caused by the altered morphology of the bulliform cells [34]. In addition, a light-induced lesion mimic phenotype was observed in bml leaves grown in natural light conditions, whereas these lesions were absent in WT and in dark-induced leaves of bml or WT (Figure S3).
3.2. Genetic Analysis, Map-Based Cloning, and Expression Pattern Analysis of the BML Gene
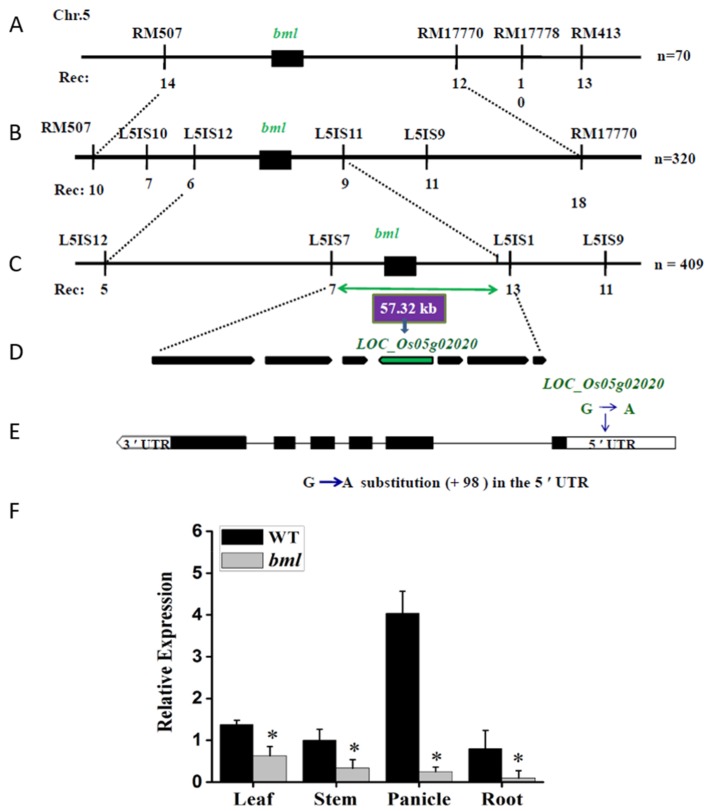
The F1 generation of a cross between bml and WT rice plants had a similar phenotype to that of the WT. In the F2 generation, 209 plants had the WT phenotype, and 63 plants had the mutant phenotype, fitting a segregation ratio of 3:1 (χ2= 0.490 < χ20.05 = 3.84) and confirming the presence of a single copy of a recessive bml allele. To identify the chromosomal location of BML, an F2 population was generated from a cross between bml and ‘Zhenongda 104’. Map-based cloning revealed the locus on the short arm of chromosome 5 between the simple-sequence repeat (SSR) markers RM507 and RM17770 (Figure 2A). Using the genome sequences of indica and japonica as references, 10 new InDel markers were designed to construct a high-resolution genetic and physical map. Using 320 individuals of the F2, the BML gene was mapped between the markers L5IS12 and L5IS11 (Figure 2B). BML was fine-mapped to a 57.32 kb region between InDel markers L5IS7 and L5IS11, using 409 individuals of the mutant from the F2 of bml/‘Zhenongda 104’ (Figure 2C). According to the Rice Genome Annotation Project [21] database, seven putative genes were expected in the 57.32 kb gap, encoding an NAD-dependent epimerase/dehydratase family protein (homolog LOC_Os05g01970), a DEAD-box ATP-dependent RNA helicase (LOC_Os05g01990), a rab5-interacting-like protein (LOC_Os05g01994), protein kinase APK1A, a chloroplast precursor (LOC_Os05g02020), an OB-fold nucleic acid-binding domain protein (LOC_Os05g02030), RPA1C, a single-stranded DNA binding complex subunit 1 (LOC_Os05g02040), and the mitochondrial import inner membrane translocase subunit Tim (LOC_Os05g02050) (Figure 2D). Genomic DNA was used to sequence the genes from bml and WT plants. In terms of the sequences of these genes, no differences were found between bml and WT, except for the sequence of LOC_Os05g02020. Therefore, LOC_Os05g02020 was chosen as the candidate gene for further detailed sequence analysis. Detailed DNA sequencing analysis of the candidate gene showed a 1bp substitution (G to A) in the 5′ untranslated region (UTR, +98) of bml (Figure 2D,E). RECEPTOR-LIKE CYTOPLASMIC KINASE 176 (OsRLCKl76) or Os05g0110900 (RAP-DB locus) was situated on the reverse DNA strand of chromosome 5 (Chromosome 5: 580,488–577,144) [20,21], which encodes an APK1A protein kinase. The genomic DNA and cDNA sequences of BML were 3345 bp and 1188 bp, respectively, and the 5′ and 3′ UTR were 643 bp and 355 bp, respectively. This gene comprised six exons and five introns with 395 amino acid residues. Therefore, LOC_Os05g02020 was determined to be the gene most likely to cause the bml mutation.
Figure 2.
Map-based cloning of the BML locus. (A) Primary mapping between two markers, RM507 and RM17770 (linked to BML), on the short arm of chromosome 5. Seventy F2 individuals of the mutant were used; the corresponding number of recombinants is listed (below the vertical lines). (B) Using 320 F2BML mutant individuals, BML was primarily mapped to a region between the markers L5IS12 and L5IS11. (C) Finally, using 409 F2 mutant individuals, BML was fine-mapped to a 57.32 kb interval region between the markers L5IS7 and L5IS11. (D) Seven genes were annotated in the 57.32 kb candidate region; LOC_Os05g02020 was presumed to be BML. (E) The structure of the BML gene and the locus of the mutation are marked. Black boxes indicate exons, and lines indicate introns. (F) Expression patterns of BML in rice leaf, stem, panicle, and root at the heading stage. The rice actin gene was used as a reference. All data are shown as means ± standard deviation (SD) of five replicates; * p < 0.05 by Tukey’s method.
Quantitative RT-PCR using complementary DNA (cDNA) from leaf, stem, panicle, and root tissues at the heading stage revealed the expression of BML to be ubiquitous in these organs (Figure 2F). However, the expression of this gene was lower in the leaf, stem, panicle, and root tissues of bml than in the corresponding elements of WT (the expression was decreased by 54%, 67%, 94%, and 88% in the leaf, stem, panicle, and root, respectively). This reduced expression might be caused by the substitution of G to A at the 5′ UTR, affecting the transcriptional level of bml and leading to a phenotypic change in the rice plant.
3.3. Phylogenetic Analysis and Domain Location
In plants, RLCKs belong to the receptor-like kinase (RLK) superfamily, have homology with RLKs in their kinase domain but lack the transmembrane domain. Fourteen major types of RLCK domain organizations have been reported to date [35], although this phylogenetic analysis was done to understand the relatedness and evolutionary relationships between plant species containing genes with PKc-like conserved domains. Using 43 full-length protein sequences of PKc-like domains, including five from the Oryza genus, one from Arabidopsis, and others from a variety of crop and fruit species, a phylogenetic tree was constructed to understand the evolutionary relationships between PKc-like family proteins in rice. The PKc-like family is divided into four well-conserved clades (I–IV) with significant bootstrap support (Figure S4). The phylogenetic and domain analysis revealed that the PKc-like domains of RLCKs are divergent in different plant species but conserved in cultivated rice. The selected gene locus LOC_Os05g02020 from Oryza sativa japonica, and the gene reported here, OsRLCK176, from Oryza sativa indica, fall in the same group, indicating their common ancestral origin.
3.4. Chlorophyll Content, Photosynthesis, and Chlorophyll Fluorescence in bml
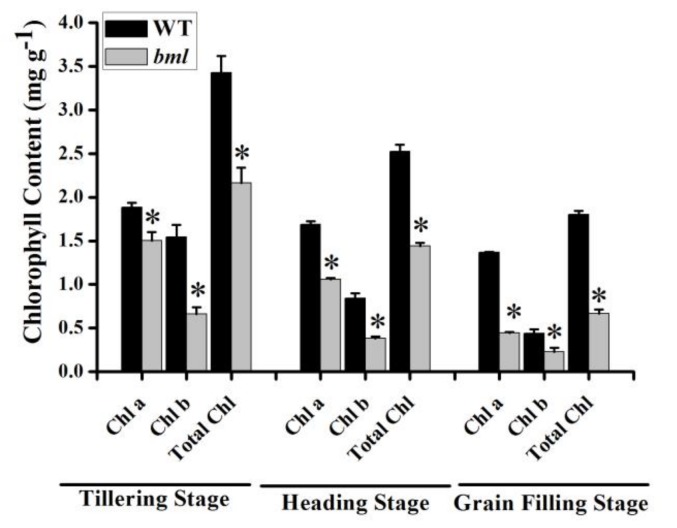
To determine any effects of the mutation of the BML locus on chlorophyll content and photosynthesis, the contents of the photosynthetic pigments in the flag leaves of bml and WT were investigated at different stages (Figure 3). In bml, photosynthetic Chl a, Chl b, and total chlorophyll contents were significantly decreased at the tillering, heading, and grain-filling stages compared to WT. However, the Chl a/Chl b ratio was significantly higher in bml than in WT at the tillering stage, suggesting smaller light-harvesting antennae. By contrast, the Chl a/Chl b ratio was 2.76 and 2.01 in bml and WT, respectively, at heading. However, in bml, the ratio dropped at the grain-filling stage. This suggests damage to the photosystems (Table S3).
Figure 3.
Photosynthetic pigment content analysis. Contents of the photosynthetic pigments in the leaves during the tillering, heading, and grain-filling stages in bml and WT. Chl: chlorophyll; Chl a: chlorophyll a; Chl b: chlorophyll b. All data are shown as means ± SD of five replicates; * p < 0.05 by Tukey’s method.
The photosynthetic characteristics of bml and WT plants were observed at the peak tillering and reproductive stages by measuring gas exchange in the flag leaves (Table S4). In bml, photosynthetic rate (Pn), stomatal conductance (Gs), intercellular CO2 concentration (Ci), and transpiration rate (Tr) were significantly lower than in WT. The photosynthetic parameters were also decreased in both bml and WT at the grain-filling and reproductive stages, with significant differences in Pn, Gs, Ci and Tr between bml and WT (Table S4).
To determine whether the photosynthetic apparatus was functional in bml plants, the maximal efficiency of PSII (Fv/Fm) was compared in bml and WT plants at the reproductive stage using a pulse-amplitude modulation (PAM) chlorophyll fluorometer. The Fv/Fm (maximal quantum yield of PSII) in bml was decreased by 17.2% compared to WT (Figure S5).
3.5. Ultrastructure Changes in Mesophyll Cells and Leaf Chloroplasts
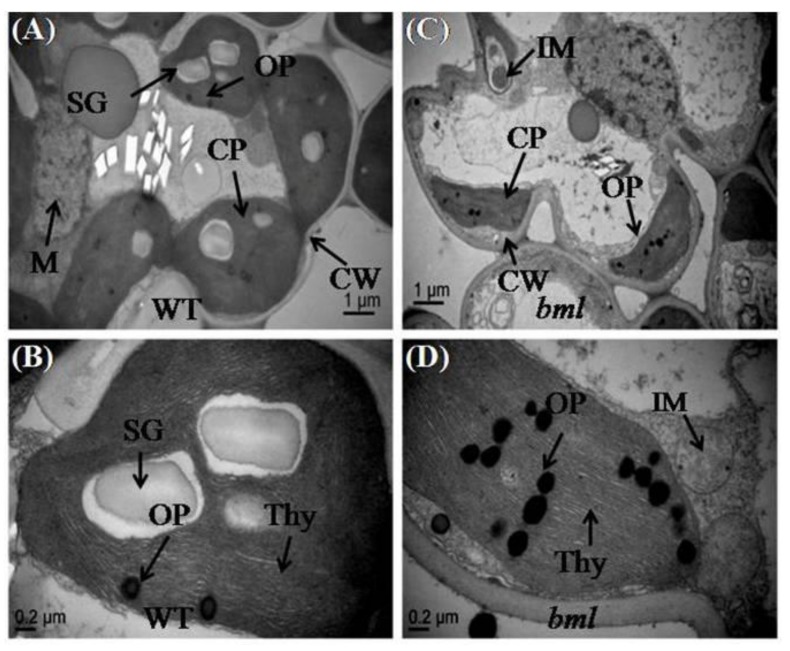
The observation of the ultrastructure of whole mesophyll cells and chloroplasts in the middle part of the second leaf from the top of both bml and WT plants at the heading stage, revealed various alterations in cell size and chloroplast structure (Figure 4A–D). In bml plants, mesophyll cells and chloroplasts had irregular shapes and sizes; there were no starch granule, immature mitochondria (M), obvious cell walls (CW), and larger vacuoles. Moreover, the chloroplast lamellae were collapsed and the number of disintegrated osmophilic plastoglobuli and shrunken chloroplasts with incomplete thylakoids was increased (Figure 4B,D). In WT plants, TEM of the middle part of the leaf blade revealed the presence of nearly equal-sized, regularly shaped, and properly arranged chloroplasts with larger starch granule, well developed mitochondria (M) and thylakoids (Thy), distinct cell walls, and fewer osmophilic plastoglobuli in leaf mesophyll cells (Figure 4A,C).
Figure 4.
Ultrastructure of chloroplasts in the middle part of the second leaf blade from the top of bml mutant rice plants. (A,C) Magnified view of chloroplasts in mesophyll cells of bml and WT plants at the heading stage. Bar = 1 μm. (B,D) Transmission electron microscope images (TEM) of chloroplasts and thylakoid membranes in the mesophyll cells of bml mutants and WT rice plants. Bar = 0.2 μm. CP: chloroplast; CW: cell wall; Thy: thylakoids; OP: osmophilic plastoglobuli; SG: Starch Granule; M: mitochondria; IM: immature mitochondria.
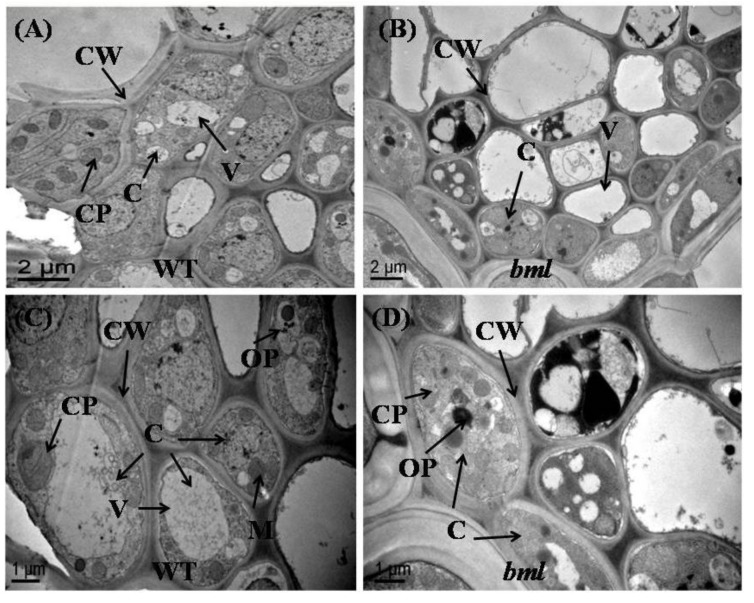
To ascertain whether the cell structure of the midrib of bml was altered, the ultrastructure of brown sections of the middle part of bml and WT plant’s midrib was observed under TEM. The cells of WT leaves contained mature, organized cell components with a well-organized cell wall (Figure 5A,C). In contrast, the bml cells had abnormal, immature, disorganized cell organelles, and an increased number of osmophilic plastoglobuli (Figure 5B,D).
Figure 5.
Ultrastructure of mesophyll cells in the middle part of the midrib of the second leaf from the top of bml mutant and WT rice plants at the heading stage. (A,B) TEM images of whole leaf mesophyll cells of bml and WT. Bar = 2 μm. (C,D) relatively low magnification view of mesophyll cells of bml and WT. Bar = 1 μm. C: cell; CW: cell wall; V: vacuole; CP: chloroplast; OP: osmophilic plastoglobuli; M: mitochondria.
3.6. Leaf Senescence-Associated Gene Expression in bml
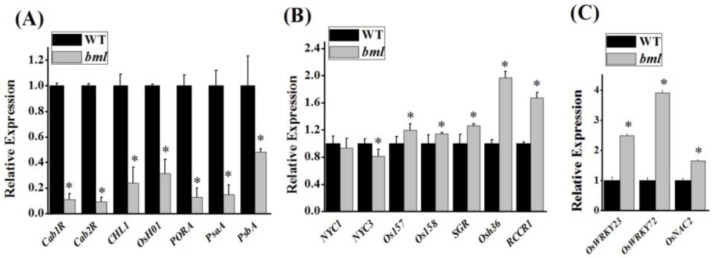
An expression profiling was conducted to understand the effects of the bml mutation on the expression of other leaf senescence-associated genes. The expression patterns of chlorophyll degradation and leaf senescence-related genes at the early heading stage revealed that the expression of the photosynthesis-related genes CAB1R, CAB2R, CHL1, OsH01, PORA, PSAA, and PSBA was significantly decreased in bml (Figure 6A) compared to WT. However, the expression of the senescence-associated genes Os157, Os158, SGR, Osh36, and RCCRI was significantly increased. NYC3 andNYC1 were downregulated in bml, but there was a non-significant difference in the transcript abundance of NYC1 between bml and WT (Figure 6B). The expression of the senescence-associated transcription factor genes OsWRKY23, OsWRKY72, and OsNAC2 was higher in bml at the early heading stage, corresponding to early leaf senescence (Figure 6C). These findings reveal the unusual decline of light-harvesting chlorophyll protein complexes within the thylakoid membranes due to untimely leaf senescence. In addition, some upregulated genes showed differential expression indicating that the bml mutation might not affect all of the upregulated genes in a similar manner.
Figure 6.
Expression of genes associated with leaf senescence in bml using quantitative reverse transcription polymerase chain reaction (qRT-PCR). Expression analysis of (A) photosynthesis-associated genes, (B) senescence-associated genes, and (C) senescence-associated transcription factors of bml mutants and WT rice plants at the heading stage. The expression levels are relative to rice Actin. All data are shown as means ± SD of five replicates; * p < 0.05 by Tukey’s method.
3.7. Activities of Antioxidant Enzymes and Reactive Oxygen Speciesin bml
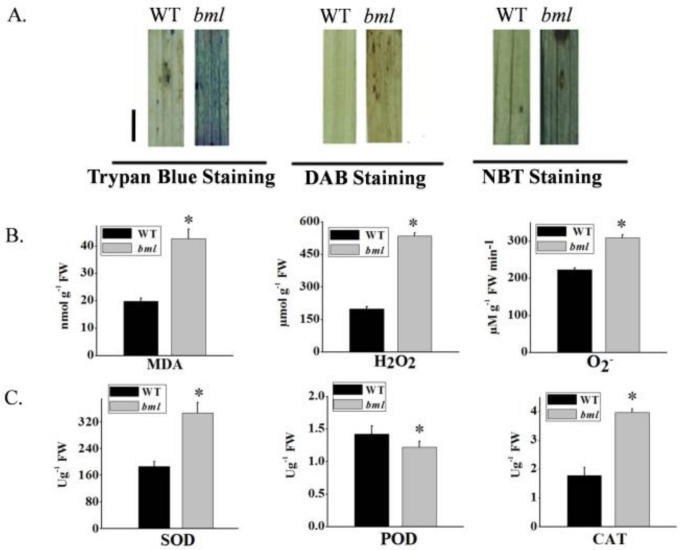
To measure the activities of antioxidant enzymes and ROS in bml, the leaves were stained with trypan blue dye. The leaves of bml showed blue-colored spots, whereas no staining was observed in WT leaves, indicating severe cell necrosis in bml (Figure 7A). When stained with diaminobenzidine (DAB), bml leaves presented brown-stained spots, whereas no staining was detected in WT leaves (Figure 7A). In bml leaves stained with nitro blue tetrazolium (NBT), blue deposits were observed, indicating superoxide (O2−) accumulation. The leaves of bml at the tillering stage also accumulated much more hydrogen peroxide and superoxide radicals than WT leaves (Figure 7B). Malondialdehyde (MDA) is produced as a result of membrane lipid peroxidation; its accumulation can reveal membrane injury, ultimately reflecting the level of cellular damage. Compared to WT, MDA levels were significantly increased in bml leaves at the same stages of growth (Figure 7B). The activities of the oxidative stress-related enzymes CAT and SOD were significantly higher in bml than in WT, and POD activity was significantly lower (Figure 7C).
Figure 7.
Histological staining and measurement of the activities of enzymes involved in scavenging and generating reactive oxygen species. (A) Analysis of histologically stained bml and WT rice leaves at the onset of heading, bar = 1 cm (B) Contents of malondialdehyde (MDA), hydrogen peroxide (H2O2), and superoxide anions (O2−). (C) Contents of the enzymes superoxide dismutase (SOD), ascorbate peroxidase (POD), and catalase (CAT) in bml and WT at the onset of heading. All data are shown asmeans ± SD of five replicates; * p < 0.05 by Tukey’s method. DAB: diaminobenzidine; NBT: nitro blue tetrazolium.
3.8. Disease Response and Upregulation of Pathogenesis-Related Marker Genes
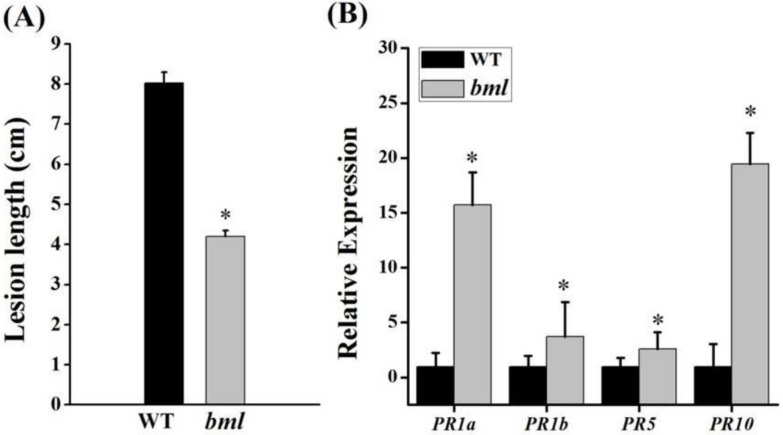
To assess the disease response and expression of four pathogenesis-related (PR) genes, bml and WT plants were inoculated with X. oryzae pv. oryzae (Xoo)bacteria and scored for disease after 21 days. The appearance of necrotic spots in bml suggested the activation of the hypersensitive response (HR), a resilience system in plants. In bml plants, the lesion length (~4 cm) was shorter than in WT (~8 cm), indicating enhanced Xoo resistance in the mutant (Figure 8A). The expression of four pathogenesis-related (PR) marker genes (PRIa, PRlb, PR5, and PR10) was significantly upregulated, and, among them, two of the defense genes (PRIa and PR10) were highly upregulated, i.e., over 10-fold, in bml compared with WT (Figure 8B), indicating an association between the bml mutant and positive defense responses in rice.
Figure 8.
Bacterial blight resistance and expression of resistance-related genes. (A) The lesion lengths were measured after inoculating bml and WT plant leaves with the bacterial blight pathogen Xanthomonas oryzae pv. oryzae strain Gz-C. The bars show means ± SD of 10 replicates. (B) Expression of pathogenesis-related (PR) marker genes at the tillering stage. All data are shown as means ± SD of five replicates; * p < 0.05 by Tukey’s method.
3.9. Measurements of Phytohormones and Signaling Pathway Gene Expression
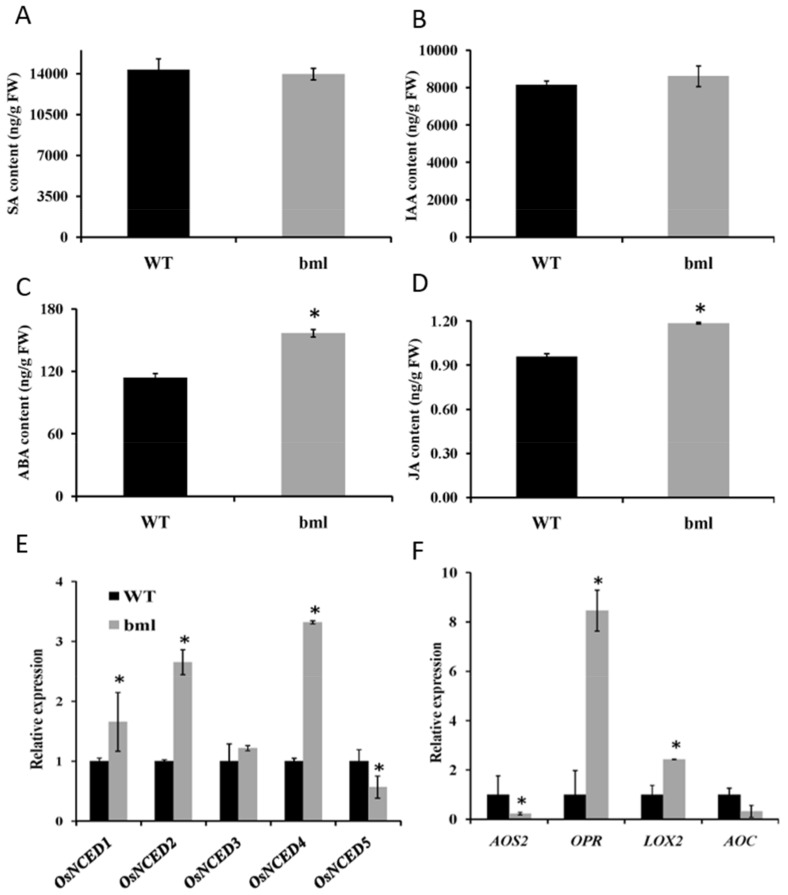
To determine whether the bml mutation affects hormone content and the expression of signaling pathway genes, phytohormones SA, IAA, ABA, and JA contents were measured in bml and WT leaves. No significant difference was found between bml and WT plants in SA or IAA contents (Figure 9A,B); however, JA and ABA levels were significantly higher in bml than in WT (Figure 9C,D), which might enhance senescence in bml. The expression of the ABA synthesis genes OsNCED1, OsNCED2, and OsNCED4 were significantly higher in bml than in WT, while OsNCED5 was significantly downregulated in bml (Figure 9E). In addition, the JA synthesis-related genes LOX2 and OPR7 were upregulated, but AOS2 was significantly downregulated in bml compared to WT (Figure 9F).
Figure 9.
Levels of different phytohormones associated with senescence in bml and wild-type (WT) plants. Contents of (A) salicylic acid (SA), (B) indole-3-acetic acid (IAA), (C) abscisic acid (ABA) and (D) jasmonic acid (JA), in the second leaves from the top of bml and WT plants at the heading stage. Expression analysis of (E)ABA biosynthetic genes and (F) JA biosynthetic genes using the second leaf from the top of bml and WT plants at the heading stage. All data are shown as means ± SD of five replicates; * p < 0.05 by Tukey’s method.
4. Discussion
Early leaf senescence adversely affects growth and rice yields because of its detrimental effects on photosynthesis. The role of early leaf senescence as an important defense response in rice and its molecular regulation remain poorly understood. We isolated and characterized a rice mutant, bml, which has an altered senescence phenotype, to understand the genetic importance of leaf senescence. Compared with WT, bml plants demonstrated early leaf senescence and had slower growth and lower yields. These traits might be attributed to detrimental effects on the efficiency of the photosynthetic system [31,36]. Leaf browning initiated at the midrib and spread across the whole leaf, which gradually became senescent. Anatomical (microscopic observation), physiological, and biochemical analysis confirmed that leaf senescence occurred because of reduced chlorophyll and photosynthetic parameters and chloroplast degradation, similar to observations reported in a previous study [1,3,31].
Environmental conditions might also induce the lesion mimic phenotype [37]. It is noteworthy that photorespiration is important in protecting photosynthetic organs from damage due to excessive absorption of light energy [38]. In bml, lesions were induced by light in leaves with reduced photosynthetic capability, indicating that light might trigger accelerated oxidative damage in bml leaves. Early leaf senescence occurred in bml, as confirmed by the observation of chloroplast degradation (Figure 4C), upregulation of aging-related transcription factors (OsWRKY2, OsWRKY72, and OsNAC2) and senescence-associated genes, and downregulation of photosynthesis-related genes (Figure 6A–C). Therefore, the tissues in bml seemed to be susceptible to oxidative damage and initiated senescence quicker than WT tissues.
Chloroplasts in the bml leaves contained unusual starch granules, indicating irregular starch metabolism and a reduced ability to deliver energy for development. Furthermore, bml chloroplasts had a greater number and larger size of osmophilic bodies without granule lamellae. These damaged, abnormal chloroplasts are likely to be responsible for premature leaf senescence [39].
BML was expressed in leaf, stem, root, and panicle tissues in both bml and WT plants [40]. A point mutation in the 5′UTRinduced alterations in the expression of BML in different tissues of rice [41]. In bml plants, a G to A substitution in the 5′UTR of BML might cause the significant reduction of transcript abundance compared to WT in the collected tissues. Previous studies analyzing different parts of OsRLCK176Ri transgenic rice plants found similar expression patterns of OsRLCK176 in different rice tissues and increased resistance to Xoo [40]. This point mutation affected the plastid, where JA biosynthesis is initiated. In the bml mutant, higher levels of JA werefound, which might be related to defense responses against bacteria and the detrimental effect on the development of different organs in rice. Exogenous methyl jasmonate (MeJA) applications on rice seedlings reduced the growth of roots shoots, panicle, spikelets etc.[42], and the overproduction of JA induced alesion-mimic phenotype on the leaves and causedtheir senescence [43]. Here, we also reported similar OsRLCK176 expression patterns and increased Xoo resistance in bml, as well as similar phenotypic changes to those reported by Ao et al. [44], in which three independent transgenic rice lines carrying an OsRLCK176 RNA interference (RNAi) mutation were evaluated.
In the present study, cloning the BML gene revealed that it encodes an APK1A protein kinase, a typical RLCK represented by LOC_Os05g02020 or OsRLCK176 (RAP-DB locus). As found in a previous study, phylogenetic and domain analyses revealed that the PKc-like domains of RLCK genes are divergent among different plant species but remain conserved in cultivated rice species [35]. A previous study noted that enzymes involved in antioxidant systems are expressed in lesion mimic mutants [45]. In bml, early leaf senescence correlated with the physiological indicators of decreased pigment content, increased MDA content, and increased SOD activity. MDA content was considerably higher, while chlorophyll content and photosynthetic rates were lower from the peak tillering to the grain-filling stage because of premature leaf aging. Here, large numbers of hydrogen peroxide and superoxide anions accumulated in bml, which thereafter induced CAT activity and greatly reduced POD activity. Thus, the accumulation of ROS in the mutant can most likely be attributed to an over production of hydrogen peroxide and a damaged radical scavenging pathway.
In Arabidopsis, overexpression of OsWRKY23 affected senescence and resistance, increasing the expression of PR genes and improving immunity against the bacterial pathogen Pseudomonas syringae [46]. The regulation of RLCK proteins can be involved in defense signaling. At the onset of the tillering stage, the bml mutant displayed disease-like lesions in the absence of pathogen attack. In turn, defense-response genes were activated, and bacterial disease resistance was enhanced, suggesting that OsRLCK176 positively regulates the defense response. This is consistent with published data showing that OsRLCLK176 is important in broad-spectrum bacterial blight resistance [40]. However, reduced OsRLCK176 expression results in a leaf senescence phenotype, possibly because defense and leaf senescence might be tightly coupled, and thus we found that four PR genes were upregulated in the bml mutant (Figure 8B). In the plant disease resistance system, there are two main signaling pathways, i.e., one involving JA, and one involving SA [47]. Since the expression of both PR1a and PR1b were increased in the mutant, bml might be involved in both JA and SA hormone signaling pathways. Moreover, CLH is responsible for chlorophyllide development upon the degradation of leaf cells and ultimately causes leaf senescence [3]. We suppose that chlorophyllide formation might form part of the defense response against pest or pathogen attack.
In our study, leaf senescence was primarily associated with increased levels of phytohormones such as ABA, JA, and SA, which are heavily involved in responses to different stresses [48,49]. ABA is a key plant hormone that mediates environmental stresses. Previous work demonstrated that ABA contents are higher in senescing leaves, and exogenous ABA induced the expression of several SAGs [29]. This was consistent with the leaf aging phenotype in bml. The expression levels of the genes encoding 9-cis-epoxycarotenoid dioxygenase (NCED), the key enzyme involved in ABA biosynthesis, were increased along with increased ABA in senescence leaves [48,50].
Four ABA biosynthesis-associated genes were significantly upregulated in bml. In addition, JA might be induced to produce chlorophyllase—the main enzyme of chlorophyll degradation [3,11]—promoting the loss of chlorophyll in the leaves. JA causes the expression of several senescence-associated genes to accelerate senescence [51,52]. Transcripts of genes encoding enzymes in the JA biosynthesis pathway increased sharply in bml, along with the expression levels of LOX2 and OPR7 (Figure 9F). An accelerated leaf senescence in bml plants might therefore have caused a subsequent increase in ABA and JA levels.
ROS are also important in early leaf senescence [53]. ABA and ROS signaling induce the expression of aging-coupled transcription factors [7,12,54]. Manipulation of BML might provide a new line of inquiry for genetic engineering to develop new resistant rice lines. Likewise, genetic evidence suggests that ROS do not activate senescence but act as a signal to stimulate the genes that regulate the events involved in cell death [55]. Mutation of BML accelerated leaf senescence associated with increased ROS and ABA signaling; however, the connection between JA, ABA, ROS, and leaf senescence remains to be established.
5. Conclusions
A rice mutant, bml, was characterized by its phenotype consisting of senescent leaves with a brown midrib at the onset of heading. The mutant had abnormal cells, degraded chloroplasts, and dramatically reduced chlorophyll contents. A genetic analysis confirmed that the bml trait is controlled by a single recessive nuclear gene, the result of a 1 bp substitution (G to A) in the 5′-UTR (+98) of BML. This gene was fine-mapped to a 57.32 kb interval between the L5IS7 and L5IS11 InDel markers located on the short arm of chromosome 5. ABA and JA contents were increased in bml, and some ABA and JA biosynthesis genes were upregulated. bml plants were more resistant to X. oryzae pv. oryzae than WT plants. In the bml mutant, higher level of JA and high upregulation of two defense genes (PRIa and PR10) seem to confer resistance against bacterial pathogens. These findings deepen our understanding of the mechanisms of leaf senescence associated with ROS and hormone signaling pathways in rice.
Acknowledgments
Xoo strain Gz-C was provided by the State Key Laboratory of Rice Biology, Zhejiang University, Hangzhou, China. We thank Jocelyn M. Losh, College of Life Science, Zhejiang University, China, for her critical review and edit of the manuscript. Thanks to Li Junying, Analysis Centre of Agribiologic and Environmental Science, Lab of Electron Microscope, Zhejiang University, China for helping in Transmission electron microscopy (TEM).
Supplementary Materials
The following are available online at http://www.mdpi.com/2073-4425/9/4/203/s1, Figure S1: Comparison of the agronomic traits between bml and WT. The bars symbolized standard deviations of three independent measurements. The asterisks imply a significant difference at p < 0.05 using Tukey’s method. Figure S2: Histo-cytological micro-structure of the flag leaf and main vein. (A,B) Cross sections of the flag leaf blades in bml and WT at the heading stage, respectively. Bar = 100 μm. (C,D) The amplification of the main vein in bml and WT, respectively. Bar = 200 μm. BC—bulliform cells, LV—large vascular bundle, SV—small vascular bundle. Figure S3: Leaves of bml and WT at the tillering stage on the right panel were covered with aluminum foil for 10 days to see the effect of dark and sunlight on the appearance of brown leaf spots. Figure S4: Phylogenetic relationship using 43 full-length protein sequences of PKc-like domains of RLCK genes, which included four genes from Oryza sativa, one from Arabidopsis, and the rest from a wide range of different crop and fruit species, to get insights into the evolutionary relationships among rice PKc-like domains by the neighbor-joining (NJ) method with MEGA 6.0. The numbers on the branches indicate bootstrap support values from 1000 replications. The tree was divided into four clades according to the bootstrap support values and evolutionary distances. The accession numbers of different sequences with their species name are presented in abbreviated form at the end of each accession. Figure S5: (A) Comparison of flag leaf phenotype and the maximum efficiency of photosystem II photochemistry (Fv/Fm) image. (B) The Fv/Fm value of bml compared with that of WT. The asterisks indicate statistically significant differences at p < 0.05 using Tukey’s method.
Author Contributions
D.A. and C.S. developed and designed the experiments. D.A. conducted the main experiments and wrote the manuscript. C.S. identified and provided the populations of the bml mutant for the genetic study and carried out the gene mapping. R.Q., M.A., and X.J. helped to carry out the experiments. U.K.N. analyzed some of the data and edited the manuscript. All authors have read and approved the final manuscript.
Funding
This study was supported by grants from the Science and Technology Office of Zhejiang Province (2012C12901-2,2016C32G2010016 and 2016C02050-6) and a grant from National Key Research and Development of China (2017YFD0100300-5).
Conflicts of Interest
The authors have no conflicts of interest to declare.
References
- 1.Lim P.O., Kim H.J., Gil Nam H. Leaf senescence. Annu. Rev. Plant Biol. 2007;58:115–136. doi: 10.1146/annurev.arplant.57.032905.105316. [DOI] [PubMed] [Google Scholar]
- 2.Quirino B.F., Noh Y.-S., Himelblau E., Amasino R.M. Molecular aspects of leaf senescence. Trends Plant Sci. 2000;5:278–282. doi: 10.1016/S1360-1385(00)01655-1. [DOI] [PubMed] [Google Scholar]
- 3.Hu X., Makita S., Schelbert S., Sano S., Ochiai M., Tsuchiya T., Hasegawa S.F., Hörtensteiner S., Tanaka A., Tanaka R. Reexamination of chlorophyllase function implies its involvement in defense against chewing herbivores. Plant Physiol. 2015;167:660–670. doi: 10.1104/pp.114.252023. [DOI] [PMC free article] [PubMed] [Google Scholar]
- 4.Schippers J.H. Transcriptional networks in leaf senescence. Curr. Opin. Plant Biol. 2015;27:77–83. doi: 10.1016/j.pbi.2015.06.018. [DOI] [PubMed] [Google Scholar]
- 5.Thomas H., Howarth C.J. Five ways to stay green. J. Exp. Bot. 2000;51:329–337. doi: 10.1093/jexbot/51.suppl_1.329. [DOI] [PubMed] [Google Scholar]
- 6.Yoshida S. Molecular regulation of leaf senescence. Curr. Opin. Plant Biol. 2003;6:79–84. doi: 10.1016/S1369526602000092. [DOI] [PubMed] [Google Scholar]
- 7.Zhang H., Zhou C. Signal transduction in leaf senescence. Plant Mol. Biol. 2013;82:539–545. doi: 10.1007/s11103-012-9980-4. [DOI] [PubMed] [Google Scholar]
- 8.Khan M., Rozhon W., Poppenberger B. The role of hormones in the aging of plants—A mini-review. Gerontology. 2014;60:49–55. doi: 10.1159/000354334. [DOI] [PubMed] [Google Scholar]
- 9.Liang C., Wang Y., Zhu Y., Tang J., Hu B., Liu L., Ou S., Wu H., Sun X., Chu J. OsNAP connects abscisic acid and leaf senescence by fine-tuning abscisic acid biosynthesis and directly targeting senescence-associated genes in rice. Proc. Natl. Acad. Sci. USA. 2014;111:10013–10018. doi: 10.1073/pnas.1321568111. [DOI] [PMC free article] [PubMed] [Google Scholar]
- 10.Chen X., Wang Y., Lv B., Li J., Luo L., Lu S., Zhang X., Ma H., Ming F. The NAC family transcription factor OsNAP confers abiotic stress response through the ABA pathway. Plant Cell Physiol. 2014;55:604–619. doi: 10.1093/pcp/pct204. [DOI] [PubMed] [Google Scholar]
- 11.Tsuchiya T., Ohta H., Okawa K., Iwamatsu A., Shimada H., Masuda T., Takamiya K.-I. Cloning of chlorophyllase, the key enzyme in chlorophyll degradation: Finding of a lipase motif and the induction by methyl jasmonate. Proc. Natl. Acad. Sci. USA. 1999;96:15362–15367. doi: 10.1073/pnas.96.26.15362. [DOI] [PMC free article] [PubMed] [Google Scholar]
- 12.Zhou Q., Yu Q., Wang Z., Pan Y., Lv W., Zhu L., Chen R., He G. Knockdown of GDCH gene reveals reactive oxygen species-induced leaf senescence in rice. Plant Cell Environ. 2013;36:1476–1489. doi: 10.1111/pce.12078. [DOI] [PubMed] [Google Scholar]
- 13.Miao Y., Laun T., Zimmermann P., Zentgraf U. Targets of the WRKY53 transcription factor and its role during leaf senescence in Arabidopsis. Plant Mol. Biol. 2004;55:853–867. doi: 10.1007/s11103-005-2142-1. [DOI] [PubMed] [Google Scholar]
- 14.Zhou X., Jiang Y., Yu D. WRKY22 transcription factor mediates dark-induced leaf senescence in Arabidopsis. Mol. Cells. 2011;31:303–313. doi: 10.1007/s10059-011-0047-1. [DOI] [PMC free article] [PubMed] [Google Scholar]
- 15.Yin Z., Chen J., Zeng L., Goh M., Leung H., Khush G.S., Wang G.-L. Characterizing rice lesion mimic mutants and identifying a mutant with broad-spectrum resistance to rice blast and bacterial blight. Mol. Plant-Microbe Interact. 2000;13:869–876. doi: 10.1094/MPMI.2000.13.8.869. [DOI] [PubMed] [Google Scholar]
- 16.Sheng P., Tan J., Jin M., Wu F., Zhou K., Ma W., Heng Y., Wang J., Guo X., Zhang X. Albino midrib 1, encoding a putative potassium efflux antiporter, affects chloroplast development and drought tolerance in rice. Plant Cell Rep. 2014;33:1581–1594. doi: 10.1007/s00299-014-1639-y. [DOI] [PubMed] [Google Scholar]
- 17.Wu C., Bordeos A., Madamba M.R.S., Baraoidan M., Ramos M., Wang G.-L., Leach J.E., Leung H. Rice lesion mimic mutants with enhanced resistance to diseases. Mol. Genet. Genom. 2008;279:605–619. doi: 10.1007/s00438-008-0337-2. [DOI] [PubMed] [Google Scholar]
- 18.Michelmore R.W., Paran I., Kesseli R. Identification of markers linked to disease-resistance genes by bulked segregant analysis: A rapid method to detect markers in specific genomic regions by using segregating populations. Proc. Natl. Acad. Sci. USA. 1991;88:9828–9832. doi: 10.1073/pnas.88.21.9828. [DOI] [PMC free article] [PubMed] [Google Scholar]
- 19.NCBI Primer Blast. [(accessed on 18 January 2017)]; Available online: https://www.ncbi.nlm.nih.gov/tools/primer-blast/
- 20.Gramene Home Page. [(accessed on 25 April 2017)]; Available online: http://www.Gramene.org/
- 21.Rice Genome Browser. [(accessed on 19 January 2017)]; Available online: http://rice.plantbiology.msu.edu/cgi-bin/gbrowse/rice/
- 22.NCBI Basic Local Alignment Search Tool. [(accessed on 25 January 2017)]; Available online: https://blast.ncbi.nlm.nih.gov/Blast.cgi.
- 23.EBI Clustal Omega. [(accessed on 11 April 2017)]; Available online: https://www.ebi.ac.uk/Tools/msa/clustalo/
- 24.Tamura K., Dudley J., Nei M., Kumar S. Mega4: Molecular evolutionary genetics analysis (MEGA) software version 4.0. Mol. Biol. Evol. 2007;24:1596–1599. doi: 10.1093/molbev/msm092. [DOI] [PubMed] [Google Scholar]
- 25.Arnon D.I. Copper enzymes in isolated chloroplasts. Polyphenoloxidase in Beta vulgaris. Plant Physiol. 1949;24:1. doi: 10.1104/pp.24.1.1. [DOI] [PMC free article] [PubMed] [Google Scholar]
- 26.Ahmed I.M., Cao F., Zhang M., Chen X., Zhang G., Wu F. Difference in yield and physiological features in response to drought and salinity combined stress during anthesis in Tibetan wild and cultivated barleys. PLoS ONE. 2013;8:e77869. doi: 10.1371/journal.pone.0077869. [DOI] [PMC free article] [PubMed] [Google Scholar]
- 27.Alamin M., Zeng D.-D., Qin R., Sultana M.H., Jin X.-L., Shi C.-H. Characterization and fine mapping of SFL1, a gene controlling screw flag leaf in rice. Plant Mol. Biol. Rep. 2017;35:491–503. doi: 10.1007/s11105-017-1039-x. [DOI] [Google Scholar]
- 28.Zhou Y., Huang W., Liu L., Chen T., Zhou F., Lin Y. Identification and functional characterization of a rice NAC gene involved in the regulation of leaf senescence. BMC Plant Biol. 2013;13:132. doi: 10.1186/1471-2229-13-132. [DOI] [PMC free article] [PubMed] [Google Scholar]
- 29.Sun L., Wang Y., Liu L.-L., Wang C., Gan T., Zhang Z., Wang Y., Wang D., Niu M., Long W. Isolation and characterization of a spotted leaf 32 mutant with early leaf senescence and enhanced defense response in rice. Sci. Rep. 2017;7:41846. doi: 10.1038/srep41846. [DOI] [PMC free article] [PubMed] [Google Scholar]
- 30.Ahmed I.M., Dai H., Zheng W., Cao F., Zhang G., Sun D., Wu F. Genotypic differences in physiological characteristics in the tolerance to drought and salinity combined stress between Tibetan wild and cultivated barley. Plant Physiol. Biochem. 2013;63:49–60. doi: 10.1016/j.plaphy.2012.11.004. [DOI] [PubMed] [Google Scholar]
- 31.Su Y., Hu S., Zhang B., Ye W., Niu Y., Guo L., Qian Q. Characterization and fine mapping of a new early leaf senescence mutant es3(t) in rice. Plant Growth Regul. 2017;81:419–431. doi: 10.1007/s10725-016-0219-2. [DOI] [Google Scholar]
- 32.Manosalva P.M., Bruce M., Leach J.E. Rice 14-3-3 protein (GF14e) negatively affects cell death and disease resistance. Plant J. 2011;68:777–787. doi: 10.1111/j.1365-313X.2011.04728.x. [DOI] [PubMed] [Google Scholar]
- 33.Zeng D.-D., Qin R., Li M., Alamin M., Jin X.-L., Liu Y., Shi C.-H. The ferredoxin-dependent glutamate synthase (OsFD-GOGAT) participates in leaf senescence and the nitrogen remobilization in rice. Mol. Genet. Genom. 2017;292:385–395. doi: 10.1007/s00438-016-1275-z. [DOI] [PubMed] [Google Scholar]
- 34.Fujino K., Matsuda Y., Ozawa K., Nishimura T., Koshiba T., Fraaije M.W., Sekiguchi H. Narrow leaf 7 controls leaf shape mediated by auxin in rice. Mol. Genet. Genom. 2008;279:499–507. doi: 10.1007/s00438-008-0328-3. [DOI] [PubMed] [Google Scholar]
- 35.Vij S., Giri J., Dansana P.K., Kapoor S., Tyagi A.K. The receptor-like cytoplasmic kinase (OsRLCK) gene family in rice: Organization, phylogenetic relationship, and expression during development and stress. Mol. Plant. 2008;1:732–750. doi: 10.1093/mp/ssn047. [DOI] [PubMed] [Google Scholar]
- 36.Zhu L.-F., Yu S.-M., Jin Q.-Y. Effects of aerated irrigation on leaf senescence at late growth stage and grain yield of rice. Rice Sci. 2012;19:44–48. doi: 10.1016/S1672-6308(12)60019-5. [DOI] [Google Scholar]
- 37.Huang Q.N., Shi Y.F., Yang Y., Feng B.H., Wei Y.L., Chen J., Baraoidan M., Leung H., Wu J.L. Characterization and genetic analysis of a light- and temperature-sensitive spotted-leaf mutant in rice. J. Integr. Plant Biol. 2011;53:671–681. doi: 10.1111/j.1744-7909.2011.01056.x. [DOI] [PubMed] [Google Scholar]
- 38.Streb P., Shang W., Feierabend J., Bligny R. Divergent strategies of photoprotection in high-mountain plants. Planta. 1998;207:313–324. doi: 10.1007/s004250050488. [DOI] [Google Scholar]
- 39.Deng L., Qin P., Liu Z., Wang G., Chen W., Tong J., Xiao L., Tu B., Sun Y., Yan W. Characterization and fine-mapping of a novel premature leaf senescence mutant yellow leaf and dwarf 1 in rice. Plant Physiol. Biochem. 2017;111:50–58. doi: 10.1016/j.plaphy.2016.11.012. [DOI] [PubMed] [Google Scholar]
- 40.Zhou X., Wang J., Peng C., Zhu X., Yin J., Li W., He M., Wang J., Chern M., Yuan C. Four receptor-like cytoplasmic kinases regulate development and immunity in rice. Plant Cell Environ. 2016;39:1381–1392. doi: 10.1111/pce.12696. [DOI] [PubMed] [Google Scholar]
- 41.Tong J., Han Z., Han A., Liu X., Zhang S., Fu B., Hu J., Su J., Li S., Wang S. Sdt97: A point mutation in the 5′ untranslated region confers semidwarfism in rice. G3 Genes Genomes Genet. 2016;6:1491–1502. doi: 10.1534/g3.116.028720. [DOI] [PMC free article] [PubMed] [Google Scholar]
- 42.Liu Z., Zhang S., Sun N., Liu H., Zhao Y., Liang Y., Zhang L., Han Y. Functional diversity of jasmonates in rice. Rice. 2015;8:5. doi: 10.1186/s12284-015-0042-9. [DOI] [PMC free article] [PubMed] [Google Scholar]
- 43.Liu X., Li F., Tang J., Wang W., Zhang F., Wang G., Chu J., Yan C., Wang T., Chu C. Activation of the jasmonic acid pathway by depletion of the hydroperoxide lyase OsHPL3 reveals crosstalk between the HPL and AOS branches of the oxylipin pathway in rice. PLoS ONE. 2012;7:e50089. doi: 10.1371/journal.pone.0050089. [DOI] [PMC free article] [PubMed] [Google Scholar]
- 44.Ao Y., Li Z., Feng D., Xiong F., Liu J., Li J.F., Wang M., Wang J., Liu B., Wang H.B. OsCERK1 and OsRLCK176 play important roles in peptidoglycan and chitin signaling in rice innate immunity. Plant J. 2014;80:1072–1084. doi: 10.1111/tpj.12710. [DOI] [PubMed] [Google Scholar]
- 45.Kliebenstein D.J., Dietrich R.A., Martin A.C., Last R.L., Dangl J.L. LSD1 regulates salicylic acid induction of copper zinc superoxide dismutase in Arabidopsis thaliana. Mol. Plant-Microbe Interact. 1999;12:1022–1026. doi: 10.1094/MPMI.1999.12.11.1022. [DOI] [PubMed] [Google Scholar]
- 46.Jing S., Zhou X., Song Y., Yu D. Heterologous expression of OsWRKY23 gene enhances pathogen defense and dark-induced leaf senescence in Arabidopsis. Plant Growth Regul. 2009;58:181–190. doi: 10.1007/s10725-009-9366-z. [DOI] [Google Scholar]
- 47.Xie X.-Z., Xue Y.-J., Zhou J.-J., Zhang B., Chang H., Takano M. Phytochromes regulate SA and JA signaling pathways in rice and are required for developmentally controlled resistance to Magnaporthe grisea. Mol. Plant. 2011;4:688–696. doi: 10.1093/mp/ssr005. [DOI] [PubMed] [Google Scholar]
- 48.Van der Graaff E., Schwacke R., Schneider A., Desimone M., Flügge U.-I., Kunze R. Transcription analysis of Arabidopsis membrane transporters and hormone pathways during developmental and induced leaf senescence. Plant Physiol. 2006;141:776–792. doi: 10.1104/pp.106.079293. [DOI] [PMC free article] [PubMed] [Google Scholar]
- 49.Yang X., Gong P., Li K., Huang F., Cheng F., Pan G. A single cytosine deletion in the OsPLS1 gene encoding vacuolar-type H+-ATPase subunit A1 leads to premature leaf senescence and seed dormancy in rice. J. Exp. Bot. 2016;67:2761–2776. doi: 10.1093/jxb/erw109. [DOI] [PMC free article] [PubMed] [Google Scholar]
- 50.Buchanan-Wollaston V., Page T., Harrison E., Breeze E., Lim P.O., Nam H.G., Lin J.F., Wu S.H., Swidzinski J., Ishizaki K., et al. Comparative transcriptome analysis reveals significant differences in gene expression and signalling pathways between developmental and dark/starvation-induced senescence in Arabidopsis. Plant J. 2005;42:567–585. doi: 10.1111/j.1365-313X.2005.02399.x. [DOI] [PubMed] [Google Scholar]
- 51.He Y., Tang W., Swain J.D., Green A.L., Jack T.P., Gan S. Networking senescence-regulating pathways by using Arabidopsis enhancer trap lines. Plant Physiol. 2001;126:707–716. doi: 10.1104/pp.126.2.707. [DOI] [PMC free article] [PubMed] [Google Scholar]
- 52.He Y., Fukushige H., Hildebrand D.F., Gan S. Evidence supporting a role of jasmonic acid in Arabidopsis leaf senescence. Plant Physiol. 2002;128:876–884. doi: 10.1104/pp.010843. [DOI] [PMC free article] [PubMed] [Google Scholar]
- 53.Navabpour S., Morris K., Allen R., Harrison E., A-H-Mackerness S., Buchanan-Wollaston V. Expression of senescence-enhanced genes in response to oxidative stress. J. Exp. Bot. 2003;54:2285–2292. doi: 10.1093/jxb/erg267. [DOI] [PubMed] [Google Scholar]
- 54.Wang Z., Wang Y., Hong X., Hu D., Liu C., Yang J., Li Y., Huang Y., Feng Y., Gong H. Functional inactivation of UDP-N-acetylglucosamine pyrophosphorylase 1 (UAP1) induces early leaf senescence and defence responses in rice. J. Exp. Bot. 2014;66:973–987. doi: 10.1093/jxb/eru456. [DOI] [PMC free article] [PubMed] [Google Scholar]
- 55.Foyer C.H., Noctor G. Oxidant and antioxidant signalling in plants: A re-evaluation of the concept of oxidative stress in a physiological context. Plant Cell Environ. 2005;28:1056–1071. doi: 10.1111/j.1365-3040.2005.01327.x. [DOI] [Google Scholar]
Associated Data
This section collects any data citations, data availability statements, or supplementary materials included in this article.


