

Abstract
Osteonecrosis of the femoral head (ONFH) is a debilitating disease that results in progressive collapse of the femoral head and subsequent degenerative arthritis. Few treatments provide both sufficient mechanical support and biological cues for regeneration of bone and vascularity when the femoral head is still round and therefore salvageable. We designed and 3D printed a functionally-graded scaffold (FGS) made of polycaprolactone (PCL) and β-tricalcium phosphate (β-TCP) with spatially controlled porosity, degradation and mechanical strength properties to reconstruct necrotic bone tissue in the femoral head. The FGS was designed to have low porosity segments (15% in proximal and distal segments) and a high porosity segment (60% in middle segment) according to the desired mechanical and osteoconductive properties at each specific site after implantation into the femoral head. The FGS was inserted into a bone tunnel drilled in rabbit femoral neck and head, and at 8 weeks after implantation, the tissue formation as well as scaffold degradation was analyzed. Micro-CT analysis demonstrated that the FGS-filled group had a significantly higher bone ingrowth ratio compared to the empty-tunnel group, and the difference was higher at the distal low porosity segments. The in vivo degradation rate of the scaffold was higher in the proximal and distal segments than in the middle segment. Histological analysis of both non-decalcified and calcified samples clearly indicated new bone ingrowth and bone marrow-containing bone formation across the FGS. A 3D printed PCL-β-TCP FGS appears to be a promising customized resorbable load-bearing implant for treatment of early stage ONFH.
Keywords: Bone, Osteonecrosis, femoral head, hip, functionally-graded scaffold, 3D Printing, resorbable implant, polymer-ceramic composite
1 Introduction
Osteonecrosis of the femoral head (ONFH) is a debilitating disease that is increasing in incidence worldwide1 and frequently progresses to collapse of the femoral head and osteoarthritis that necessitates total hip replacement2; 3. In the early stages of ONFH, various medical and surgical treatments to preserve the integrity of the femoral head including pharmacological agents such as statins4; 5 and anticoagulants6; 7, electromagnetic therapy8, weight reduction, protected weight bearing and range of motion exercises have been attempted with limited success and have not prevented collapse or provided lasting improvement1. Alternatively, surgical treatments such as core decompression of the necrotic segment1; 9 are often performed in order to relieve pain and prevent the progression of early stages of ONFH to late femoral head collapse. However, mixed results in the success rate have been reported varying from 20–70% for the early (pre-collapse) stages10; 11. Maintenance of sphericity of the patient’s own femoral head requires both mechanical and biological strategies to withstand intermittent loading and, at the same time, reconstitute the necrotic femoral bone segment. A long term follow-up study (average 25 years) of anterior rotational osteotomy has suggested that spontaneous repair and remodeling can occur in the necrotic lesion in the femoral head when shielding the hip from weight-bearing3; 12; 13. Progressive collapse of the femoral head due to weight-bearing disrupts the process of spontaneous repair and remodeling, and results in incongruity of the joint and subsequent degenerative arthritis13. To this end, it would be desirable to provide a graft or implant to the resultant large bone channel after core decompression to strengthen the mechanical and structural support and facilitate repair and remodeling, further preventing the collapse of the femoral head. A vascularized fibula graft is one clinical option available but demonstrates several limitations including pain associated with graft harvesting, availability of sufficient transplantable bone, and the possibility of infection as well as donor site morbidity14–16. Currently, the implant manufacturer Zimmer supplies a porous tantalum metal implant as a treatment for early stage ONFH. However, a retrieval analysis of clinically failed implants has demonstrated little evidence of vascular invasion and minimal bone ingrowth (only 1.9%) in these implants, much less than the mean density (26.2%) of the adjacent femoral head trabecular bone17; 18. A continuous shell of new cortical bone formed around the tantalum implant which would prevent vascular and osteoprogenitor cell invasion and subsequent reconstitution of cancellous bone.
Given the above, a novel approach in treating early stage ONFH when the femoral head is still round and therefore salvageable, is to debride the necrotic segment and provide a mechanically- and biologically-sound biodegradable template for reconstitution of the osteonecrotic area within the femoral head. In this study, we developed a mechanically robust and functionally-graded scaffold (FGS) with spatially-controlled porosity, degradation and mechanical properties as filler for the core decompression tunnel. The FGS for ONFH treatment was composed of three segments of spatially-graded porosity: a proximal segment to support the subchondral area, a middle segment located in the main osteonecrotic area of the femoral head, and a distal segment to support the cortical-like structure (Figure 1-A). The proximal and distal segments of the scaffold were designed relatively less porous to mimic subchondral and cortical bone, and provide support to withstand mechanical loads and maintain the integrity of the articular surface. The middle segment was designed to possess relatively higher porosity to mimic the trabecular bone of the femoral head, which provides an appropriate template for vascularization and new bone ingrowth and mechanical stability against the forces applied on the femoral head resulting in bending moment. We utilized additive manufacturing (AM) technology, also known as 3D printing, to form FGSs with controlled porosity for various segments of the FGSs in a single process. 3D printing also enables the customization of FGS for individual patients based on the anatomical size and level of ONFH condition. Biodegradable poly(ε-caprolactone) (PCL) and β-tricalcium phosphate (β-TCP) were used for the fabrication of FGS because PCL and β-TCP are in current clinical use and can provide an appropriate scaffold for bone repair and regeneration19–22. We first characterized the physical and mechanical properties of each segments of FGS. A comprehensive animal study was conducted to show the potential of design and material of FGS for promoting bone ingrowth and regeneration in core decompression bone tunnel of rabbit femoral heads.
Figure 1.
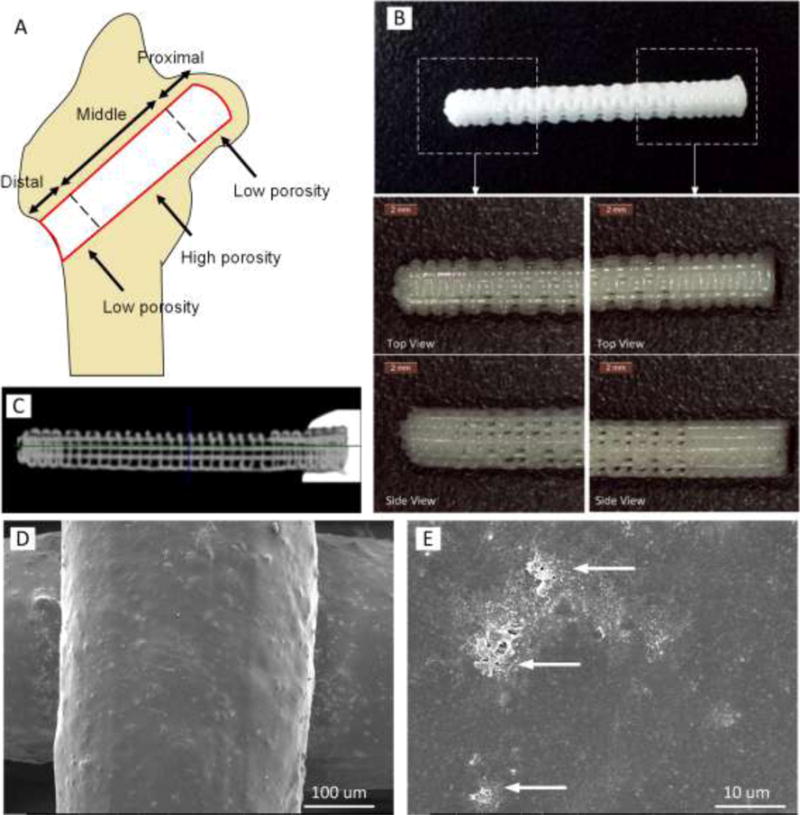
FGS for ONH treatment composed of three segments of spatially-graded porosity: a proximal segment to support the subchondral area, a middle segment located in the main osteonecrotic area of the femoral head, and a distal segment to support the cortical-like structure. (A) A schematic image illustrating how three segments of FGS are located in femoral head. (B) 3D printed PCL-β-TCP of 3.5 mm diameter and 27 mm length with magnified view of distal and proximal segments. (C) Micro CT scan of FGS: low porous (15%) proximal and distal segments as well as high porous (60%) middle region are shown. (D and E) SEM images of scaffold strut surface demonstrating roughness and micro-pores formed after NaOH treatment. Arrows depict clusters of β-TCP on the strut surface.
2 Materials and Methods
2.1 Materials
Medical-grade PCL (mPCL) pellets (Aldrich Chemical Company) with density of 1.145 g/cm3 (Mn = 80,000) were used as received. β-TCP powder with a specific surface area of 17 m2/g and particle size of mesh 60 was obtained from Nanocerox, Inc. (Ann Arbor, Michigan). A slurry was prepared by dispersing β-TCP powder in acetone at 50 °C, followed by gradual incorporation of PCL pellets. A PCL:β-TCP:acetone weight ratio of 80:20:400 was used. Vigorous mechanical stirring was performed for 3 h to ensure the homogenous distribution of the β-TCP particles in the PCL slurry. The slurry was poured out evenly into glass plates, left overnight to evaporate, and further dried in a vacuum overnight to remove any residual acetone. Then, as raw material for AM process, the material was shaped as long filaments via warming up and extruding through a 2.2-mm orifice of an in-house-made filament-maker machine.
2.2 Design and Fabrication of PCL- β-TCP FGS
FGS for ONFH treatment was designed to be composed of three segments of spatially-graded porosity, including 3.5 mm in diameter × 4 mm in length for proximal segment of 15% porosity, 3.5 mm in diameter × 17 mm in length for middle segment and 3.5 mm in diameter × 6 mm for distal segment of FGS. Such a graded scaffold was formed in one piece using our in-house-built layer-by-layer 3D fabrication system, Hybprinter23; 24. Briefly, the filaments were fed into the Hybprinter where they were melted at 140°C, extruded as 350 μm struts and laid down in 0/90° patterns layer-upon-layer to form porous lattice-shaped scaffolds. The layer thickness (= distance between the sequential layers) was selected equal to 300 μm. The spacing between the adjacent struts was defined in a way to provide 15% porosity in proximal segment and distal regions and 60% porosity in middle region. Also, similar setting was used to form samples for physical and mechanical characterizations. All scaffolds were surface-treated in 5M NaOH for 12 h at room temperature to enhance their hydrophilicity and micro-roughness on the strut surface.
2.3 Physical characterizations
Porosity of samples for proximal, middle, and distal segments was measured using high resolution micro-CT scanner (SMX-100CT-SV3; Shimadzu Co., Kyoto, Japan), and analyzed by 3D image processing software (VG Studio MAX 2.0; Volume Graphics, Heidelberg, Germany). 3D printed scaffolds were also scanned via secondary electron emission imaging using SEM (FEI XL30 Sirion) to analyze strut size, pore size, and layer thickness as well as to observe surface morphology of the struts. The water-uptake characteristic represents hydrophilicity of the scaffolds and the surface condition of the scaffold struts for cell anchorage, adhesion and proliferation as well as new tissue ingrowth and integration25. The water uptake ability of the porous scaffolds was determined as described25. The percentage of water uptake was determined as
where Ww and Wd are the weight of wet and dry samples, respectively. The test was conducted using five specimens of each sample type (i.e., different strut size).
The degradation of PCL-β-TCP scaffolds with 15% and 60% porosity was compared in alkaline medium. To accelerate the hydrolysis reaction 5M sodium hydroxide (NaOH) was used26. Scaffolds of 5×5×10 mm3 were submerged in 2 mL of NaOH at 37 °C. The scaffolds were dried and weighted after 12hr, 24hr, 36hr and 48hr. The degradation rate was determined as weight loss percentage at each time point using the following equation:
where Wint and Wdeg are the initial weight and weight after degradation, respectively. Five samples per group were measured.
2.4 Mechanical Characterization
2.4.1 Compression Test
The mechanical properties of the scaffolds were measured using an Instron 5944 uniaxial testing system with a 2 kN load-cell (Instron Corporation, Norwood, MA). Specimens with 5×5 mm2 square cross-section and 10 mm in height were mechanically tested under compression between two platens (one self-aligning, one fixed) at a rate of 0.1% strain/sec up to 25% strain with a 1 N preload. Displacement was determined from an extensometer (Model: 3442-0064-050-ST, Gauge length: 16.3mm, Epsilon Technology Corp, Jackson WY) attached to the two platens. The testing protocol was adapted from the reference27 where, for all the specimens, the apparent modulus of elasticity was calculated as the slope of the initial linear portion of the stress-strain curve. The effective stress values were determined as the compressive loading value per the apparent initial cross-sectional area of each test specimen. The strain values were calculated by dividing the deformation values by the initial specimen height. Yield compression strength was defined as the intersection of the stress-strain curve with a line with a slope equal to the modulus starting at an offset of 1% strain. Five samples were tested for each group of 15% and 60% porosity.
2.4.2 Flexural Test
To measure bending flexural stiffness of scaffolds, 3.7 mm × 3.9 mm × 70 mm samples of 60% porosity were tested under 3-point bending following ASTM D790 recommendations. Bending tests were conducted using a support span of 56 mm, which resulted in a support span to specimen depth ratio of approximately 15:1 (depth=3.7 mm). A 100 N load cell was used for the test. Following application of a 0.1 N preload, the central loading nose was lowered at a rate of 0.1 % strain/sec to 5% strain. The apparent flexural modulus was calculated as the slope of the initial linear portion of the stress-strain curve (between 0.1 and 1.1% strain). Five samples per group were measured.
2.5 In vivo evaluation
2.5.1 Animals
Five male New Zealand White rabbits (Charles River Laboratories Inc. USA) weighing from 3.5 to 4.0 kg were used in this study. Animals were anesthetized by administration of 40 mg/kg ketamine and 4 mg/kg xylazine. Additional inhalation anesthesia was performed with isoflurane. Analgesia was administered by injection of 0.5 mg/kg buprenorphine twice a day for the first 2 days after surgery. All experiments with animals were approved and performed following Stanford University Animal Care and Use Committee guidelines.
2.5.2 Surgical procedure
A 20 mm lateral skin incision was created to expose the greater trochanter. Core decompression of 3.5 mm diameter was performed from distal end of the greater trochanter along the axis of the femoral neck on both hips. The tunnel direction was in the mid axis of the femoral neck. First, a bone tunnel was created from laterally towards the femoral head superomedially using a 2 mm diameter drill under fluoroscopic guidance. The depth of bone tunnel was approximately 27 mm. This 2 mm tunnel was widened with a 3.5 mm diameter drill bit. FGS (3.5 mm in diameter and 27 mm in length - Figures 1B and 1C) was randomly assigned and inserted into the tunnel in the right or the left hip and the other tunnel was kept empty as a control. The scaffold was press fitted into the bone tunnel manually. Five implants were used for this study based on our previous experience in which the bone tunnel was created in the rabbit femur28; 29. According to our previous study, bone infiltration into porous bodies implanted in rabbit femoral bone had a standard deviation of around 4.5% and the difference between bone infiltration into bioactive and non-bioactive porous bodies was 10 – 30%28. Power analysis calculated using those previous data indicated that a sample size of five per group would provide 80% statistical power to detect significant differences between the groups (α = 0.05, β = 0.20) using analysis of variance (ANOVA).
2.5.3 Micro-CT analysis
A microfocus X-ray computed tomography system (SMX-100CT-SV3; Shimadzu Co., Kyoto, Japan) was used to acquire microstructural information for proximal femur at 8 weeks after implantation of FGSs. The entire set of radiographs was deconvoluted by computer software to reconstruct a 3D image of the microstructure with a voxel size of 12 μm and was evaluated using 3D image-processing software VG studio MAX 2.0(Volume Graphics, Heidelberg, Germany). A cylindrical region of interest (3.5 mm in diameter × 4 mm in length for proximal segment, 17 mm in length for middle segment and 6 mm for distal segment of FGS) was co-centrically positioned over the core decompression site. The location of original bone tunnel in empty-tunnel group was confirmed on CT image based on to anterior-posterior and lateral view of X-ray taken during surgery. The volume of new bone and remaining FGS was determined by the software. Thresholds were applied to differentiate between new bone and residual scaffold material in the region of interest as reported previously30.
The degradation rate for each segment was determined as volume loss percentage at 8 weeks using the following equation:
where Vint and Vdeg are the initial volume of FGS segment its initial and volume after degradation, respectively.
The bone ingrowth ratio (%) for each segment of FGS was determined as the fraction of bone area in the space available for bone ingrowth after 8 weeks using the following equation:
where Vbone, Vtotal and Vrem are the volume of newly formed bone, the total volume of the segment and the volume of remaining FGS after degradation, respectively.
2.5.4 Histology
After 8 weeks of implantation, following the euthanasia, the proximal femoral bone was harvested and prepared for histology. Three samples from each group were prepared for decalcified histological analysis. The specimens were fixed in 10% phosphate-buffered formaldehyde (pH 7.25) for 24 h and decalcified in 15% EDTA (pH 8.0) at 4 °C. Then, the samples were dehydrated in graded ethanol (70, 85, 90 and 100%), then cleared in xylene, and embedded in paraffin. Thin sections (8 μm) were cut and mounted on glass slides. Before staining, the sections were de-paraffinized in 100% xylene and rehydrated in graded ethanol. Specimens were analyzed by hematoxylin and eosin (H&E) staining. Also, two samples from each group were prepared for undecalcified histology. The specimens were dehydrated in graded ethanol after fixed in 10% formaldehyde, and then embedded in a cold setting epoxy resin. Thick specimens (250μm) were cut with a band saw and ground to a thickness of 50μm. Each section was evaluated with Stevenel blue and Van Gieson’s picro fuchsin staining.
2.6 Statistical Analysis
All data are expressed as means ± standard deviation (SD). For the comparison among three segments (proximal, middle and distal), the homogeneity of the variance among groups was assessed with the Bartlett test before examined with ANOVA. When the variance was homogeneous, comparisons between groups were performed with one-way ANOVA followed by a post hoc test (Tukey–Kramer multiple comparison test). All analyses were performed using JMP 9 (SAS Institute, Cary, NC). For comparison between two groups (empty group vs. scaffold group, and low porosity segment vs. high porosity segment), Student’s t test was used to investigate the significant difference between the groups. Values of p<0.05 were considered statistically significant. For mechanical and physical characterizations, the difference was considered statistically significant, as analyzed by a t-test, if the p-value was less than 0.05.
3 Results
3.1 Morphology of FGS
Figure 1B shows digital photos of a representative FGS. The proximal and distal less porous segments are shown from both top and side views. Figure 1C shows a representative micro CT image of a longitudinal cross-section of FGS. Also, the SEM images of scaffold strut surface are shown in Figures 1D and 1E, demonstrating roughness and micro-pores formed after NaOH treatment.
3.2 Porosity and Water-uptake
Figure 2A shows the porosity and water-uptake of scaffolds for high and low porosity segments of FGS. The porosities of scaffolds via micro CT analysis were 16.8 ± 1.8%, 59.5 ± 1.2% and 16.4 ± 1.7% for proximal, middle and distal segment, respectively, which were in good agreement (~2.0% difference) with designed porosity. Water-uptake yielded values of 15.1 ± 2.1% for dense segments and 72.3 ± 12.9% for the less dense segment, respectively. There was no significant difference in water-uptake and porosity measurements, demonstrating excellent hydrophilicity of sample surface treated by alkali.
Figure 2.
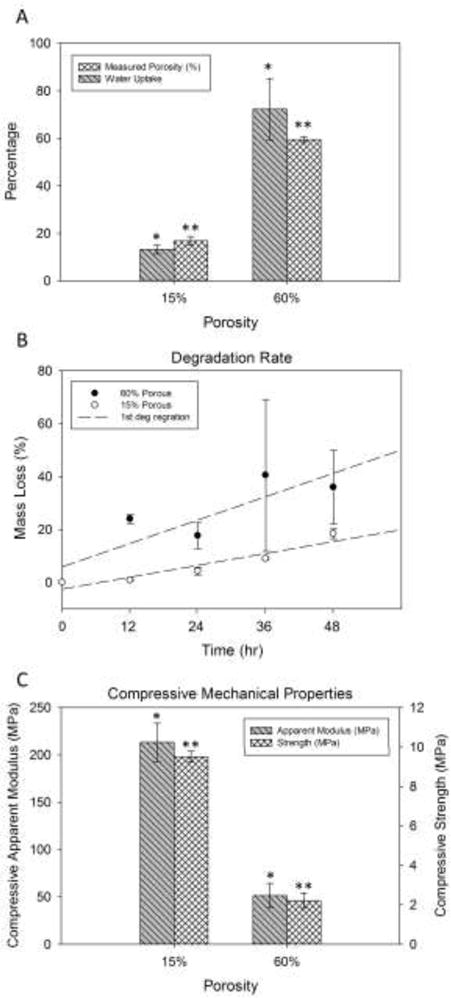
Physical and mechanical properties of FGS: (A) Porosity and water-uptake of scaffolds for high and low porosity segments of FGS determined via micro CT analysis equal to 16.8 ± 1.8%, 59.5 ± 1.2% and 16.4 ± 1.7% for proximal, middle and distal segment, respectively. Water-uptake yielded values of 15.1 ± 2.1% for dense segments and 72.3 ± 12.9% for the less dense segment, respectively. (B) Accelerated degradation rates of scaffolds of high and low porosity in alkaline medium (5M NaOH) for every 12 h up to 48 h. Both 15% and 60% scaffolds exhibited almost linear degradation rates. (C) Strength and apparent modulus of elasticity of PCL-β-TCP scaffolds with low and high porosity under uniaxial compression.
3.3 Degradation
Figure 2B shows the accelerated degradation rates of scaffolds of high and low porosity in alkaline medium (5M NaOH) for every 12 hr up to 48 hr. Both scaffolds exhibited almost linear (R2 was 0.52 and 0.95 for 60% and 15% porous samples, respectively) degradation rates, and the scaffolds of 60% porosity demonstrated significantly higher weight loss rate in vitro compared to those of lower porosity under such an accelerated degradation condition. The 60% porous samples lost their structural integrity after 36 hours and were difficult to collect for weight measurements. This contributed to the reported high standard deviations.
3.4 Mechanical Properties
The strength and apparent modulus of elasticity of PCL-β-TCP scaffolds with low and high porosity were measured under compression. As shown in Figure 2C, the average strength of the 60% porous scaffold was 2.2 MPa. The apparent modulus of 60% porous scaffolds was 51.5 MPa. The scaffolds with lower porosity (15%) exhibited significantly higher compressive strength and apparent elastic modulus: 9.5 MPa and 213.4 MPa, respectively. Also, flexural mechanical stiffness of the 60% porous scaffolds under three point bending condition was 104.8±19.7 MPa.
3.5 Micro CT analysis
Micro CT was used to measure the volumes of residue FGS and newly formed bone of explants at 8 weeks after implantation. Figure 3 shows representative micro CT images of explants with and without FGS. The CT images (Figure 3A) showed that the lattice pattern and structural integrity of the scaffold were well maintained at 8 weeks after implantation. In the FGS group, the mineralized tissue was observed in the interconnected macro-pores of FGS in femoral head (Figure 3B). In the empty-tunnel group, most of the space in the bone tunnel remained empty, but there was some mineralized tissue around the tip of the tunnel (Figure 3D).
Figure 3.
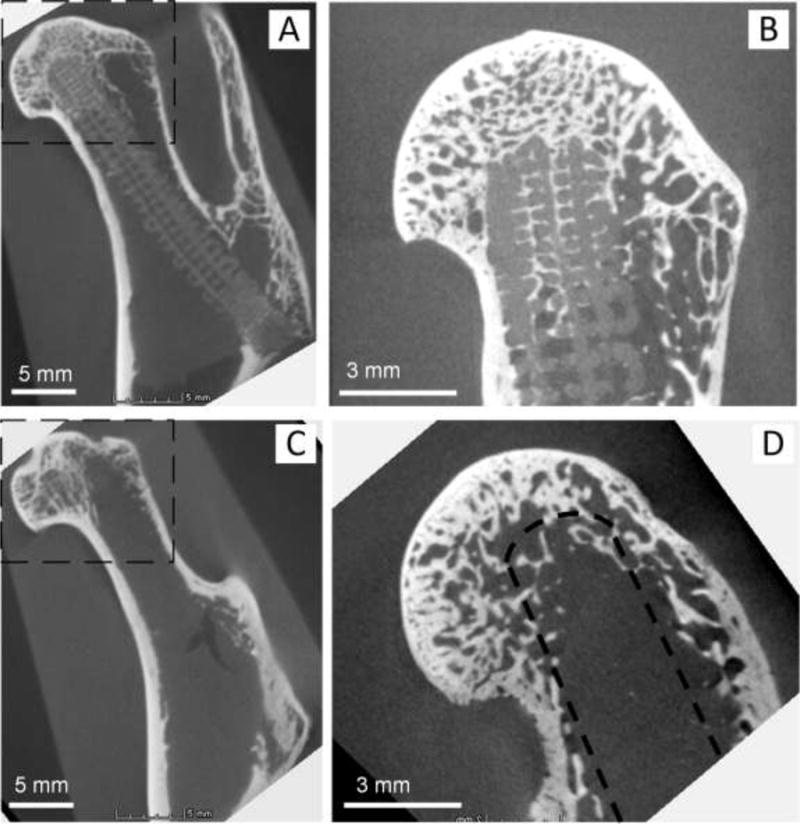
Representative micro CT images of explants with (A and B) and without FGS (C and D): (B) and (D) are images scanned, focusing on the box area shown in (A) and (C). (A) Micro CT of femoral head with FGS. Lattice pattern and structural integrity of the scaffold were well maintained at 8 weeks after implantation. (B) Mineralized tissue shown in the interconnected macro-pores of proximal FGS in femoral head. (C) Micro CT image of femoral head with empty tunnel. (D) In the empty-tunnel group, most of the space in the bone tunnel remained empty, but there was some mineralized tissue around the tip of the tunnel. A drilled tunnel is depicted by a dashed line.
Figure 4A shows the degradation rate of the FGS that was quantified using CT scans. The degradation rates of the proximal, middle and distal segments were 25.7±11.3 %, 11.1±4.0 %, and 20.4±6.9 %, respectively. The difference in degradation rate between proximal and middle segments was statistically significant (p=0.028), whereas the differences in degradation rate between proximal and distal segments, or between middle and distal segments were not (p = 0.539 and 0.180, respectively).
Figure 4.
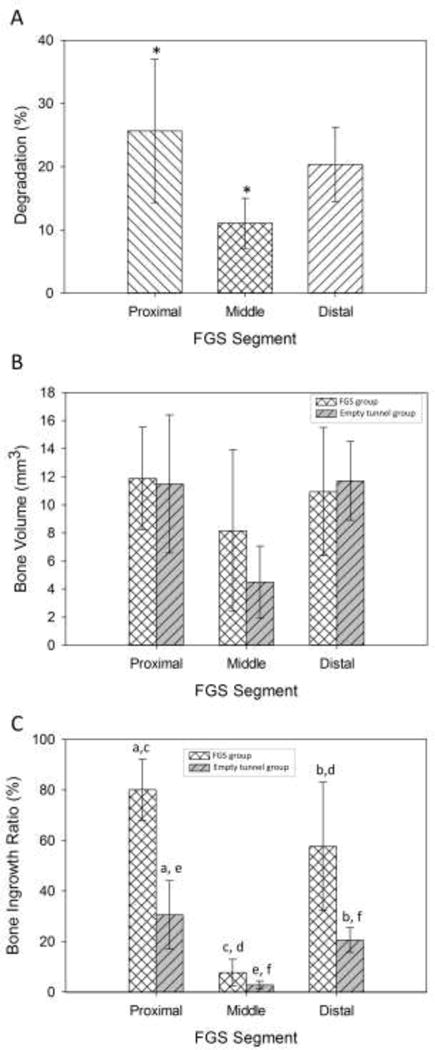
In vivo evaluation of FGS degradation and new bone formation: (A) Degradation rate of the FGS quantified using CT scans. The degradation rates of the proximal, middle and distal segments were measured 25.7±11.3 %, 11.1±4.0 %, and 20.4±6.9 %, respectively. Groups with star signs are significantly different from each other with p<0.05. (B) The volumes of newly formed bone measured at 8 weeks post-surgery were measured 11.9±3.6 mm3 in the proximal segment, 8.2±5.8 mm3 in the middle segment, 10.9±4.6 mm3 in the distal segment for the scaffold group. (C) Bone ingrowth ratio for the scaffold group was 80.1 ± 12.1 % for the proximal segment, 7.7±5.2 % for the middle segment and 57.7±25.4 % for the distal segment. Groups that are indicated with the same lowercase letters (for example the pairs with letter “a”) are significantly different from each other with p<0.05 as analyzed by a t-test.
The volumes of newly formed bone measured at 8 weeks post-surgery were measured 11.9±3.6 mm3 in the proximal segment, 8.2±5.8 mm3 in the middle segment, 10.9±4.6 mm3 in the distal segment for the scaffold group (Figure 4B). And they were 11.5 ± 4.9 mm3 for the proximal segment, 4.5±2.6 mm3 for the middle segment and 11.7±2.8 mm3 for the distal segment for the empty group. The bone ingrowth ratio for the scaffold group was 80.1 ± 12.1 % for the proximal segment, 7.7±5.2 % for the middle segment and 57.7±25.4 % for the distal segment (Figure 4C). The bone ingrowth ratio for the empty-tunnel group was 30.5±13.5 % for the proximal segment, 2.8±1.6 % for the middle segment and 20.5±4.8 % for the distal segment. The difference in bone ingrowth ratio between the scaffold-filled group and the empty-tunnel group was statistically significant for the proximal segment (p= 0.005) and distal segment (p= 0.031), but not for the middle segment (p= 0.164).
3.6 Histology
Figure 5 demonstrates non-decalcified sections of osseous ingrowth in decompression tunnel in the presence and absence of FGS with Stevenel blue and Van Gieson’s picro fuchsin staining. After 8 weeks of implantation, considerable amounts of new bone were seen in both the FGS group and empty-tunnel groups. Figure 5A demonstrates non-decalcified sections of osseous ingrowth within the pores of FGS. Almost all space available was occupied by newly formed bone in proximal segment of FGS. At a higher magnification as shown in Figure 5B, newly formed bone tissue in the porous area was in direct contact with the lattice strut. Blood vessels containing osteon-like structures were also observed within the newly formed bone tissues in direct contact with the scaffold struts across the macro-porous scaffold as are shown by arrows in Figure 5B. Figure 5C shows bone ingrowth in the tip area of the empty tunnel samples. The position of the drilled tunnel is depicted by a dashed line.
Figure 5.
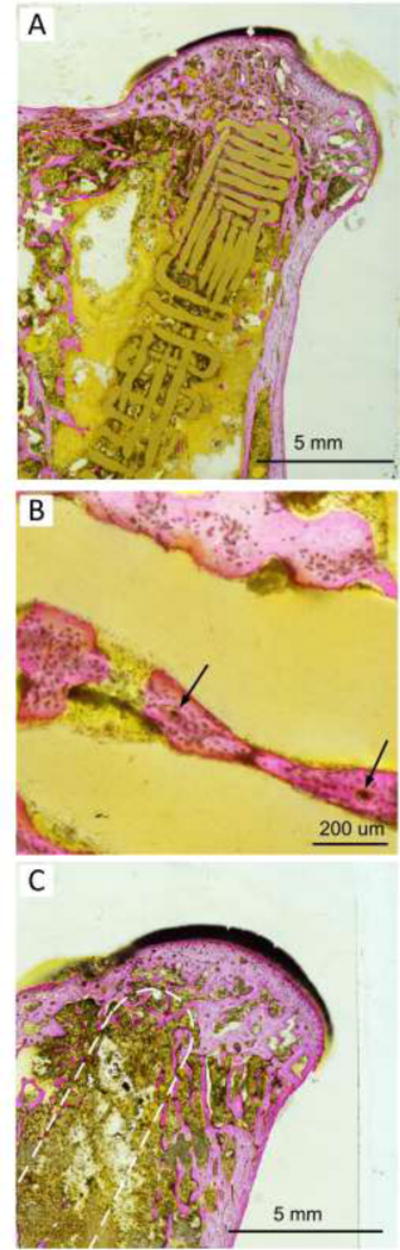
This figure demonstrates non-decalcified sections of osseous ingrowth in decompression tunnel in the presence and absence of FGS with Stevenel blue and Van Gieson’s picro fuchsin staining after 8 weeks of implantation. (A) demonstrates non-decalcified sections of osseous ingrowth within the pores of FGS. (B) shows newly formed bone tissue in the porous area and in direct contact with the lattice strut at a higher magnification. Blood vessels containing osteon-like structures within the newly formed bone tissues were depicted by arrows. (C) shows bone ingrowth in the tip area of the empty tunnel samples. The position of the drilled tunnel is depicted by a dashed line.
Figure 6 shows decalcified sections of newly formed bone within FGS pores with H&E staining. In Figure 6A, extensive new bone formation with bone marrow was observed. The newly formed bone tissues occupied the void space of the macro-porous scaffold, and were in direct contact with scaffold struts. Figure 6B shows a magnified image of the area depicted by dashed lined in Figure 6A. Similar to Figure 5B, blood vessels containing osteon-like structures (labeled by arrows) were clearly observed to be embedded in osteocyte-like containing lamellar bone. Figure 6C shows bone marrow formation in the newly formed bone.
Figure 6.
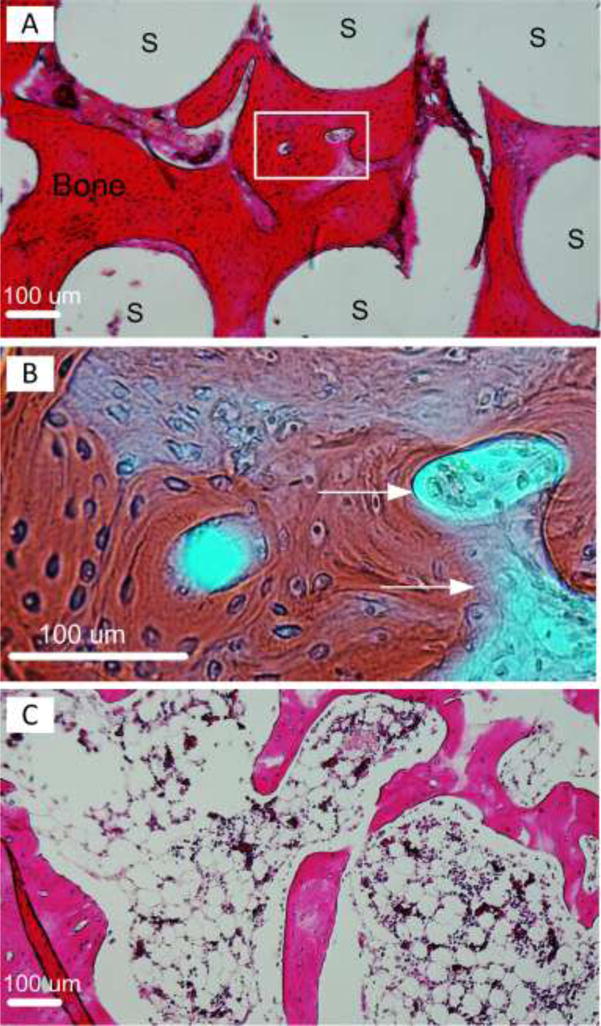
Decalcified sections of newly formed bone within FGS pores with H&E staining. (A) Extensive new bone formation with bone marrow shown in red. White area labeled “S” are FGS struts. (B) shows a magnified image of the area depicted by dashed lined in (A). Blood vessels containing osteon-like structures were depicted by arrows. (C) shows bone marrow formation in the newly formed bone.
4 Discussion
In the United States alone, approximately 20,000 cases of ONFH are diagnosed each year1; 31; 32. In highly industrialized Asian countries such as Japan and Korea, ONFH is the primary or secondary etiology leading to THR33. Currently, as many as 18% of all total arthroplasties performed in the USA are a result of ONFH1; 34; 35. Though core decompression as an early stage treatment for ONFH show promises, 30% of hips still progress to a later stage. A resorbable implant/filler that provides adequate mechanical support for the femoral head while promoting new bone formation is of interest to enhance the efficacy of core decompression. In this study, we used a composite of polymer and ceramic (PLC-β-TCP 80:20) and locally tailored its porosity. Thus, FGS consisted of three segments, each of which had the porosity close to the target host bone porosity. The proximal and distal segments had low porosity of around 15% which was slightly higher than the porosity of cortical bone (5 to 10 %) in the human femoral neck36–39. The compressive strength of the low porosity scaffold (15% porosity) was measured 9.5 MPa. The proximal segment was expected to support the subchondral area of the femoral head and prevent the collapse of the femoral head under compressive loads whereas at the same time it was also expected to allow bone ingrowth and formation within the pores. The middle segment, designed to fill the trabecular bone area in trochanteric region, had relatively low porosity of 60% resembling the porosity of human trabecular bone (50 to 90%40). The high porosity segment (60% porosity) had a compressive strength at 2.2 MPa. The mechanical properties of both proximal and middle segments were within the range of compressive strength for human trabecular bone (ranging from 0.2 to 10 MPa)41–44. The distal segment of 15% porosity and 9.5MPa, fits into the core decompression tunnel inlet created in the cortical bone, and provides initial mechanical strength after implantation. We rationalize that the ultimate strength of the cortical shell will be achieved by seamless integration between the implant and host bone, and replaced by the regenerating cortical bone via remodeling. Utilizing a 3D printing technique, the scaffold was successfully fabricated with such functionally tailored porosity.
In the present study, the scaffold was soaked in 5M NaOH for 12 h before implantation into the femoral head and degradation rates at 8 weeks were from 11.1 to 25.7%. These values are in agreement with the literature30; 45; 46, although PCL-β-TCP degradation data have not been previously reported for a femoral head model. The degradation of FGS was higher in the proximal (~25%) and distal (~20%) segments compared to the middle segment (10%) although the difference between the distal segment and middle segment was not significant. This result is in contrast with the in vitro degradation result where the accelerated degradation was measured about three times higher for 60% porous scaffolds compared to the 15% porous scaffolds (Figure 2). The difference is probably the result of the cellular activities on PCL- β-TCP in vivo.
The osteoconductive property of PCL-TCP scaffolds has been widely examined in vitro and in vivo. In a lumbar interbody fusion model in Yorkshire pigs47 and in sheep46, high bone ingrowth was observed. In the present study, for the first time, we used PCL-β-TCP implants with functionally-graded porosity in a rabbit femoral head model. The proximal segment of FGS was positioned in the subchondral region (Figure 1) and showed a high bone ingrowth ratio of ~80% at 8 weeks. The distal segment also showed almost 60% bone ingrowth ratio. However, the bone ingrowth ratio in the middle segment was less than 10%. Beside higher bone ingrowth and formation in the cortical bone regions, the results imply that the high bone formation might have accelerated the degradation of PCL-β-TCP. Our current study did not test the implant using an osteonecrotic model and functions as a potential “proof-of-concept” study. Further studies are in progress to test this implant in an early stage model of ONFH.
5 Conclusion
This study has demonstrated that 3D printed PCL-β-TCP FGSs can significantly improve bone ingrowth in a large bone tunnel created by core decompression. This approach builds on the foundation for treatment of ONFH by introducing a novel paradigm for debridement of the osteonecrotic segment and placement of a customized biomimetic resorbable load-bearing implant for femoral head reconstitution and preservation.
Acknowledgments
This work was supported by grants from the following agencies: Stanford Wallace H. Coulter Seed Grants, Boswell Foundation, NIH R01AR057837 (NIAMS), NIH R01DE021468 (NIDCR), NIH 1U01AR069395 (NIAMS), DOD W911NF-14-1-0545 (DURIP), and DOD W81XWH-10-1-0966 (PRORP).
Footnotes
Author Contributions Statement: YS, SBG, and YY conceived the project, and designed the scaffold. TK performed in vivo, microCT and histology studies; YS and SF fabricated and characterized the scaffold; AB performed the mechanical testing; YO performed non-decalcified histology; TK, YS, YY wrote the paper and analyzed data; SBG wrote the paper. All authors have read and approved the final submitted manuscript.
References
- 1.Amanatullah DF, Strauss EJ, PE DC. Current management options for osteonecrosis of the femoral head: part II, operative management. Am J Orthop (Belle Mead NJ) 2011;40:216–225. [PubMed] [Google Scholar]
- 2.Waewsawangwong W, Ruchiwit P, Huddleston JI, et al. Hip arthroplasty for treatment of advanced osteonecrosis: comprehensive review of implant options, outcomes and complications. Orthop Res Rev. 2012;2016:8, 13–29. doi: 10.2147/ORR.S35547. [DOI] [PMC free article] [PubMed] [Google Scholar]
- 3.Stevens K, Tao C, Lee SU, et al. Subchondral fractures in osteonecrosis of the femoral head: comparison of radiography, CT, and MR imaging. AJR Am J Roentgenol. 2003;180:363–368. doi: 10.2214/ajr.180.2.1800363. [DOI] [PubMed] [Google Scholar]
- 4.Pritchett JW. Statin therapy decreases the risk of osteonecrosis in patients receiving steroids. Clin Orthop Relat Res. 2001:173–178. doi: 10.1097/00003086-200105000-00022. [DOI] [PubMed] [Google Scholar]
- 5.Wang GJ, Cui Q, Balian G. The Nicolas Andry award. The pathogenesis and prevention of steroid-induced osteonecrosis. Clin Orthop Relat Res. 2000:295–310. doi: 10.1097/00003086-200001000-00030. [DOI] [PubMed] [Google Scholar]
- 6.Glueck CJ, Freiberg RA, Sieve L, et al. Enoxaparin prevents progression of stages I and II osteonecrosis of the hip. Clin Orthop Relat Res. 2005:164–170. doi: 10.1097/01.blo.0000157539.67567.03. [DOI] [PubMed] [Google Scholar]
- 7.Johnson AJ, Mont MA, Tsao AK, et al. Treatment of femoral head osteonecrosis in the United States: 16-year analysis of the Nationwide Inpatient Sample. Clin Orthop Relat Res. 2014;472:617–623. doi: 10.1007/s11999-013-3220-3. [DOI] [PMC free article] [PubMed] [Google Scholar]
- 8.Massari L, Fini M, Cadossi R, et al. Biophysical stimulation with pulsed electromagnetic fields in osteonecrosis of the femoral head. The Journal of bone and joint surgery American. 2006;88(Suppl 3):56–60. doi: 10.2106/JBJS.F.00536. [DOI] [PubMed] [Google Scholar]
- 9.Caoa H, Guanc H, Laia Y, et al. Review of various treatment options and potential therapies for osteonecrosis of the femoral head. J Orthop Translat. 2016;4:57–70. doi: 10.1016/j.jot.2015.09.005. [DOI] [PMC free article] [PubMed] [Google Scholar]
- 10.Learmonth ID, Maloon S, Dall G. Core decompression for early atraumatic osteonecrosis of the femoral head. J Bone Joint Surg Br. 1990;72:387–390. doi: 10.1302/0301-620X.72B3.2341433. [DOI] [PubMed] [Google Scholar]
- 11.Mont MA, Carbone JJ, Fairbank AC. Core decompression versus nonoperative management for osteonecrosis of the hip. Clin Orthop Relat Res. 1996:169–178. doi: 10.1097/00003086-199603000-00020. [DOI] [PubMed] [Google Scholar]
- 12.Motomura G, Yamamoto T, Suenaga K, et al. Long term outcome of transtrochanteric anterior rotational osteotomy for osteonecrosis if the femoral head in patients with systemic lupus erythematosus. Lupus. 2010;19:860–865. doi: 10.1177/0961203310361896. [DOI] [PubMed] [Google Scholar]
- 13.Yamamoto T, Ikemura S, Iwamoto Y, et al. The repair process of osteonecrosis after a transtrochanteric rotational osteotomy. Clin Orthop Relat Res. 2010;468:3186–3191. doi: 10.1007/s11999-010-1384-7. [DOI] [PMC free article] [PubMed] [Google Scholar]
- 14.Younger E, Chapman M. Morbidity at bone graft donor sites. J Orthop Trauma. 1989;3:192–195. doi: 10.1097/00005131-198909000-00002. [DOI] [PubMed] [Google Scholar]
- 15.Mistry AS, Mikos AG. Tissue engineering strategies for bone regeneration. Adv Biochem Eng Biotechnol. 2005;94:1–22. doi: 10.1007/b99997. [DOI] [PubMed] [Google Scholar]
- 16.Kim DH, Rhim R, Li L, et al. Prospective study of iliac crest bone graft harvest site pain and morbidity. The spine journal : official journal of the North American Spine Society. 2009;9:886–892. doi: 10.1016/j.spinee.2009.05.006. [DOI] [PubMed] [Google Scholar]
- 17.Oh K-J, Pandher DS. A new mode of clinical failure of porous tantalum rod. Indian J Orthop. 2010;44:464–467. doi: 10.4103/0019-5413.69322. [DOI] [PMC free article] [PubMed] [Google Scholar]
- 18.Tanzer M, Bobyn JD, Krygier JJ, et al. Histopathologic retrieval analysis of clinically failed porous tantalum osteonecrosis implants. The Journal of bone and joint surgery American. 2008;90:1282–1289. doi: 10.2106/JBJS.F.00847. [DOI] [PubMed] [Google Scholar]
- 19.Kehoe S, Zhang XF, Boyd D. FDA approved guidance conduits and wraps for peripheral nerve injury: A review of materials and efficacy. Injury. 2012;43:553–572. doi: 10.1016/j.injury.2010.12.030. [DOI] [PubMed] [Google Scholar]
- 20.Yeo A, Rai B, Sju E, et al. The degradation profile of novel, bioresorbable PCL-TCP scaffolds: an in vitro and in vivo study. J Biomed Mater Res A. 2008;84:208–218. doi: 10.1002/jbm.a.31454. [DOI] [PubMed] [Google Scholar]
- 21.Lim HC, Bae JH, Song HR, et al. High tibial osteotomy using polycaprolactone-tricalcium phosphate polymer wedge in a micro pig model. J Bone Joint Surg Br. 2011;93:120–125. doi: 10.1302/0301-620X.93B1.24767. [DOI] [PubMed] [Google Scholar]
- 22.Woodruff MA, Hutmacher DW. The return of a forgotten polymer-Pplycaprolactone in the 21st century. Prog Polym Sci. 2010;35:1217–1256. [Google Scholar]
- 23.Shanjani Y, Pan CC, Elomaa L, et al. A novel bioprinting method and system for forming hybrid tissue engineering constructs. Biofabrication. 2015;7:045008. doi: 10.1088/1758-5090/7/4/045008. [DOI] [PubMed] [Google Scholar]
- 24.Shanjani Y, Kang Y, Zarnescu L, et al. Endothelial pattern formation in hybrid constructs of additive manufactured porous rigid scaffolds and cell-laden hydrogels for orthopedic applications. J Mech Behav Biomed Mater. 2017;65:356–372. doi: 10.1016/j.jmbbm.2016.08.037. [DOI] [PubMed] [Google Scholar]
- 25.Yeo M, Simon CG, Kim G. Effects of offset values of solid freeform fabricated PCL–β-TCP scaffolds on mechanical properties and cellular activities in bone tissue regeneration. J Mater Chem. 2012;22:21636. [Google Scholar]
- 26.Yeo A, Wong WJ, Khoo HH, et al. Surface modification of PCL-TCP scaffolds improve interfacial mechanical interlock and enhance early bone formation: an in vitro and in vivo characterization. J Biomed Mater Res A. 2010;92:311–321. doi: 10.1002/jbm.a.32366. [DOI] [PubMed] [Google Scholar]
- 27.Zein I, Hutmacher DW, Tan KC, et al. Fused deposition modeling of novel scaffold architectures for tissue engineering applications. Biomaterials. 2002;23:1169–1185. doi: 10.1016/s0142-9612(01)00232-0. [DOI] [PubMed] [Google Scholar]
- 28.Kawai T, Takemoto M, Fujibayashi S, et al. Osteoconduction of porous Ti metal enhanced by acid and heat treatments. J Mater Sci Mater Med. 2013;24:1707–1715. doi: 10.1007/s10856-013-4919-0. [DOI] [PubMed] [Google Scholar]
- 29.Tanaka M, Takemoto M, Fujibayashi S, et al. Development of a novel calcium phosphate cement composed mainly of calcium sodium phosphate with high osteoconductivity. J Mater Sci Mater Med. 2014;25:1505–1517. doi: 10.1007/s10856-014-5181-9. [DOI] [PubMed] [Google Scholar]
- 30.Yeo A, Wong WJ, Teoh SH. Surface modification of PCL-TCP scaffolds in rabbit calvaria defects: Evaluation of scaffold degradation profile, biomechanical properties and bone healing patterns. J Biomed Mater Res A. 2010;93:1358–1367. doi: 10.1002/jbm.a.32633. [DOI] [PubMed] [Google Scholar]
- 31.Mont MA, Hungerford DS. Non-traumatic avascular necrosis of the femoral head. The Journal of bone and joint surgery American volume. 1995;77:459–474. doi: 10.2106/00004623-199503000-00018. [DOI] [PubMed] [Google Scholar]
- 32.Mont MA, Jones LC, Einhorn TA, et al. Osteonecrosis of the femoral head. Potential treatment with growth and differentiation factors. Clin Orthop Relat Res. 1998;355(Suppl):314–335. [PubMed] [Google Scholar]
- 33.Kim YH, Oh SH, Kim JS, et al. Contemporary Total Hip Arthroplasty with and without Cement in Patients with Osteonecrosis of the Femoral Head. The Journal of bone and joint surgery American. 2003;85:675–681. doi: 10.2106/00004623-200304000-00014. [DOI] [PubMed] [Google Scholar]
- 34.Urbaniak JR, Harvey EJ. Revascularization of the femoral head in osteonecrosis. The Journal of the American Academy of Orthopaedic Surgeons. 1998;6:44–54. doi: 10.5435/00124635-199801000-00005. [DOI] [PubMed] [Google Scholar]
- 35.Amanatullah DF, Strauss EJ, DiCesare PE. Current management options for osteonecrosis of the femoral head: part 1, diagnosis and nonoperative management. Am J Orthop (Belle Mead NJ) 2011;40:E186–192. [PubMed] [Google Scholar]
- 36.Bousson V, Peyrin F, Bergot C, et al. Cortical bone in the human femoral neck: three-dimensional appearance and porosity using synchrotron radiation. J Bone Miner Res. 2004;19:794–801. doi: 10.1359/JBMR.040124. [DOI] [PubMed] [Google Scholar]
- 37.Chappard C, Bensalah S, Olivier C, et al. 3D characterization of pores in the cortical bone of human femur in the elderly at different locations as determined by synchrotron micro-computed tomography images. Osteoporos Int. 2013;24:1023–1033. doi: 10.1007/s00198-012-2044-4. [DOI] [PubMed] [Google Scholar]
- 38.Chen H, Zhou X, Shoumura S, et al. Age- and gender-dependent changes in three-dimensional microstructure of cortical and trabecular bone at the human femoral neck. Osteoporos Int. 2010;21:627–636. doi: 10.1007/s00198-009-0993-z. [DOI] [PubMed] [Google Scholar]
- 39.Mayhew PM, Thomas CD, Clement JG, et al. Relation between age, femoral neck cortical stability, and hip fracture risk. Lancet. 2005;366:129–135. doi: 10.1016/S0140-6736(05)66870-5. [DOI] [PubMed] [Google Scholar]
- 40.Doblare M, Garcia JM. On the modelling bone tissue fracture and healing of the bone tissue. Acta Cient Venez. 2003;54:58–75. [PubMed] [Google Scholar]
- 41.Schoenfeld CM, Lautenschlager EP, Meyer PR., Jr Mechanical properties of human cancellous bone in the femoral head. Med Biol Eng. 1974;12:313–317. doi: 10.1007/BF02477797. [DOI] [PubMed] [Google Scholar]
- 42.Martens M, Van Audekercke R, Delport P, et al. The mechanical characteristics of cancellous bone at the upper femoral region. J Biomech. 1983;16:971–983. doi: 10.1016/0021-9290(83)90098-2. [DOI] [PubMed] [Google Scholar]
- 43.Misch CE, Qu Z, Bidez MW. Mechanical properties of trabecular bone in the human mandible: implications for dental implant treatment planning and surgical placement. J Oral Maxillofac Surg. 1999;57:700–706. doi: 10.1016/s0278-2391(99)90437-8. discussion 706-708. [DOI] [PubMed] [Google Scholar]
- 44.YH An. Mechanical Properties of Bone. In: An YH, Draughn RA, editors. Mechanical Testing of Bone and the Bone-Implant Interface. Boca Raton, Florida: CRC Press; 2000. pp. 50–51. [Google Scholar]
- 45.Lei Y, Rai B, Ho KH, et al. In vitro degradation of novel bioactive polycaprolactone - 20% tricalcium phosphate composite scaffolds for bone engineering. Mater Sci Eng C. 2007;27:293–298. [Google Scholar]
- 46.Li Y, Wu ZG, Li XK, et al. A polycaprolactone-tricalcium phosphate composite scaffold as an autograft-free spinal fusion cage in a sheep model. Biomaterials. 2014;35:5647–5659. doi: 10.1016/j.biomaterials.2014.03.075. [DOI] [PubMed] [Google Scholar]
- 47.Abbah SA, Lam CX, Ramruttun AK, et al. Fusion performance of low-dose recombinant human bone morphogenetic protein 2 and bone marrow-derived multipotent stromal cells in biodegradable scaffolds: a comparative study in a large animal model of anterior lumbar interbody fusion. Spine (Phila Pa 1976) 2011;36:1752–1759. doi: 10.1097/BRS.0b013e31822576a4. [DOI] [PubMed] [Google Scholar]