

Abstract
Objectives
To assess the validity of BMI and age- and sex-standardized BMI z-score (BMIZ) as surrogates for adiposity [body fat percentage (BF%), fat mass, and fat mass index (FMI, kg/m2)] at three time points in infancy (1, 4, and 7 months), and to assess the extent to which change in BMIZ represents change in adiposity.
Study design
We performed a secondary analysis of 447 full-term infants in a previous trial of maternal vitamin D supplementation during lactation. Study staff measured infant anthropometrics and assessed body composition with dual-energy x-ray absorptiometry at 1, 4, and 7 months. We calculated Spearman correlations (rs) among BMI, BMIZ, and adiposity at each time point, and between change in BMIZ and change in adiposity between time points.
Results
Infants (N=447) were 52% male; 37% white, 31% black, 30% Hispanic. BMIZ was moderately correlated with BF% (rs=0.43, 0.55, 0.48 at 1, 4, and 7 months respectively). BMIZ correlated more strongly with fat mass and FMI, particularly at 4 and 7 months (fat mass rs=0.72–0.76; FMI rs=0.75–0.79). Changes in BMIZ were moderately correlated with adiposity changes from 1–4 months (rs=0.44 with BF% change; rs=0.53 with fat mass change), but only weakly correlated from 4–7 months (rs=0.21 with BF% change; rs=0.27 with fat mass change).
Conclusions
BMIZ is moderately correlated with adiposity in infancy. Changes in BMIZ are a poor indicator of adiposity changes in later infancy. BMI and BMIZ are limited as surrogates for adiposity and especially adiposity changes in infancy.
Keywords: body composition, infant
Anthropometric measures of body proportionality are widely used in research and clinical practice as surrogates for body composition. In particular, body mass index (BMI, kg/m2) is often used as a proxy for adiposity, based on high correlations (correlation coefficients of 0.79–0.92) between BMI and directly measured adiposity in adults (1), adolescents (2,3), and school-aged children (2–5). In infants, BMI and other indices of body proportionality such as weight-for-length (WFL, kg) have similarly been interpreted as surrogates for adiposity, with higher BMI or WFL measurements interpreted as reflecting higher adiposity (6–11).
BMI in infancy is predictive of subsequent obesity, with higher peak BMI, rapid increases in BMI, and BMI z-score (BMIZ) values above the 85th percentile all associated with obesity in early childhood or adulthood (10,12–15). However, the extent to which BMI, BMIZ, and their changes over time accurately reflect adiposity gains in infancy is poorly understood.
Although a few prior studies have examined associations between BMI or BMIZ and adiposity in infancy, most were limited by small sample sizes (<70 infants) (18–20), limitation to a single ethnic group (21), or methods of body composition assessment (such as isotope dilution or total body electrical conductivity) (18–20,22,23) that are potentially less accurate than newer methods such as dual-energy x-ray absorptiometry (DXA) (24,25). One recent study, using air displacement plethysmography, overcomes most of those limitations, but only assessed infants at 2 time points and only followed infants to 5 months (27). Therefore, we analyzed the associations of BMI and BMIZ, and their changes over time, with adiposity in a large, racially diverse cohort of healthy infants during the first 7 months of life.
METHODS
This study was conducted as a secondary analysis of data collected during a previously completed study of maternal vitamin D supplementation (28). Mother-infant dyads were recruited from the newborn nursery at the Medical University of South Carolina in Charleston, South Carolina or Rochester General Hospital in Rochester, New York, as well as from local community hospitals in Charleston and Rochester, between January 2007 and December 2011. Eligibility criteria included healthy singleton infant born at ≥35 weeks gestational age, age of infant at enrollment <6 weeks, and mother planning to exclusively breastfeed or exclusively formula feed for 6 months. Mothers were excluded if they had pre-existing type 1 or 2 diabetes mellitus, hypertension, parathyroid disease, uncontrolled thyroid disease, hypocalcemia, hypercalcemia, or were taking diuretics or cardiac medications. Infants were excluded if they had an inborn error of metabolism, congenital anomalies, or admission to the neonatal intensive care unit lasting >72 hrs. Eligibility criteria for this secondary analysis included any infant with at least one visit with both anthropometric data and body composition measurement. Of the 460 infants enrolled in the original study, 447 (97%) were included in the analysis; 13 were excluded because they had no DXA measurements performed.
Birthweight was obtained from the infants’ medical records. Subsequent weights and lengths were measured monthly by trained study staff. At each study visit, infants were weighed on a standard infant scale (Scale-Tronix, Inc, Wheaton, IL) to the nearest gram and length was measured to the nearest 0.1 cm on either a vinyl or plexiglass infant length board (Perspective Enterprises, Portage, MI) by the two-person technique. BMI was calculated using the standard formula: weight/length2 (kg/m2). Birthweight z-scores were determined from the 2010 Olsen growth charts accounting for gestational age and sex (29). Z-scores were computed for weight, length, BMI, and WFL at 1, 4, and 7 months using the World Health Organization growth standards via the macro ‘WHO Child Growth Standards SPSS Syntax File (igrowup.sps)’ (World Health Organization, Geneva, Switzerland, 2005).
At 1, 4, and 7 months, infants underwent whole body dual-energy radiograph absorptiometry using a Hologic Discovery A (Hologic, Inc, Waltham, MA) with the Hologic infant whole-body software (version 12.7.3:3). Both study sites used a Hologic Discovery A and a spine phantom standard was sent to each site twice during the study period for cross-calibration of the scanners; 20 scans were performed at each site on the phantom, with correlation 0.998 and no statistically significant differences in body composition of the phantom as measured by the two different scanners. A standard procedure was followed to limit infant movement and only scans without motion artifact were used. DXA is safe (radiation exposure equivalent to about 1 day’s exposure to background radiation), as accurate as more sophisticated methods for measuring infant body composition such as magnetic resonance imaging (30), and is superior to anthropometric measures such as skinfold thicknesses (25).
We obtained 2 measures of adiposity—body fat percentage (BF%) and fat mass (in kg)—from each scan. We then calculated a third measure of adiposity, fat mass index (FMI), from the standard formula: fat mass/length2 (kg/m2), using the length measured by study staff. BF% is the most commonly used measure of adiposity in research (31), but has been criticized as a poor measure of adiposity because it is affected by changes in lean mass even if fat mass does not change (31,32). Measuring fat mass alone does not account for proportionality of the fat mass for body size, whereas the FMI adjusts for the patient’s height or length (31,32). It is unknown which measure of adiposity is most predictive of subsequent health outcomes; therefore, we examined all three measures. Lean mass (in kg) also was obtained directly from each scan and used to calculate the lean mass index (LMI) using the formula: lean mass/length2 (kg/m2).
The trial from which these data were obtained was approved by the Institutional Review Boards of the Medical University of South Carolina (#16536) and the University of Rochester (#14460) and was registered via clinicaltrials.gov (NCT00412074). Parents of infants who participated in the study provided informed consent. This secondary analysis of de-identified data was classified as exempt by the Institutional Review Board of Brigham and Women’s Hospital.
Statistical Analyses
Using the DXA-derived adiposity measures as the gold standard for adiposity, we calculated correlation coefficients to examine the extent to which anthropometric measurements were correlated with adiposity at each time point. We chose Spearman (rs) rather than Pearson correlation coefficients because they do not assume normality of data or a linear relationship between the measurements. To evaluate whether changes in BMI and BMIZ were associated with changes in adiposity, we calculated Spearman correlation coefficients between pairs of changes in anthropometric measurements and concurrent changes in body composition. Pearson correlations were almost identical to Spearman correlations (data not shown).
We used stratification to assess for differences in correlations among racial/ethnic groups, between sexes, and by feeding type (breastmilk or formula feeding). We used the method of Zou (33) to assess for significant differences between correlated correlation coefficients with a variable in common (such as whether BMI is more strongly correlated with fat mass than lean mass). To compare the correlation between 2 given variables across subsamples (such as whether correlations differ between males and females), we applied the Fisher z-transformation (tanh−1r) and performed an asymptotic z-test (for 2 groups) or chi-squared test (for 3 groups), using the sample-specific standard errors ((n–3)−½). Significance was set at P = .05.
Our primary focus was to examine associations of BMI, rather than other possible indices of body proportionality such as WFL or ponderal index (kg/m3), with DXA-assessed adiposity because BMI has been shown to correlate with adiposity more strongly than ponderal index does in infants (21). Further, BMIZ changes are more strongly correlated than WFLZ with body fat changes in infancy (27), and BMIZ is more strongly predictive of early childhood obesity than WFLZ (13). Although the CDC recommends the use of WFLZ until 24 months of age (34) in part due to the inaccuracy of clinical length measurements in infants, BMI has recently been recommended over WFL for monitoring body proportionality in infancy (13) and is commonly used in clinical practice (35). For completeness, we explored WFL and WFLZ in addition to BMI and present those results as well. A secondary focus was on the relationship between anthropometrics and measures of lean mass.
Statistical analysis was performed using IBM SPSS Statistics software version 22.0 (IBM Corp, Armonk, New York) and SAS software version 9.4 (SAS Institute Inc, Cary, North Carolina).
RESULTS
The 447 infants were 38% Caucasian, 31% African-American, 29% Hispanic, and 2% Asian; 52% were male (Table 1). Of the included infants, DXA and anthropometric data were available for 437 infants (98%) at 1 month of age (mean ± standard deviation of exact age at visit: 36 ± 7 days), 331 infants (74%) at 4 months of age (125 ± 7 days), and 277 infants (62%) at 7 months of age (214 ± 10 days) (Figure 1; available at www.jpeds.com). Infants who dropped out of the study before the last visit had lower birth weights (3254g vs. 3405g, p=0.001), were more likely to be African-American or Hispanic than Caucasian (78% vs. 50%, p<0.001), and had less educated mothers (18% vs 43% with college degree, p<0.001), but no significant difference in maternal BMI (median 27.8 vs. 26.1, p=0.07), compared with infants who completed the study.
Table 1.
Participant characteristics.
| Characteristic* | Birth N=447 | 1 month old N=437 | 4 months old N=331 | 7 months old N=277 |
|---|---|---|---|---|
| Age (days) | 36.5 ± 7.7 | 125.6 ± 7.7 | 214.4 ± 10.3 | |
| Weight (g) | 3347 ± 475 | 4503 ± 633 | 6707 ± 915 | 8002 ± 1080 |
| Weight Z-score | −0.04 ± 0.86 | −0.13 ± 0.94 | −0.18 ± 1.07 | −0.06 ± 1.09 |
| Length (cm) | 54.4 ± 2.6 | 62.8 ± 2.4 | 67.6 ± 2.5 | |
| Length Z-score | −0.30 ± 1.16 | −0.28 ± 1.07 | −0.33 ± 1.05 | |
| BMI (kg/m2) | 15.2 ± 1.4 | 17.0 ± 1.9 | 17.5 ± 1.8 | |
| BMI Z-score | 0.04 ± 0.97 | −0.04 ± 1.22 | 0.18 ± 1.18 | |
| DXA fat mass (g) | 1223 ± 440 | 2525 ± 731 | 2948 ± 872 | |
| DXA lean mass (g) | 3647 ± 457 | 4546 ± 624 | 5392 ± 776 | |
| DXA body fat percentage (%) | 24.7 ± 7.2 | 35.3 ± 7.5 | 35.0 ± 7.7 | |
| Fat mass index (kg/m2) | 4.1 ± 1.3 | 6.4 ± 1.8 | 6.4 ± 1.8 | |
| Fat-free mass index (kg/m2) | 12.3 ± 1.4 | 11.5 ± 1.5 | 11.8 ± 1.6 |
Data are displayed as mean ± standard deviation.
Figure 1.
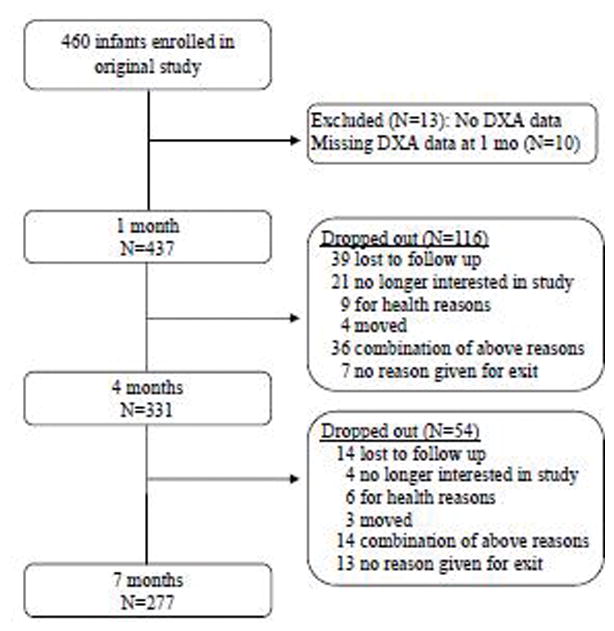
Participant flow diagram.
Table 2 shows Spearman correlations among anthropometric variables and body composition at each time point. BMIZ was moderately correlated with body fat percentage at each time point (rs=0.43, 0.55, and 0.48 respectively). BMIZ was more strongly correlated (p<0.001 for each comparison) with fat mass and FMI than with BF% at all time points (rs= 0.43, 0.55, 0.48 for BF%; for fat mass and FMI, rs= 0.56–0.61, 0.76–0.79, and 0.72–0.75 at 1, 4, and 7 months respectively). Correlations of anthropometrics with adiposity were lowest at 1 month for all adiposity measures, such that the correlation of BMIZ and adiposity was significantly stronger at 4 and 7 months than at 1 month (p=0.03 for BF%; p<0.001 for fat mass and FMI). At the individual level, a wide range of adiposity was associated with a given BMIZ (Figure 2). For example, a 1 month old infant with BMIZ of zero could have a BF% ranging from 9% to 39%.
Table 2.
Correlations among anthropometric measurements and body composition measurements in 447 full term infants aged 1–7 months.*
| BMIZ | WFLZ | BF% | Fat mass | FMI | Lean mass | LMI | |
|---|---|---|---|---|---|---|---|
| BMI | |||||||
| 1 mo | 0.94 | 0.81 | 0.47 | 0.63 | 0.66 | 0.40 | 0.31 |
| 4 mo | 0.99 | 0.98 | 0.52 | 0.74 | 0.76 | 0.33 | 0.31 |
| 7 mo | 0.99 | 0.99 | 0.44 | 0.70 | 0.72 | 0.35 | 0.32 |
| BMIZ | |||||||
| 1 mo | - | 0.85 | 0.43 | 0.56 | 0.61 | 0.32 | 0.34 |
| 4 mo | - | 0.99 | 0.55 | 0.76 | 0.79 | 0.28 | 0.28 |
| 7 mo | - | 0.99 | 0.48 | 0.72 | 0.75 | 0.30 | 0.29 |
| WFLZ | |||||||
| 1 mo | - | 0.25 | 0.31 | 0.44 | 0.14 | 0.47 | |
| 4 mo | - | 0.52 | 0.71 | 0.77 | 0.25 | 0.32 | |
| 7 mo | - | 0.49 | 0.72 | 0.75 | 0.29 | 0.28 | |
| BF% | |||||||
| 1 mo | - | 0.95 | 0.96 | −0.26 | −0.53 | ||
| 4 mo | - | 0.91 | 0.91 | −0.45 | −0.54 | ||
| 7 mo | - | 0.91 | 0.92 | −0.49 | −0.60 | ||
| Fat mass | |||||||
| 1 mo | - | 0.97 | 0.03NS | −0.33 | |||
| 4 mo | - | 0.97 | −0.07NS | −0.23 | |||
| 7 mo | - | 0.96 | −0.11NS | −0.30 | |||
| FMI | |||||||
| 1 mo | - | −0.08NS | −0.28 | ||||
| 4 mo | - | −0.15 | −0.18 | ||||
| 7 mo | - | −0.22 | −0.27 | ||||
| Lean mass | |||||||
| 1 mo | - | 0.68 | |||||
| 4 mo | - | 0.83 | |||||
| 7 mo | - | 0.84 |
Values shown are Spearman correlation coefficients.
BF%, body fat percentage; BMIZ, BMI z-score; FMI, fat mass index; LMI, lean mass index; WFLZ, weight-for-length z-score. N=437 at 1 month, 331 at 4 months, and 277 at 7 months.
Denotes the correlation is not statistically significant (p>0.05). All other correlations without this superscript are statistically significant with p<0.01.
Figure 2.
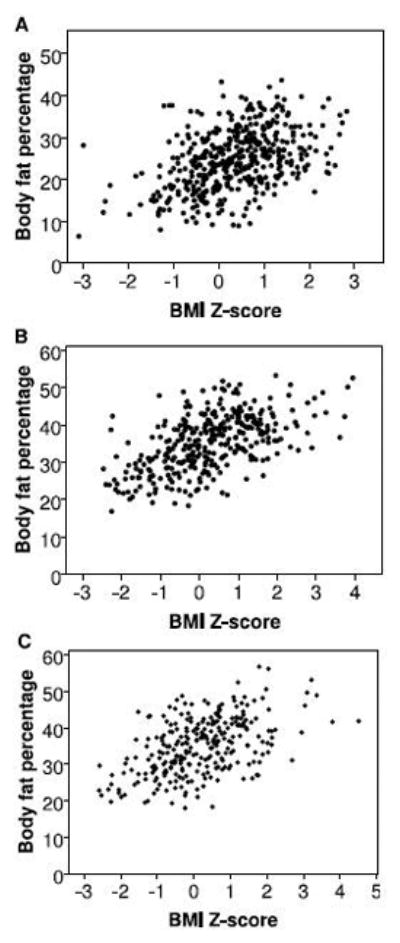
Scatterplots of body fat percentage and BMI z-score in full term infants at 1 month (panel A; N=437), 4 months (panel B; N=331), and 7 months (panel C; N=277).
In addition to being correlated with adiposity, BMIZ was also positively correlated with lean mass (rs=0.32, 0.28, and 0.30) and LMI (rs=0.34, 0.28, and 0.29) at 1, 4, and 7 months respectively, with similar correlations for BMI (Table 2). Correlations of BMIZ with lean mass and LMI were significantly lower than with fat mass or FMI at each time point (p<0.001 for each comparison).
All 3 measures of adiposity were more strongly correlated with BMIZ than with WFLZ at 1 month and 4 months (p≤0.001 for each comparison). At 7 months, adiposity correlated similarly with BMIZ and WFLZ (p>0.2 for each comparison; Table 2).
Stratification by sex, race/ethnicity, infant feeding type (predominantly breastfed or exclusively formula fed), or maternal feeding intention did not alter correlations of anthropometric with adiposity measures (data available upon request). However, stratification reduced the power of these analyses.
Changes in BMIZ were moderately correlated with changes in adiposity from 1–4 months (rs=0.44 with BF%; rs=0.53 with fat mass; rs=0.62 with FMI). In contrast, from 4–7 months, changes in BMIZ were only weakly correlated with changes in body fat percentage (rs=0.21) and fat mass (rs=0.27), and moderately correlated with fat mass index (rs=0.49) (Table 3).
Table 3.
Correlations between concurrent changes in anthropometrics and changes in body composition for 323 full term infants aged 1–7 months.*
| ΔBMIZ | ΔWFLZ | ΔBF% | Δfat mass | ΔFMI | Δlean mass | ΔLMI | |
|---|---|---|---|---|---|---|---|
| ΔBMI | |||||||
| 1–4 mo | 0.96 | 0.85 | 0.50 | 0.62 | 0.71 | 0.14 | 0.21 |
| 4–7 mo | 0.99 | 0.96 | 0.22 | 0.28 | 0.53 | 0.12 | 0.23 |
| ΔBMIZ | |||||||
| 1–4 mo | - | 0.88 | 0.44 | 0.53 | 0.62 | 0.06NS | 0.19 |
| 4–7 mo | - | 0.97 | 0.21 | 0.27 | 0.49 | 0.14 | 0.39 |
| ΔWFLZ | |||||||
| 1–4 mo | - | 0.36 | 0.48 | 0.53 | −0.01NS | 0.23 | |
| 4–7 mo | - | 0.19 | 0.25 | 0.47 | 0.15 | 0.40 | |
| ΔBF% | |||||||
| 1–4 mo | - | 0.90 | 0.94 | −0.33 | −0.56 | ||
| 4–7 mo | - | 0.92 | 0.90 | −0.66 | −0.68 | ||
| Δfat mass | |||||||
| 1–4 mo | - | 0.95 | −0.22 | −0.45 | |||
| 4–7 mo | - | 0.91 | −0.44 | −0.53 | |||
| ΔFMI | |||||||
| 1–4 mo | - | −0.20 | −0.36 | ||||
| 4–7 mo | - | −0.46 | −0.36 | ||||
| Δlean mass | |||||||
| 1–4 mo | - | 0.63 | |||||
| 4–7 mo | - | 0.80 |
Values shown are Spearman correlation coefficients. N=323 from 1–4 months; N=275 from 4–7 months.
BF%, body fat percentage; BMIZ, BMI z-score; FMI, fat mass index; LMI, lean mass index; WFLZ, weight-for-length z-score; Δ, change.
Denotes correlation is not statistically significant (p>0.05). All other correlations are significant with p<0.05.
Changes in BMI and BMIZ between 1–4 months were more strongly correlated with changes in BF%, fat mass, and FMI than they were with lean mass or lean mass index (p<0.001 for all comparisons). However, from 4–7 months, changes in BMI or BMIZ correlated equally well with changes in adiposity as with changes in lean mass or LMI (p=0.10–0.19 for each comparison), except that changes in FMI were significantly more strongly correlated than for LMI (rs=0.53 vs 0.23; p=0.004).
Changes in adiposity (BF%, fat mass, and FMI) were more strongly correlated with changes in BMIZ than with changes in WFLZ during each period (Table 3). But, the difference was only statistically significant for changes between 1–4 months in BF% (p=0.002; rs=0.44 with BMIZ, rs=0.36 with WFLZ) and FMI (p<0.001; rs=0.62 with BMIZ, rs=0.53 with WFLZ).
DISCUSSION
The moderate correlations we observed between infant BMI or BMIZ and adiposity (rs=0.43–0.55) contrast with high correlations of BMI and DXA-derived adiposity measures in older children. For BF%, correlation coefficients in school age children and adolescents range from r=0.79–0.92 (2,3,5) although a correlation as low as r=0.63 was reported in one study (4). Similarly, among school age children, correlations are high between BMI and DXA-derived fat mass (r=0.83–0.95) or FMI (r=0.80) (3–5). Although we found relatively strong correlations of BMI with both fat mass and FMI (rs=0.72–0.79) at 4 and 7 months, and moderate correlations (rs=0.56–0.66) at 1 month, these were low relative to previously published studies of older children (2–5). Technical limitations of performing DXA on infants, such as motion artifact, can limit its accuracy (25) and could theoretically contribute to the lower correlations we observed; however, the moderate correlations we observed between BMI or BMIZ and DXA-derived adiposity are consistent with the few prior studies conducted in infants, which used different techniques to measure body composition. De Cunto et al showed BMIZ was moderately correlated (r=0.65) with BF% at birth as measured by air displacement plethysmography (21), and de Bruin et al found a similarly moderate correlation (R2=0.44, corresponding to r=0.66) between BMI and BF% using total body electrical conductivity in a grouped sample of infants aged 1–12 months (23). Our findings, taken together with prior studies, suggest that during infancy, BMI and BMIZ are limited as surrogate markers of adiposity.
We showed that prospective changes in BMI were moderately associated with changes in DXA-measured adiposity between 1 and 4 months of life and were more strongly correlated with fat mass gains than lean mass gains. Conversely, between 4 and 7 months, correlations between BMI changes and adiposity changes were weak, and although correlations were generally higher for fat gains than for lean mass gains, the difference was not statistically significant. This discrepancy is likely partly attributable to the typical growth pattern in infancy, in which infants experience a rapid accrual of fat during the first several months of life followed by a period of relatively slower fat mass accrual and relatively larger changes in lean mass (18,36).
BMI and BMIZ trajectories are often interpreted as surrogates for changes in adiposity (10,13,14). However, the associations between changes in anthropometrics and concurrent changes in adiposity have rarely been studied in infancy. One study performed over 20 years ago found that weight z-score changes from birth to 12 weeks were positively correlated with both FMI z-score and lean mass index z-score at 12 weeks, but did not compare associations between FMI and LMI, and did not assess changes beyond 12 weeks (22). A recent large study of >1000 infants showed a positive association between changes in BMIZ and changes in BF% from birth to 5 months of age (27), similar to the positive association we found from 1–4 months. We extend their findings by showing that BMIZ changes occurring later in infancy, from 4–7 months, are no longer correlated with adiposity changes. Overall, our study suggests that BMI and BMIZ trajectories may not be accurate surrogates for infant adiposity gains, particularly in later infancy.
Accurate identification of excess adiposity in infancy is important in the context of the rising prevalence of obesity in childhood and the well-established contribution of early infant weight gain to later-life risk of obesity and its associated complications (12–14,37). Public health efforts aimed at obesity prevention increasingly target early childhood populations, extending even into infancy (13,38,39). For example, changing infant feeding practices by reducing the protein content in formula (40), increasing breastfeeding rates (41), and delaying solid food introduction (38), along with behavioral interventions for parents to address infant sleeping and crying (38), have all been tested as possible interventions to reduce childhood obesity.
Most studies of obesity risk have examined infant weight or BMI gain without assessing body composition (6,10–13), although one small study suggests that rapid gain in fat mass in early infancy is a better predictor of subsequent excess adiposity in childhood than weight gain alone (16). Clinicians and researchers engaged in efforts to reduce infant weight gain as a means of preventing subsequent obesity need accurate methods of identifying adiposity in order to best identify and intervene for infants at high risk of developing adiposity-related complications later in childhood and adulthood.
Our finding that infant BMI or BMI gain do not accurately represent adiposity or adiposity gain is important in the context of several studies linking early rapid BMI gain with later obesity (10,12–15). These studies interpreted BMI gain as a surrogate for excess accrual of adipose tissue in early life, predisposing the infant to subsequent excess adiposity (16,17). Our results suggest that this interpretation may not be correct. Instead, the link between rapid BMI gain in infancy and later obesity may involve changes in lean mass or a combination of lean and adipose tissue (43,44). Studies incorporating directly measured infant body composition are needed to establish the extent to which rapid fat and/or lean mass gain during infancy explains this association.
The use of DXA for body composition measurement in infants has several limitations, including dependence of the results on type of scanner and software, sensitivity to motion artifacts, and overestimates of fat mass compared with other body composition techniques (including ADP and the 4-compartment model) (25). To minimize these limitations, we used the same DXA model and software throughout the study and only used scans free from motion artifact. The racial/ethnic diversity of our sample and recent time course of the study increase its generalizability over most prior studies that were conducted over two decades ago in racially and ethnically homogenous populations. However, the proportionately greater dropout of infants from racial/ethnic minorities and lower socioeconomic status may limit generalizability of the findings in later infancy. Also, our finding may not be generalizable to infants in resource-poor settings, where correlations between infant growth and adiposity differ from those in industrialized countries (46) .
BMI and BMIZ are moderately correlated with adiposity in infancy, as compared with high correlations in older children and adults. An increasing BMI or BMIZ is a poor indicator of increasing adiposity in later infancy. Therefore, measurement of BMI and BMIZ may not be sufficient for accurate assessment of adiposity or adiposity changes in infancy.
Acknowledgments
We thank Dr Cynthia R. Howard and Dr Ruth A. Lawrence at the University of Rochester, and Dr Bruce W. Hollis at the Medical University of South Carolina Children’s Hospital, for their contributions to the original trial from which this secondary analysis was performed. We also thank Myla Ebeling and Judith Shary at the Medical University of South Carolina for their assistance with database management.
Funding for the initial trial was provided by the National Institutes of Health (NIH) 5R01HD043921, NIH RR01070, Medical University of South Carolina Department of Pediatrics, and the South Carolina Clinical & Translational Research Institute, NIH/National Center for Advancing Translational Sciences grant UL1 TR000062. H.F. receives research support from the Boston Children’s Hospital Clinical Research Center. The authors declare no conflicts of interest.
ABBREVIATIONS
- ADP
air displacement plethysmography
- BF%
body fat percentage
- BMI
body mass index
- BMIZ
body mass index z-score
- DXA
dual-energy x-ray absorptiometry
- FMI
fat mass index
- LMI
lean mass index
- WFL
weight-for-length
- WFLZ
weight for length z-score
Footnotes
Trial Registration: ClinicalTrials.gov NCT00412074
Portions of this study were presented as an oral abstract at the Pediatric Academic Societies annual meeting, May 6–9, 2017, San Francisco, California.
Publisher's Disclaimer: This is a PDF file of an unedited manuscript that has been accepted for publication. As a service to our customers we are providing this early version of the manuscript. The manuscript will undergo copyediting, typesetting, and review of the resulting proof before it is published in its final citable form. Please note that during the production process errors may be discovered which could affect the content, and all legal disclaimers that apply to the journal pertain.
Contributor Information
Katherine A Bell, Brigham & Women’s Hospital, Department of Pediatric Newborn Medicine.
Carol L Wagner, Medical University of South Carolina, Department of Pediatrics.
Wei Perng, University of Michigan School of Public Health, Departments of Nutritional Sciences and Epidemiology.
Henry A Feldman, Boston Children’s Hospital, Clinical Research Center.
Roman J Shypailo, Baylor College of Medicine, USDA/ARS Children's Nutrition Research Center.
Mandy B Belfort, Brigham & Women’s Hospital, Department of Pediatric Newborn Medicine.
References
- 1.Sun Q, van Dam RM, Spiegelman D, Heymsfield SB, Willett WC, Hu FB. Comparison of dual-energy x-ray absorptiometric and anthropometric measures of adiposity in relation to adiposity-related biologic factors. Am J Epidemiol. 2010 Dec 3;172(12):1442–54. doi: 10.1093/aje/kwq306. [DOI] [PMC free article] [PubMed] [Google Scholar]
- 2.Freedman DS, Wang J, Ogden CL, Thornton JC, Mei Z, Pierson RN, et al. The prediction of body fatness by BMI and skinfold thicknesses among children and adolescents. Ann Hum Biol. 2007 Jan 1;34(2):183–94. doi: 10.1080/03014460601116860. [DOI] [PubMed] [Google Scholar]
- 3.Pietrobelli A, Faith MS, Allison DB, Gallagher D, Chiumello G, Heymsfield SB. Body mass index as a measure of adiposity among children and adolescents: a validation study. The Journal of pediatrics. 1998 Mar;132(2):204–10. doi: 10.1016/s0022-3476(98)70433-0. [DOI] [PubMed] [Google Scholar]
- 4.Boeke CE, Oken E, Kleinman KP, Rifas-Shiman SL, Taveras EM, Gillman MW. Correlations among adiposity measures in school-aged children. BMC Pediatr. 2013 Jun 1;13:99. doi: 10.1186/1471-2431-13-99. [DOI] [PMC free article] [PubMed] [Google Scholar]
- 5.Dencker M, Thorsson O, Lindén C, Wollmer P, Andersen LB, Karlsson MK. BMI and objectively measured body fat and body fat distribution in prepubertal children. Clinical physiology and functional imaging. 2007 Feb 4;27(1):12–6. doi: 10.1111/j.1475-097X.2007.00709.x. [DOI] [PubMed] [Google Scholar]
- 6.Belfort MB, Gillman MW, Buka SL, Casey PH, McCormick MC. Preterm infant linear growth and adiposity gain: trade-offs for later weight status and intelligence quotient. J Pediatr. 2013 Dec;163(6):1564–1569. e2. doi: 10.1016/j.jpeds.2013.06.032. [DOI] [PMC free article] [PubMed] [Google Scholar]
- 7.Dewey KG, Heinig MJ, Nommsen LA, Peerson JM, Lönnerdal B. Breast-fed infants are leaner than formula-fed infants at 1 y of age: the DARLING study. Am J Clin Nutr. 1993 Feb ;57(2):140–5. doi: 10.1093/ajcn/57.2.140. [DOI] [PubMed] [Google Scholar]
- 8.Dewey KG, Heinig MJ, Nommsen LA, Peerson JM, Lönnerdal B. Growth of breast-fed and formula-fed infants from 0 to 18 months: the DARLING Study. Pediatrics. 1992 Jun 1;89(6 Pt 1):1035–41. [PubMed] [Google Scholar]
- 9.Dixon WE, Dalton WT, Berry SM, Carroll VA. Improving the accuracy of weight status assessment in infancy research. Infant Behav Dev. 2014 Aug 5;37(3):428–34. doi: 10.1016/j.infbeh.2014.06.001. [DOI] [PubMed] [Google Scholar]
- 10.Roy SM, Chesi A, Mentch F, Xiao R, Chiavacci R, Mitchell JA, et al. Body mass index (BMI) trajectories in infancy differ by population ancestry and may presage disparities in early childhood obesity. J Clin Endocrinol Metab. 2015 Apr 3;100(4):1551–60. doi: 10.1210/jc.2014-4028. [DOI] [PMC free article] [PubMed] [Google Scholar]
- 11.Taveras EM, Rifas-Shiman SL, Belfort MB, Kleinman KP, Oken E, Gillman MW. Weight status in the first 6 months of life and obesity at 3 years of age. Pediatrics. 2009 Apr 3;123(4):1177–83. doi: 10.1542/peds.2008-1149. [DOI] [PMC free article] [PubMed] [Google Scholar]
- 12.Gittner LS, Ludington-Hoe SM, Haller HS. Utilising infant growth to predict obesity status at 5 years. J Paediatr Child Health. 2013 Jul 1;49(7):564–74. doi: 10.1111/jpc.12283. [DOI] [PubMed] [Google Scholar]
- 13.Roy SM, Spivack JG, Faith MS, Chesi A, Mitchell JA, Kelly A, et al. Infant BMI or Weight-for-Length and Obesity Risk in Early Childhood. Pediatrics. 2016 May;137(5) doi: 10.1542/peds.2015-3492. [DOI] [PMC free article] [PubMed] [Google Scholar]
- 14.Slining MM, Herring AH, Popkin BM, Mayer-Davis EJ, Adair LS. Infant BMI trajectories are associated with young adult body composition. J Dev Orig Health Dis. 2013 Feb 5;4(1):56–68. doi: 10.1017/S2040174412000554. [DOI] [PMC free article] [PubMed] [Google Scholar]
- 15.Perng W, Hajj H, Belfort MB, Rifas-Shiman SL, Kramer MS, Gillman MW, et al. Birth Size, Early Life Weight Gain, and Midchildhood Cardiometabolic Health. J Pediatr. 2016 Jun 3;173:122–130. e1. doi: 10.1016/j.jpeds.2016.02.053. [DOI] [PMC free article] [PubMed] [Google Scholar]
- 16.Koontz MB, Gunzler DD, Presley L, Catalano PM. Longitudinal changes in infant body composition: association with childhood obesity. Pediatr Obes. 2014 Dec 1;9(6):e141–4. doi: 10.1111/ijpo.253. [DOI] [PMC free article] [PubMed] [Google Scholar]
- 17.Pirilä S, Saarinen-Pihkala UM, Viljakainen H, Turanlahti M, Kajosaari M, Mäkitie O, et al. Breastfeeding and determinants of adult body composition: a prospective study from birth to young adulthood. Horm Res Paediatr. 2012 Jan;77(5):281–90. doi: 10.1159/000338334. [DOI] [PubMed] [Google Scholar]
- 18.Wells A Hattori chart analysis of body mass index in infants and children. Int J Obes Relat Metabolic Disord J Int Assoc Study Obes nature. 2000;24(3):325–9. doi: 10.1038/sj.ijo.0801132. [DOI] [PubMed] [Google Scholar]
- 19.Davies, Lucas Quetelet’s index as a measure of body fatness in young infants. Early Hum Dev sciencedirect. 1989;20(2):135–41. doi: 10.1016/0378-3782(89)90054-6. [DOI] [PubMed] [Google Scholar]
- 20.Escribano J, Luque V, Ferre N, Mendez-Riera G, Koletzko B, Grote V, et al. Effect of protein intake and weight gain velocity on body fat mass at 6 months of age: the EU Childhood Obesity Programme. Int J Obes (Lond) 2012 Apr;36(4):548–53. doi: 10.1038/ijo.2011.276. [DOI] [PubMed] [Google Scholar]
- 21.De Cunto A, Paviotti G, Ronfani L, Travan L, Bua J, Cont G, et al. Can body mass index accurately predict adiposity in newborns? Arch Dis Child Fetal Neonatal Ed. 2014 May 4;99(3):F238–9. doi: 10.1136/archdischild-2013-305386. [DOI] [PubMed] [Google Scholar]
- 22.Chomtho S, Wells JC, Davies PS, Lucas A, Fewtrell MS. Early growth and body composition in infancy. Adv Exp Med Biol. 2009 Jan 4;646:165–8. doi: 10.1007/978-1-4020-9173-5_19. [DOI] [PubMed] [Google Scholar]
- 23.de Bruin NC, van Velthoven KA, Stijnen T, Juttmann RE, Degenhart HJ, Visser HK. Body fat and fat-free mass in infants: new and classic anthropometric indexes and prediction equations compared with total-body electrical conductivity. Am J Clin Nutr. 1995 Jun 4;61(6):1195–205. doi: 10.1093/ajcn/61.6.1195. [DOI] [PubMed] [Google Scholar]
- 24.Wells JC. Toward body composition reference data for infants, children, and adolescents. Adv Nutr. 2014 May 4;5(3):320S–9S. doi: 10.3945/an.113.005371. [DOI] [PMC free article] [PubMed] [Google Scholar]
- 25.Demerath EW, Fields DA. Body composition assessment in the infant. Am J Hum Biol. 2014 Jan 3;26(3):291–304. doi: 10.1002/ajhb.22500. [DOI] [PMC free article] [PubMed] [Google Scholar]
- 26.Paul IM, Bartok CJ, Downs DS, Stifter CA, Ventura AK, Birch LL. Opportunities for the primary prevention of obesity during infancy. Adv Pediatr. 2009 Jan 4;56:107–33. doi: 10.1016/j.yapd.2009.08.012. [DOI] [PMC free article] [PubMed] [Google Scholar]
- 27.Perng W, Ringham BM, Glueck DH, Sauder KA, Starling AP, Belfort MB, et al. An observational cohort study of weight- and length-derived anthropometric indicators with body composition at birth and 5 months: the Healthy Start study. Am J Clin Nutr. 2017 Jun 3; doi: 10.3945/ajcn.116.149617. [DOI] [PMC free article] [PubMed] [Google Scholar]
- 28.Hollis BW, Wagner CL, Howard CR, Ebeling M, Shary JR, Smith PG, et al. Maternal Versus Infant Vitamin D Supplementation During Lactation: A Randomized Controlled Trial. Pediatrics. 2015 Oct 4;136(4):625–34. doi: 10.1542/peds.2015-1669. [DOI] [PMC free article] [PubMed] [Google Scholar]
- 29.Olsen IE, Groveman SA, Lawson ML, Clark RH, Zemel BS. New intrauterine growth curves based on United States data. Pediatrics. 2010 Feb 1;125(2):e214–24. doi: 10.1542/peds.2009-0913. [DOI] [PubMed] [Google Scholar]
- 30.Fields DA, Teague AM, Short KR, Chernausek SD. Evaluation of DXA vs. MRI for body composition measures in 1-month olds. Pediatric obesity. 2015 Nov 3;10(5):e8–10. doi: 10.1111/ijpo.12021. [DOI] [PMC free article] [PubMed] [Google Scholar]
- 31.Weber DR, Moore RHH, Leonard MB, Zemel BS. Fat and lean BMI reference curves in children and adolescents and their utility in identifying excess adiposity compared with BMI and percentage body fat. Am J Clin Nutr. 2013 Jul 1;98(1):49–56. doi: 10.3945/ajcn.112.053611. [DOI] [PMC free article] [PubMed] [Google Scholar]
- 32.Goswami I, Rochow N, Fusch G, Liu K, Marrin ML, Heckmann M, et al. Length Normalized Indices for Fat Mass and Fat-Free Mass in Preterm and Term Infants during the First Six Months of Life. Nutrients. 2016 Jul 5;8(7) doi: 10.3390/nu8070417. [DOI] [PMC free article] [PubMed] [Google Scholar]
- 33.Zou GY. Toward using confidence intervals to compare correlations. Psychol Methods. 2007 Dec 6;12(4):399–413. doi: 10.1037/1082-989X.12.4.399. [DOI] [PubMed] [Google Scholar]
- 34.Kuczmarski RJ, Ogden CL, Guo SS, Grummer-Strawn LM, Flegal KM, Mei Z, et al. 2000 CDC Growth Charts for the United States: methods and development. Vital Health Stat. 2002 May 3;11(246):1–190. [PubMed] [Google Scholar]
- 35.de Onis M. Update on the implementation of the WHO child growth standards. World Rev Nutr Diet. 2013 Jan 2;106:75–82. doi: 10.1159/000342550. [DOI] [PubMed] [Google Scholar]
- 36.Onis M. WHO child growth standards: length/height-for-age, weight-for-age, weight-for-length, weight-for-height and body mass index-for-age. WHO; 2006. [Google Scholar]
- 37.Cunningham SA, Kramer MR, Narayan KM. Incidence of childhood obesity in the United States. N Engl J Med. 2014 Apr 4;370(17):1660–1. doi: 10.1056/NEJMc1402397. [DOI] [PMC free article] [PubMed] [Google Scholar]
- 38.Birch LL, Anzman-Frasca S, Paul IM. Starting early: obesity prevention during infancy. Nestle Nutr Inst Workshop Ser. 2012 Jan;73:81–94. doi: 10.1159/000341300. [DOI] [PubMed] [Google Scholar]
- 39.McCormick DP, Sarpong K, Jordan L, Ray LA, Jain S. Infant obesity: are we ready to make this diagnosis? J Pediatr. 2010 Jul 4;157(1):15–9. doi: 10.1016/j.jpeds.2010.01.028. [DOI] [PubMed] [Google Scholar]
- 40.Koletzko B, von Kries R, Closa R, Escribano J, Scaglioni S, Giovannini M, et al. Lower protein in infant formula is associated with lower weight up to age 2 y: a randomized clinical trial. Am J Clin Nutr. 2009 Jun 1;89(6):1836–45. doi: 10.3945/ajcn.2008.27091. [DOI] [PubMed] [Google Scholar]
- 41.Gillman MW. Commentary: breastfeeding and obesity--the 2011 Scorecard. Int J Epidemiol. 2011 Jun 3;40(3):681–4. doi: 10.1093/ije/dyr085. [DOI] [PMC free article] [PubMed] [Google Scholar]
- 42.Desai M, Beall M, Ross MG. Developmental origins of obesity: programmed adipogenesis. Curr Diab Rep. 2013 Feb 5;13(1):27–33. doi: 10.1007/s11892-012-0344-x. [DOI] [PMC free article] [PubMed] [Google Scholar]
- 43.Johnson W, Choh AC, Lee M, Towne B, Czerwinski SA, Demerath EW. Is infant body mass index associated with adulthood body composition trajectories? An exploratory analysis. Pediatr Obes. 2017 Feb 3;12(1):10–18. doi: 10.1111/ijpo.12100. [DOI] [PubMed] [Google Scholar]
- 44.Sachdev HS, Fall CH, Osmond C, Lakshmy R, Dey Biswas SK, Leary SD, et al. Anthropometric indicators of body composition in young adults: relation to size at birth and serial measurements of body mass index in childhood in the New Delhi birth cohort. Am J Clin Nutr. 2005 Aug 1;82(2):456–66. doi: 10.1093/ajcn.82.2.456. [DOI] [PubMed] [Google Scholar]
- 45.Wells JC, Cole TJ. Adjustment of fat-free mass and fat mass for height in children aged 8 y. Int J Obes Relat Metab Disord. 2002 Jul 1;26(7):947–52. doi: 10.1038/sj.ijo.0802027. [DOI] [PubMed] [Google Scholar]
- 46.Chomtho S, Wells JC, Williams JE, Davies PS, Lucas A, Fewtrell MS. Infant growth and later body composition: evidence from the 4-component model. Am J Clin Nutr. 2008 Jun;87(6):1776–84. doi: 10.1093/ajcn/87.6.1776. [DOI] [PubMed] [Google Scholar]