Abstract
Background
Given the central role of the thalamus in motor, sensory, and cognitive development, methods to study emerging thalamocortical connectivity in early infancy are of great interest.
Purpose
To determine the feasibility of performing probabilistic tractography-based thalamic parcellation (PTbTP) in typically developing (TD) neonates and to compare the results with a pilot sample of neonates with congenital heart disease (CHD).
Study type
IRB approved cross sectional study.
Model
We prospectively recruited 20 TD neonates and 5 CHD neonates (imaged preoperatively).
Field strength/sequence
MRI was performed at 3.0 T including DWI and 3D MPRAGE.
Assessment
A radiologist and trained research assistants segmented the thalamus and 7 cortical targets for each hemisphere. Using the thalami as seeds and the cortical labels as targets, FSL library tools were used to generate probabilistic tracts. A Hierarchical Dirichlet Process algorithm was then used for clustering analysis. A radiologist qualitatively assessed the results of clustering. Quantitative analyses also were performed.
Statistical tests
We summarized the demographic data and results of clustering with descriptive statistics. Linear regressions co-varying for gestational age were used to compare groups.
Results
In 17 of 20 TD neonates, we identified 5 connectivity-determined clusters, which correlate with known thalamic nuclei and subnuclei. In 4 neonates with CHD we observed a spectrum of abnormalities including fewer and disorganized clusters or small supernumerary clusters (up to 7 per thalamus). After co-varying for differences in cGA, the FA, volume, and normalized thalamic volume were significantly lower in CHD neonates (p<0.01).
Conclusions
Using PTbTP clusters correlating well with the location and connectivity of known thalamic nuclei were identified in TD neonates. Differences in thalamic clustering outputs were identified in four neonates with CHD raising concern for disordered thalamic connectivity. PTbTP is feasible in TD and CHD neonates. Preliminary findings suggest prenatal origins of altered connectivity in CHD.
Keywords: Thalamus, Thalamic parcellation, Neonates, Diffusion-weighted imaging, Probabilistic Tractography, Congenital Heart Disease
Introduction
The thalamus is a paired deep gray nucleus with extensive cortical connections that plays a central role in processing of somatosensory information, integration of motor responses, development of cognition, and consciousness (1,2). In the late second and third trimesters of gestation, the thalamus quadruples in size as the majority of the thalamocortical connections are established (3,4). This accelerated rate of growth and rapidly developing connectivity renders the thalamus vulnerable to injury in the prenatal period (5,6). A growing body of evidence supports the vulnerability of the thalamus in this time period, including recent reports of decreased thalamic volume and thalamocortical connectivity in neonates born pre-term (1,7). In fact, an association between decreased thalamocortical connectivity at term-equivalent age in neonates born pre-term and cognitive delay at 2 years of age has also been reported (2). These observations suggest that thalamic connectivity may play a crucial role in early cognitive development and highlights the need for robust techniques to evaluate emerging thalamocortical connectivity.
Diffusion-weighted magnetic resonance images (DW MRI) and probabilistic tractography can characterize structural connectivity by estimating the likelihood that two areas of the brain are connected. When target regions of the cortex are segmented, probabilistic tractography (PT) can be used to parcellate the thalamus into connectivity-determined regions or clusters (8,9). This approach when used in adults and myelinated children has shown good correspondence with functional magnetic resonance imaging (fMRI) data and known thalamic nuclei (8,10).
Congenital heart disease (CHD) is the most common congenital defect, affecting approximately 8 per 1,000 live births (11). Affected children often suffer from long-term neurologic sequelae, with reported prevalence of motor delay and global developmental delay at 2 years of 42% and 23%, respectively (12,13). Recent studies have suggested that in addition to acute brain injury and injury-related to surgery, pre-existing developmental abnormalities may underlie some of the neurologic deficits seen in CHD (13–15). It remains unclear if these disabilities arise due to abnormal prenatal gene expression, pre-natal deprivation of substrate, prenatal insults, perioperative injuries, or a combination of all factors. A robust technique that allows assessment of thalamic organization and thalamocortical connectivity in the neonatal population could help differentiate poor growth of the thalamus due to prenatal deprivation of substrates with preserved thalamic organization from disorders of thalamic organization and thalamocortical connectivity.
The purpose of this pilot study is to test the feasibility of probabilistic tractography-based thalamic parcellation (PTbTP) in healthy newborns and in newborns with CHD, and to begin exploring possible differences in thalamic organization and PTbTP between these two groups.
Materials and Methods
Participants
This prospective study was approved by the institutional review board of our hospital and was performed in compliance with the Health Insurance Portability and Accountability Act. We prospectively recruited 20 term typically developing (TD) neonates (10 females; 10 males) from the well baby nursery. The mean gestational age (GA) at the time of birth was 39.3 (standard deviation [SD]: 1.2) weeks and the corrected GA (cGA) at the time of the MRI was 42.7 (SD: 1.8) weeks. The parents of these TD neonates (that served as control) were approached for consent after delivery during the post-partum hospital stay. Assessment of well being of the baby and mother was performed as part of routine clinical care. Criteria for inclusion were: unremarkable prenatal care, unremarkable labor and delivery, APGAR scores greater than 8 at 5 and 10 minutes and normal pediatrician examination prior to discharge. Neonates were excluded if there was a history of perinatal complications (sepsis, electrolyte imbalances, seizures).
We prospectively recruited 5 neonates with CHD (2 females; 3 males). Parents of neonates with CHD were approached for consent in the Cardiac ICU. The mean GA at birth was 38.8 (SD: 1.08) weeks and the mean cGA at MRI was 42.8 (SD: 1.8) weeks. Criteria for inclusion were: diagnosis of CHD confirmed by echocardiogram or cardiac MRI and ability to safely tolerate the brain MRI examination without sedation, prior to surgery. Neonates were excluded if there was evidence of a syndrome or genetic disease. Table 1 summarizes the clinical and demographic data of CHD neonates. All the MRIs were reviewed by a board certified neuroradiologist (PEG) with 18 years of experience, to ensure that no abnormality was present in the examinations, including findings consistent with acute brain injury (stroke, hemorrhage, white matter injury) or congenital malformations.
Table 1.
| Neonate | Sex | GA at birth | Postnatal age (cGA) at MRI | Diagnosis |
|---|---|---|---|---|
| CHD 1 | M | 39 w 3 d | 1 d (39 w 4 d) | HLHS |
| CHD 2 | M | 39 w 1 d | 3 d (39 w 4 d) | HLHS |
| CHD 3 | F | 37 w 5 d | 12 d (39 w 3 d) | VSD, - CoA |
| CHD 4 | F | 40 w 1 d | 4 d (40 w 4 d) | VSD, - CoA |
| CHD 5 | M | 37 w 6 d | 5 d (38 w 5 d) | d-TGA |
Demographic and clinical data of neonates with CHD. F = female, M = male, GA= gestational age; cGA = corrected GA; w = weeks; d = days; CoA= coarctation of the aorta; d-TGA= d- transposition of the great arteries; HLHS= hypoplastic left heart syndrome; PDA= patent ductus arteriosus; PFO= patent foramen ovale; VSD= ventricular septal defect.
MRI Acquisition
All examinations were performed on 3.0 Tesla scanners (Trio and Skyra, Siemens Medical Systems, Erlangen, Germany) using a 32-channel adult head coil. All neonates were imaged during natural sleep. We acquired a 3D volumetric magnetization prepared rapid gradient-echo (MPRAGE) sequence with volumetric navigators (vNav) for motion correction (16,17). The time to repetition (TR)/ time to echo (TE) were 250 ms/ 1.74 ms, inversion time (TI) was 1450 ms, and flip angle was 7 degrees. We used a parallel acceleration technique (PAT) of 2, a voxel size of 1.0 x 1.0 x 1.0 mm, field-of-view (FOV) of 160 mm, and bandwidth of 651 Hz/pixel.
For the acquisition of the DW MRI we used a multi-shell echo-planar sequence, with b= 0 s/mm2, b=1,000 s/mm2, and b=2,000 s/mm2. Each acquisition included 4 b=0 s/mm2 volumes. The TR / TE were 3700 ms / 104 ms; voxel size was 2.0×2.0×2.0 mm, the FOV 160 mm, and bandwidth 1644 Hz/Px. The diffusion gradients were applied in 40 non-collinear directions for each non-zero b-value. We chose to include b-values higher than 1000 s/mm2 in our DW MRI sequence given prior reports of more conspicuous demonstration of myelination in neonates and a multishell approach to gather more information about tissue diffusion characteristics, since it does not assume a Gaussian distribution (18,19).
Image processing
For the thalamic regions of interest (ROIs), we performed detailed manual segmentations in the native space of the MPRAGE acquisitions adhering to previously published guidelines for unmyelinated neonates (20). All segmentations were performed using FreeView, the visualization tool of the FreeSurfer package (21). The thalami of five TD subjects were segmented by a physician with 5 years of experience in image analysis and processing (CJ) and the remaining fifteen were segmented by research assistants with supervision from this physician (CJ). The thalami of all CHD subjects was segmented manually by the same investigator (CJ). The thalamus in each hemisphere was segmented separately and was used as a seed region in our subsequent tractography analyses. We outlined seven cortical target ROIs per hemisphere, which have been used in prior studies on adult and neonate resting-state connectivity (8). These include: the prefrontal, premotor, primary motor, primary somatosensory, posterior parietal, occipital, and temporal regions (Fig 1). Segmentation was performed adhering to descriptions from adult FreeSurfer brain segmentations and modified to neonatal anatomy (22). Given the limited spatial resolution of current imaging modalities and the small size of the neonatal brain, precise segmentation of cortical labels is challenging due to volume averaging of adjacent gyri into a single voxel. Therefore to avoid erroneous fiber tracking that could result from such volume averaging, we defined the cortical targets at the gray-white junction, in the juxtacortical white matter. Manual segmentation of the cortical targets was performed by one of the investigators (CJ) in 5 TD neonates and in all CHD neonates (n=5). For the remaining fifteen TD neonates, an automated segmentation of the cortical targets was performed using a modified multi-label atlas fusion algorithm benefiting from the 5 manually labeled TD data sets (23). Registration between the individual subjects was done using deformable registration via attribute matching and mutual-saliency weighting (DRAMMS) (24). The output of the automated segmentations was manually edited by trained research assistants to ensure accuracy. To ensure overall consistency a pediatric neuroradiologist (PEG) reviewed all cortical and thalamic segmentations
Figure 1.
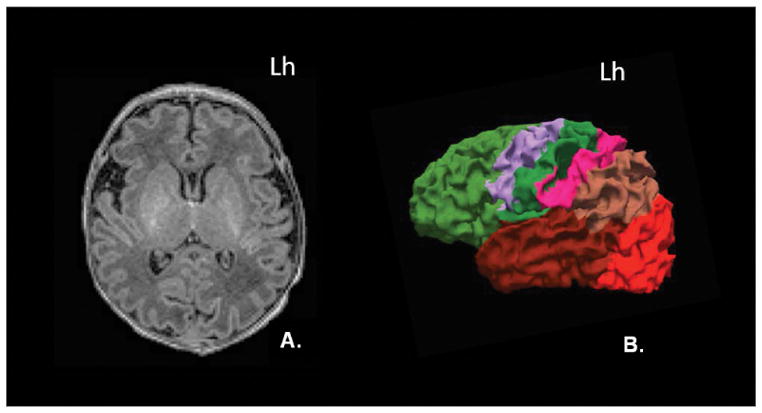
Semi-automated segmentation of the cortex. (A) Axial MPRAGE image demonstrates normal appearance of the gray and white matter in a typically developing neonate. (B) 3-D rendered surface image of the left hemisphere demonstrates the spatial relationship of the 7 cortical targets used for this study: prefrontal (light green), premotor (purple), primary motor (dark green), primary somatosensory (pink), posterior parietal (light brown), occipital (orange), and temporal (dark red). Lh= left hemisphere.
Quality Control (QC) of DWI data
The most common artifact that we observed in our diffusion weighted MRI data set is signal dropout due to motion. Before running any of the below described diffusion data processing steps, we used a semi-automated KL-divergence-based tool, called SignalDropQCTool (25,26) in order to detect and discard image volumes with significant signal dropout. In every subject we acquired 81 volumes. The mean number of volumes kept in TD neonates was 73 (SD: 6.4) and the mean number of volumes kept in CHD neonates was 73.8 (SD: 7.7).
Probabilistic Tractography and Clustering
Tools form the FSL library were used to process the diffusion data and for probabilistic tractography analysis (27). For each neonate we extracted the diffusion gradients and the corresponding b-values from the DICOM files, performed eddy current correction, and modeled the diffusion process. Probabilistic tractography was then performed using the manually segmented thalami as seed regions and the cortical labels as targets. We used default parameters for the probtrackx tool and recorded the seed-to-target counts in text files. No correction for the path distribution using pathway-length was used in these experiments. We processed the thalamus and cortical labels in each hemisphere independently, given that there is known asymmetry in the development of the left and right hemisphere at this age (28).
We used the Hierarchical Dirichlet Process Mixture Model (HDPM) to perform group-wise clustering of contiguous thalamic regions in TD neonates and in CHD neonates (29). This resulted in identifying corresponding clusters in each neonate without the need for computing spatial correspondence as a preprocessing step, which remains technically challenging in newborns. The HDPM algorithm uses information from the connectivity matrices as well as local spatial information to define the clusters. Since we performed separate analyses for the left and right hemispheres, we adjusted the coloring scheme of homologous clusters across hemispheres to ensure matching display and ease of interpretation. We also adjusted the coloring of clusters in CHD neonates to match the output of the clustering analysis in TD neonates.
The HDPM algorithm can operate in two modes: 1) a mixture model (MM) that determines the optimal number of clusters supported by the connectivity matrices, and 2) a model that retrieves a set number of clusters (k) determined by the user. Since there is no published data on PTbTP in healthy newborns or newborns with CHD, we performed a series of experiments to explore the effect that a varying k would have on the output of our clustering analysis. In both groups (TD and CHD neonates), we first performed clustering with HDPM-MM function to retrieve the optimal number of clusters, and then we compared the results of this analysis with a series of experiments performed using serial increases in k (k= 3, 4, 5, 6, 7, 8, and 9).
Image Analysis
In TD neonates we analyzed the output of the HDPM-MM (number and location of clusters), and analyzed the corresponding connectivity maps to determine the most probable cortical connections of each cluster. To analyze the cortical connections, we computed the probabilistic tracts post-hoc starting in each cluster (seed points), displayed the probability tractography maps, and examined their relation to the cortical targets. In CHD neonates we analyzed the number and location of clusters that resulted from the HDPM-MM, relative to those obtained in TD neonates. To facilitate comparison between groups, we registered the results of the clustering and the MPRAGE of all neonates into a common space. Comparison of relative location and consistency in the organization of the clusters was performed by visual inspection of the clustering outcomes by one of the investigators (CJ). We also calculated the laterality index for each of the clusters in TD neonates as described ([left-right]/[left+right]) (30).
We compared the corrected gestational age (cGA) of TD and CHD neonates at the time of imaging using a Mann-Whitney test. For each group, we calculated mean thalamic volume, ADC, and FA. In addition we calculated whole-brain volume (WBV) using the 3D-MPRAGE sequences and estimated normalized thalamic volume (NTV) to WBV. We performed a series of multivariate linear regressions using cGA as a covariate, the clinical status (CHD or TD) as independent variables, and ADC, FA, thalamic volume and NTV as dependent variables. A p<0.05 was considered significant.
Results
Thalamic Parcellation in Typically Developing Neonates
The HDPM-MM clustering algorithm (optimal number of clusters) identified 5 clusters in 37 out of 40 thalami (17 out of 20 subjects). In three subjects, the right thalamus showed only four clusters. In the dominant pattern (5 clusters), there was a consistent arrangement of the clusters, with a medial and anterior cluster (blue), two ventral and lateral clusters (pink more anteriorly and white more posteriorly), a cluster in the posterolateral thalamus with extension into the medial thalamus (purple), and a cluster in the medial dorsal thalamus (red)(Fig 2). In the three thalami containing only 4 clusters, the smallest cluster (purple) was missing. Table 2 summarizes the relative volume of the individual thalamic clusters in TD neonates. The clustering results using HDPM-MM were similar among TD neonates with high percent overlap of clusters (supplementary Figure 1). As noted in table 2, volumes of the blue, pink and red clusters were symmetric whereas the white and purple clusters had subtle leftward and stronger rightward asymmetries respectively. As noted in table 2, there was symmetry in the connections of the blue, pink and red clusters whereas the purple clusters had subtle asymmetries in their connections. Supplementary table 1 shows the outcomes of HDPM-MM clustering, thalamic volumes, and NTV for all TD neonates
Figure 2.
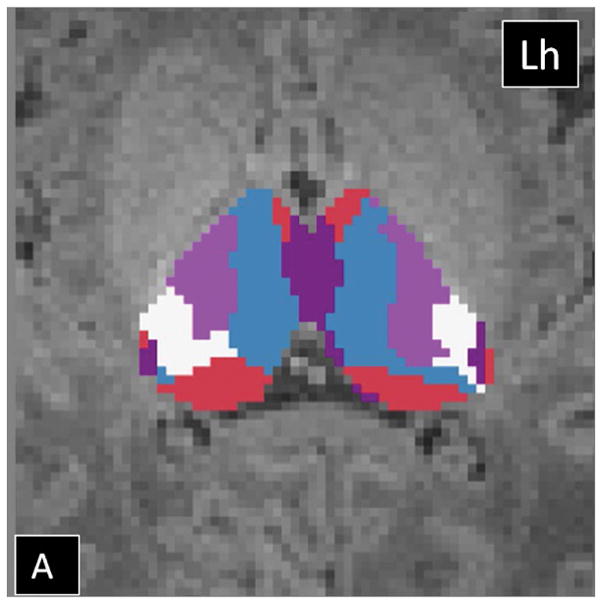
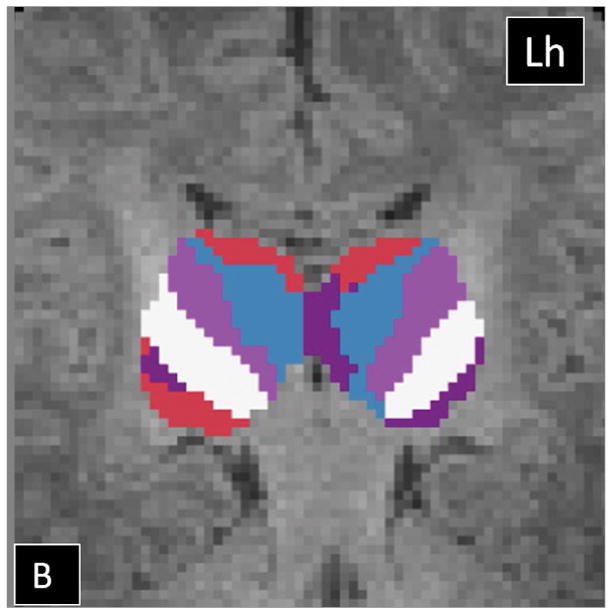
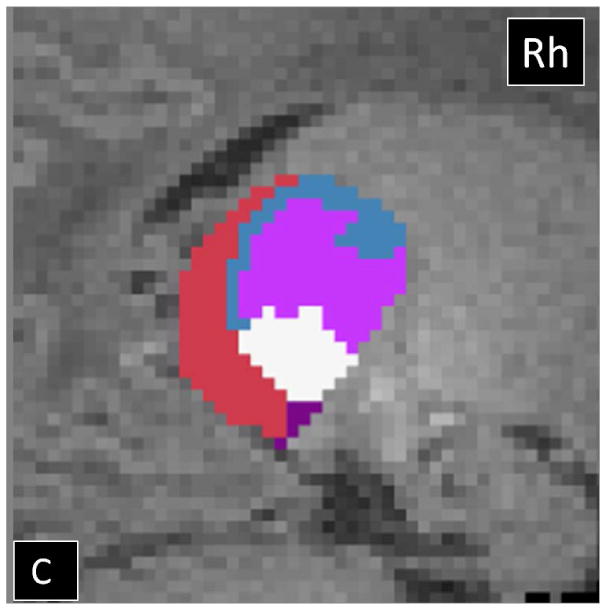
Probabilistic tractography-based thalamic parcellation using HDPM-MM in a TD neonate (TD 1). Images in the (A) axial, (B) coronal, and (C) sagittal planes show the relative location of the clusters within the thalamus proper. The blue cluster is located in the anterior and medial thalamus, the pink and white clusters are located in the ventrolateral thalamus, the red cluster is located in the medial and dorsal thalamus, and the purple clusters are located in the posterolateral and medial thalamus. Lh= left hemisphere; Rh= right hemisphere.
Table 2.
| Left Thalamus | Right Thalamus | Laterality index (95% CI) | |||
|---|---|---|---|---|---|
| Volume | Normalize Volume (% Thalamic Volume) | Volume | Normalize Volume (% Thalamic Volume) | ||
| Blue | 1071 (+/− 216.1) | 23.9 (+/−3.94) | 938.9 (+/− 224.5) | 21.2 (+/−3.5) | 0.06 (−0.07– 0.18) |
| Pink | 703.3 (+/− 182.9) | 15.7 (+/−3.4) | 692 (+/− 159.9) | 15.7 (+/−2.6) | −0.007 (−0.16 −0.15 |
| White | 705.9 (+/− 216) | 15.7 (+/− 3.8) | 903.2 (+/− 152.7) | 20.7 (+/−3.1) | −0.14 (−0.28– [−0.005]) * |
| Purple | 452.4 (+/−202.7) | 9.9 (+/− 4.4) | 211 (+/−148.9) | 4.7 (+/−3.29) | 0.4 (0.06– 0.75)* |
| Red | 1547.1 (+/− 264.6) | 34.7 (+/− 4.8) | 1632.3 (+/− 190.9) | 37.5 (+/−4.11) | −0.04 (−0.12– 0.04) |
Volumes for clusters retrieved with HDPM-MM in TD neonates. Absolute thalamic cluster volumes and cluster volumes normalized to respective thalamic volume are presented volume (Relative to thalamic volume) of the individual thalamic clusters. Laterality index is recorded in the last column.
significance.
Note rightward laterality for white and leftward laterality for purple clusters.
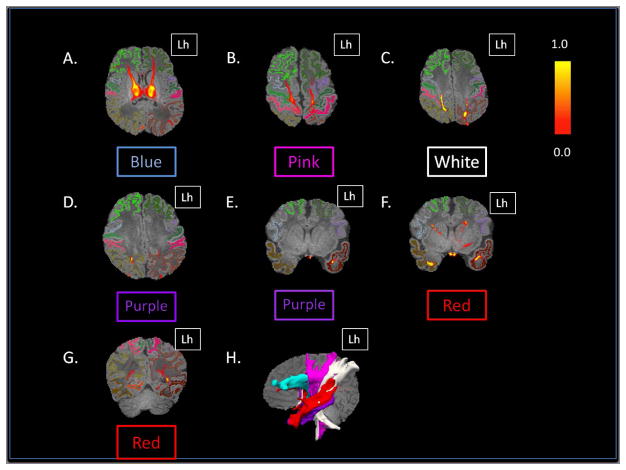
To determine the cortical labels associated with each thalamic cluster identified by HDPM-MM, probabilistic tractography maps obtained using each individual cluster as a seed region were obtained (Fig 3). Table 3 summarizes the cortical areas that demonstrate the highest probability of connections to each thalamic cluster and the putative correspondence to known thalamic nuclei inferred from their cortical connections (31).
Figure 3.
Probabilistic tractography maps showing the likelihood of connections between each of the clusters and the cortical targets in a TD neonate (TD 4). (A) Axial image shows strong connections of the blue cluster to the prefrontal labels. (B) Axial image shows strong connections from the pink cluster to the premotor labels (gray on the right and purple on the left) and primary motor labels (green labels). (C) Axial image shows strong connections of the white cluster to the primary somatosensory label and the superior aspect the posterior parietal label. (D) Axial and (E) coronal images show strong connections between the purple cluster and the posterior parietal on the right, weaker connections to the posterior parietal on the left, and strong connections to the temporal lobe on the left. (F and G) Coronal images show strong connections of the red clusters to the prefrontal, temporal, and occipital lobes. (H) Sagittal 3D-rendered images of the thresholded probabilistic tracts illustrate the spatial relationship of these tracts in the white matter. Colors correspond to the thalamic ROI that generated the connections. Lh= left hemisphere.
Table 3.
| Color | Location | Cortical connections | Putative Correspondence to Thalamic Nuclei |
|---|---|---|---|
| Blue | Medial and anterior thalamus | Prefrontal label | Ventral anterior nucleus and the medial dorsal nucleus. Anterior nuclear group (inferred from location). |
| Pink | Anterior VL thalamus | Premotor and primary motor labels | Ventral-lateral nucleus. |
| White | Posterior VL thalamus | Primary somatosensory and posterior parietal labels. | Ventral posterior nucleus. |
| Red | Dorsomedial thalamus | Temporal label | Medial geniculate body and medial pulvinar |
| Occipital label | Lateral geniculate body and inferior pulvinar | ||
| Prefrontal label | Mediodorsal nucleus and medial pulvinar | ||
| Purple (Right) | Posterolateral and medial | Posterior parietal label (dominant) | Lateral posterior nucleus and anterior pulvinar. Mediodorsal nucleus |
| Temporal label (occasional, weaker connections) | Medial geniculate body and medial pulvinar | ||
| Purple (Left) | Posterolateral and medial | Temporal label (dominant) | Medial geniculate body and medial pulvinar |
| Posterior parietal (weaker connections) | Lateral posterior nucleus and anterior pulvinar. Mediodorsal nucleus. |
Anatomic location and cortical connections of thalamic clusters obtained using HDPM-MM in typically developing newborns. VL= ventrolateral. The correspondence with known thalamic nuclei is inferred based on cortical connectivity patterns and location.
Thalamic Parcellation in CHD Neonates
The HDPM-MM algorithm was successful in parcellating the thalami in neonates with CHD. In both thalami, the optimal number of clusters (HDPM-MM) ranged from 4 to 7 (see Table 4). In thalami with 5 clusters, their location and connectivity pattern was similar to that observed in TD neonates. In thalami with only 4 clusters, the spatial arrangement of the clusters was different from that observed in the control population (Fig 4). In subjects with 6 and 7 clusters, the additional clusters were small in volume (range: 0.1%–8%) and had limited connectivity patterns often to a single cortical label. Supplementary Table 2 summarizes the relative volume of the thalamic clusters in neonates with CHD. Supplementary figure 2 shows the outcomes of HDPM-MM clustering for all CHD neonates and supplementary figure 3 shows the probabilistic tractography heat maps demonstrating the likelihood of cortical connections from each thalamic cluster in a CHD subject.
Table 4.
| TD | CHD | Group differences | |
|---|---|---|---|
| Whole brain Volume (mm3) | 475403 (+/− 62787) | 394497 (+/− 32727) | p=0.002 |
| Thalamic Volume (mm3) | 4460 (+/− 607) | 3300 (+/− 539) | p<0.001 |
| Normalized Thalamic Volume (% of WBV) | 0.94 (+/− 0.12) | 0.83 ( +/− 0.09) | p<0.001 |
| ADC (mm2/s) | 9.5 x 10 −4 (+/− 4.7 x 10 −5) | 1.03 x 10 −3 (+/− 2 x 10 −5) | p<0.001 |
| FA | 0.2 ( +/− 0.01) | 0.17 (0.01) | p<0.001 |
| Number of Clusters (L / R) | 5 (0) /4.85 ( +/− 0.3) | 5.6 (+/− 0.89) /5.2 (1.09) |
Whole brain volume (WBV), thalamic volume, normalized thalamic volume, ADC, FA, and number of clusters in each thalamus using HDPM-MM. The significant level reported in the third column shows the result of the Mann-Whitney group comparison.
Figure 4.
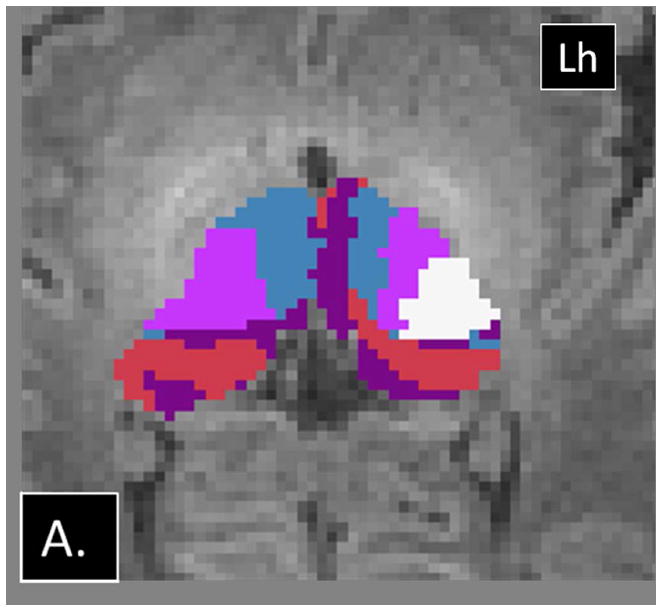
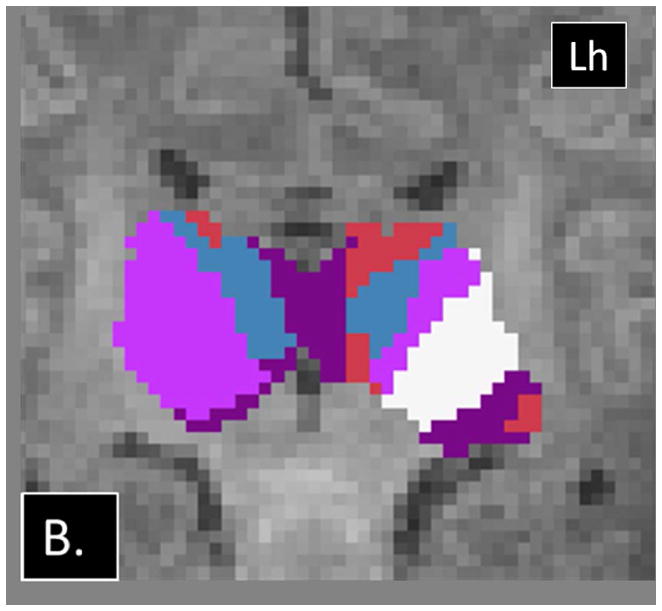
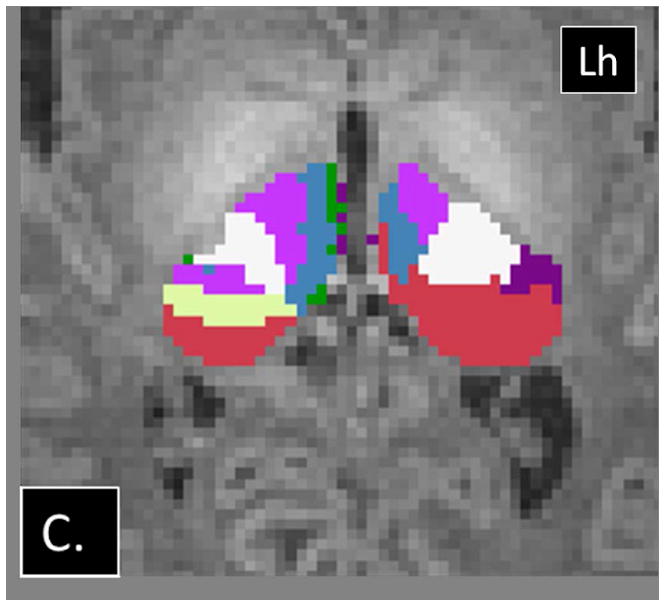
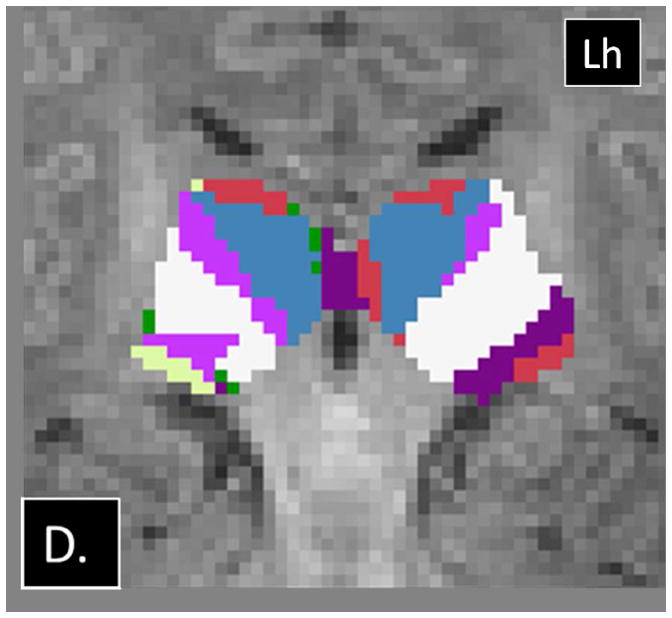
Examples of abnormalities PTbTP using HDPM-MM observed in CHD neonates. (A) Axial and (B) coronal images from CHD 3 show only 4 clusters in the right thalamus, with preserved arrangement of the clusters in the left thalamus. (C) Axial and (D) coronal images from CHD 2 show additional clusters in the right thalamus (green and yellow). Note the relatively small volume of these additional clusters. Lh= left hemisphere.
Effects of an increasing k
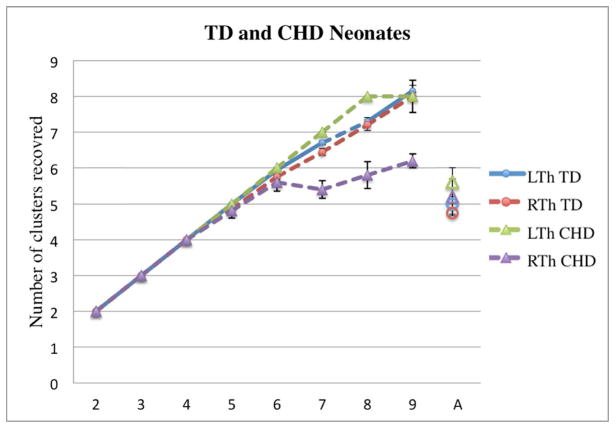
In TD neonates, increasing the value of k resulted in an increase in the number of clusters recovered. The increase was linear at low k values, with k being equal to the number of recovered clusters for all thalami up to k=4. At k=5, the algorithm was able to recover 5 clusters in 37/40 thalami. While the number of clusters continued to increase with increasing k, the standard error of the mean also increased above this bending point. No asymmetries were noted (Fig 5). Supplementary Figure 4 shows examples of clustering outputs using different k values in a TD neonate. We observed a similar pattern in neonates with CHD, with an increase in the number of clusters recovered with an increasing k, which plateaued at approximately 5–6 clusters as well, particularly on the right side (Fig 5). However, unlike TD neonates, for k > 5, CHD neonates showed significantly fewer clusters in the right compared to left thalamus and a slower increase in number of clusters recovered with increasing k.
Figure 5.
Changes in the number of clusters recovered (y-axis) as a function of k (x- axis) in TD neonates and CHD neonates. The last point in the x-axis, “A”, corresponds to the number of clusters recovered when the automated optimization of cluster numbers is used (MM mode). The diagrams show increase in the number of clusters with increasing k in both groups. Individual bullets represent the mean number of clusters recovered for a particular k; the whiskers represent the standard error. Note the linear increase in the number of clusters for both groups at lower k values and increase in the standard error after k > 5.
Independent variable analyses
There was a statistically significant (p<0.001) difference in the mean cGA at MRI between groups, with TD neonates being imaged later than CHD neonates.
There was no significant difference between the volume of the right and left thalamus in either population (p> 0.1, for both). A series of Mann-Whitney tests revealed significant differences between groups in WBV, thalamic volume, NTV, thalamic ADC and thalamic FA (p<0.01 for all). Table 4 summarizes these data as well as the number of clusters in the thalami of each group using HDPM-MM. The lower thalamic FA, volume, and NTV in CHD neonates remained significant after co-varying for the effects of cGA (p<0.01, p=<0.01 and p<0.01 respectively). A trend toward higher thalamic ADC in CHD neonates did not reach statistical significance after co-varying for cGA (p=0.17). Figure 6 depicts the age-related changes in FA, thalamic volume, NTV, and ADC.
Figure 6.
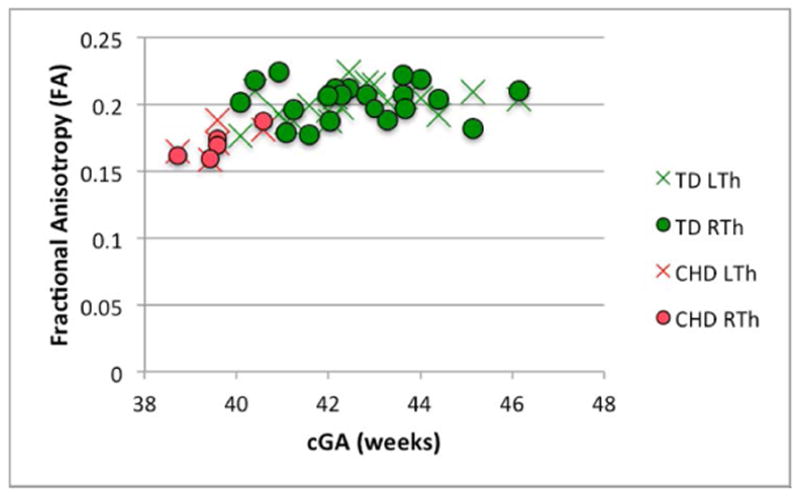
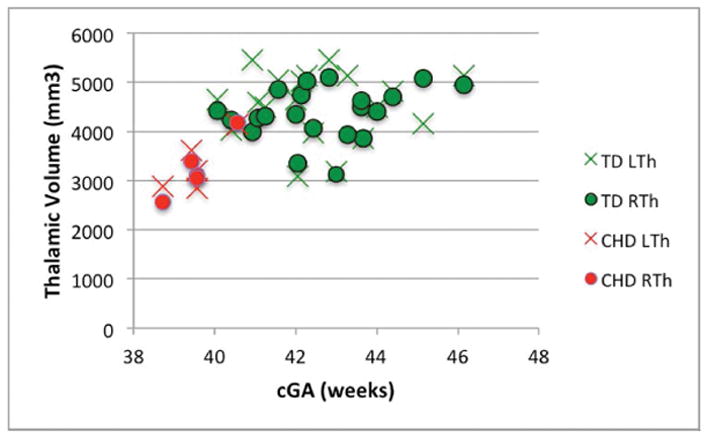
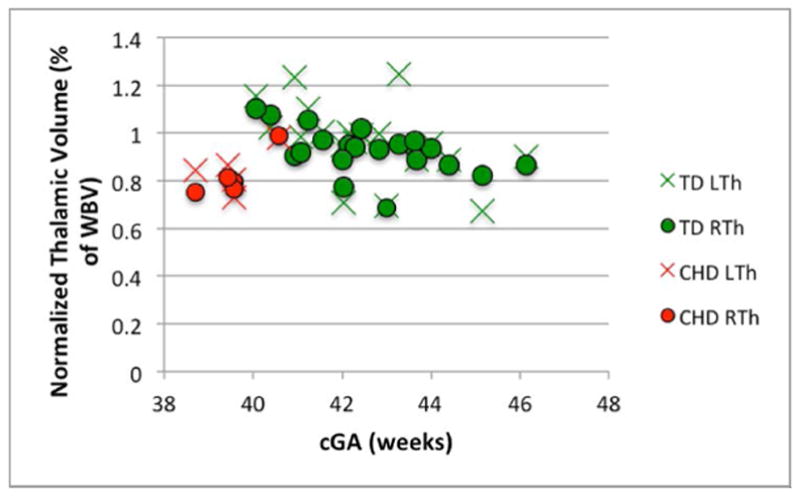
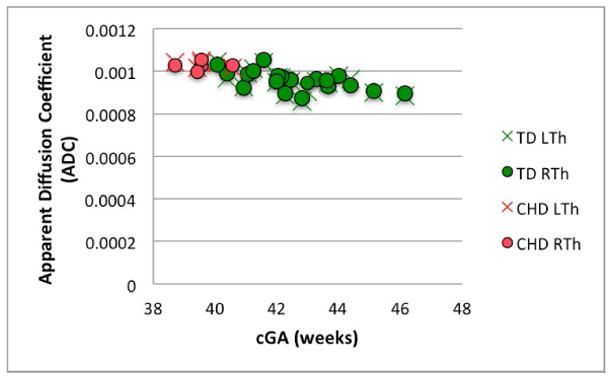
Changes in (A) FA (B) thalamic volume, (C) NTV, and (D) ADC, as a function of corrected GA (cGA) for the TD and CHD neonates. Green bullet points = TD neonates; red bullet points = CHD neonates. Thalami in CHD neonates had significantly lower FA, volume, and NTV compared to TD even after co-varying for cGA (p<0.01, p=<0.01 and p<0.01, respectively). No significant differences in ADC after co-varying for cGA and no significant lateral asymmetries were observed.
Discussion
Our results show that probabilistic tractography-based thalamic parcellation (PTbTP) can be successfully performed in TD neonates despite challenges related to motion, lack of myelination and smaller size of the brain. In fact, PTbTP in TD neonates yields clusters that correspond well to known thalamic anatomy. In addition we also showed that it is feasible to perform PTbTP in neonates with CHD, a population at increased risk for adverse neurologic outcomes. Previously PTbTP has only been reported in myelinated brains (8,9). Even though the central role of the thalamus in sensory, motor, and cognitive functions is increasingly recognized, little is known about early thalamic development and emerging thalamocortical connectivity in both TD neonates and those at risk for developmental delay. The ability to successfully perform PTbTP in TD and CHD neonates provides the ability to explore emerging thalamic connectivity and its potential role in cognitive development.
Our analysis of a population of TD neonates using HDPM-MM consistently revealed 5 clusters in both TD and CHD neonates. In the absence of direct histologic comparison it is hard to determine the precise anatomic correlate of these clusters. However, we can infer putative correspondence to thalamic nuclei and nuclear groups based on location and connectivity. In our connectivity analysis, we observed significant overlap in connectivity between neighboring clusters. For example the white cluster and the purple cluster share connections to the posterior parietal label, and the red cluster and the blue cluster share connections to the prefrontal label. One possible explanation is that our diffusion sequence may have limited spatial resolution to characterize the small thalamic nuclei in the neonatal brain, which may be a few mm3 in volume. A second consideration could be that there is interdigitation between cellular populations from adjacent nuclei and between thalamic nuclei and intrathalamic axonal bundles. A similar hypothesis was entertained to explain the indistinct borders observed by Johansen-Berg and collaborators in their adult clustering experiments (8). A third possibility is exuberant connectivity of the thalamus prior to axonal pruning (32). Animal studies have shown that some thalamo-cortical axons form transient connections with areas of the cortex that will not persist, and some of these non-specific connections may account for the overlap in connectivity patterns between adjacent clusters in neonates (33).
We also observed asymmetries in the connectivity pattern in the purple cluster and asymmetries in the white and purple cluster volumes, left and rightward respectively. While the precise significance of these asymmetries remains unclear, we believe it could represent early functional specialization. Evidence of early asymmetries on structural connectivity in the white matter in late gestation and early infancy have been described in several pathways (34). In particular, asymmetries in language and sensory motor pathways have been documented in-vivo using DWI, which correlate with the strong functional lateralization of these tasks (35). Dubois and colleagues reported a rightward asymmetry in FA of the white matter of right superior temporal lobe and leftward asymmetry of other temporal white matter pathways including the arcuate fasciculus and sensorimotor tracts. Since purple clusters are connected to the temporal lobes and white clusters are connected to the primary somatosensory cortex, it is conceivable that the hemispheric differences in parcellation that we observed in these two clusters reflect emerging functional asymmetries in language and somatosensory function of the neonatal brain (35).
The results from our clustering experiments bear striking similarity to previously published studies. Johansen-Berg et. al., and Broser et. al., used a similar set of cortical labels to investigate thalamocortical connectivity in adults and myelinated children (ages 8 to 13 yrs), respectively (8,36). While the number of clusters recovered by these authors was slightly different, the topology of the thalamic clusters and their pattern of cortical connectivity targets were very similar. For example, the medial and anterior thalamus contains a cluster that shows strong prefrontal connections; the ventral lateral thalami show several clusters with a step-wise anterior-posterior progression of connections to the pre-motor, primary motor, and primary somatosensory targets; and the posteromedial and dorsal thalamus contains clusters that are connected to the posterior parietal, occipital, and temporal labels (8). The pattern of thalamocortical connections we observed also resembles the pattern observed on resting state functional connectivity analysis in healthy neonates described by Toulmin and colleagues (37). The results of their independent component analysis-driven segmentation shows good correspondence to the topology and connectivity of our clusters for the prefrontal, premotor, motor, primary somatosensory, temporal, and occipital labels.
The reason for the differences in the number of clusters reported in other PT studies including the results of Broser and Johansen-Berg and our own results is possibly related to the fact that these authors used a “winner takes all” approach to clustering, which results in a number of thalamic clusters that is equal to the number of cortical targets (8,36). However, the overall connectivity pattern remains consistent. For example, like in our study, Broser et. al, used labels for the prefrontal label, premotor label, primary motor cortex and primary somatosensory cortex, that resulted in clusters in the anterior/medial and ventral lateral thalamus respectively. Also, the clusters related to the occipital and temporal labels are located in the dorsolateral thalamus, analogous to the connections from the red cluster in our experiments. When comparing our results to those from the functional connectivity segmentation of Toulmin and colleagues, the main difference is the identification of a distinct anterior cluster that has strong functional connections to the anterior cingulate cortex, which presumably represents the anterior nuclear group (37). Our study and those of Broser and Johansen-Berg did not incorporate this label and consequently we were unable to isolate this cluster/nuclear group. Differences in the clustering output can also reflect age-related changes. The lower FA in the neonatal white matter and thalamus and the lower thalamic volume (3000 mls in neonates vs 7500 mls in adults) could affect PTbTP (38,39). Axonal and synaptic pruning reshape thalamocortical connectivity in the first years of life and also could conceivably affect connectivity driven parcellation of the thalamus (40).
It is difficult to compare our results to those reported by other authors that used alternate methods to perform structural connectivity-driven parcellation. However, we believe that reporting the feasibility of this approach in newborns is valueable since the HDPMM algorithm does not require inter-subject registration or spatial correspondence, which remains technically challenging in this population (29). In addition, HDPM automatically imposes inter-subject correspondence to the outcome of the cluster analysis in each hemisphere (29). The previous work from Jbabdi et al. also demonstrated that HDPM-MM accurately estimates the number of clusters supported by the connectivity matrices and spatial information in adult subjects (29). When we performed serial clustering experiments progressively increasing k, the variability in the number of clusters we recovered increased when K> than 5. This observation provides evidence that HDPM-MM is able to prune down the outcome of clustering to that supported by the connectivity matrices, even in neonates.
Given the small sample in our cohort, differentiating the seemingly overlapping phenotypes of CHD and younger cGA can be challenging. We documented lower absolute and normalized thalamic volume and lower thalamic FA in CHD neonates, after co-varying for gestational age. Limperopoulos et al., reported decreased volume of subcortical gray matter in neonates with CHD relative to controls, which correlates well with our findings. We observed a trend toward higher ADC in the thalami of neonates with CHD, which did not reach statistical significance; this is consistent with previous reports with the lack of statistical significance probably related to sample size (41). We observed lower FA in the thalami of CHD neonates which conflicts with a recent report by Paquette et al; this study did not find differences in FA in the thalami of pre-term neonates with CHD imaged at term when compared to non CHD neonates from the same neonatal intensive care unit (42). However, the subjects of this study were preterm and are likely to have additional abnormalities related to their prematurity (1,43,44). We believe that decreased thalamic FA reflects abnormal thalamic microstructure that coexists with altered white matter microstructure previously reported (41).
Despite lower thalamic volume and lower FA in CHD neonates, clustering analysis with HDPM was successful and allowed us to extend the prior work to explore the connectivity and organization of the thalamus in this population. In CHD neonates, 5 clusters similar to those found in TD neonates were observed in 6/10 thalami but alternate clustering outputs were observed in 4/5 CHD neonates (4/10 thalami). In CHD3, the right thalamus had only 4 clusters, which appear disorganized. The left thalamus of CHD1 and CHD4, and the right thalamus of CHD2 showed small additional clusters that demonstrated single label connections. Although the precise cause of these findings cannot be determined in this pilot study, disorganized connections or a more disperse pattern of thalamocortical connectivity are possible. Birca and colleagues reported decreased low-frequency electroencephalographic connectivity in association with lower FA measurements in the cerebral white matter of neonates with CHD, which supports the hypothesis that our observations may indeed represent abnormalities in emerging cerebral connectivity (45).
Considering that all CHD neonates in this study were imaged prior to surgery and that there was no acute brain injury at the time of the scan, the observed differences probably developed prenatally. Berman et al. reported higher ADC in the thalami of fetuses with CHD imaged during the third trimester relative to controls neonates, which supports that at least in some neonates abnormalities in thalamic microstructure and/or development arise prenatally (46). Several options have been proposed to contribute to the spectrum of pre-operative abnormalities in newborns with CHD, including a combination of prenatal injury, hemodynamic abnormalities, metabolic dysregulation, and abnormal gene expression. CHD often results in hemodynamic abnormalities that compromise delivery of oxyhemoglobin and other metabolic substrates to the brain that can ultimately result in brain injury (47,48). Another contributing factor could be abnormal gene expression. Homsy and collaborators reported that neonates with CHD have increased rate of de-novo mutations in genes involved in development of the heart, such as RBFOX2, relative to control neonates. The results from Homsy and collaborators also demonstrate that the number of damaging de novo mutations was higher in CHD neonates who also had neurodevelopmental disability (15).
The main limitation of our study is its small sample size. However, we feel that the number of neonates is sufficient to demonstrate the feasibility of PTbTP in term TD neonates. Our results also support that PTbTP can be performed in neonates with CHD. However, attributing the differences in parcellation exclusively to CHD is difficult due to the sample size and the differences in cGA. Another limitation is the absence of direct histologic correlation. Given that our study used TD neonates and that most children with CHD survive, pathologic correlation could not be obtained. Additional studies validating our results with observations from resting state functional MRI could provide additional insights to support our observations. Another limitation is the clinical heterogeneity of the CHD neonates; this group includes subjects with various diagnoses, which increases the variability in this population. It is conceivable that different congenital heart defects affect brain development and thalamocortical connectivity via various mechanisms and consequently the abnormalities are not consistent between the five individuals that were recruited. A technical limitation related to this set of labels is that it ignores connections between the thalamus and the limbic system. This approach also fails to incorporate the extensive network of subcortical thalamic connections, such as the thalamostriate and thalamocerebellar connections.
In conclusion, Probabilistic tractography-based thalamic parcellation is feasible in TD neonates and in neonates with CHD. We were able to consistently recover clusters that correlate well with known thalamic nuclear groups. Preliminary observations in neonates with CHD show a spectrum of findings that range from normal thalamic organization to thalami with fewer and/or disorganized clusters. Further studies with fMRI data, or serial imaging are needed to better understand emerging thalamocortical connectivity, and to determine if PTbTP has a role in identifying clinically significant abnormalities in thalamic organization in CHD.
Supplementary Material
Acknowledgments
Grant support: This work was partially supported by a grant from Abbott Nutrition through the Center for Nutrition, Learning, and Memory at the University of Illinois. Subjects included in this study are part of a cohort of subjects enrolled in a trial that was registered at clinicaltrials.gov as NCT02058225 as well as from NIH NIHCD R00 HD061485-03 (LZ), R21HD072505 and R01HD076258 (PEG) and NIH S10RR023401, S10RR019307, S10RR019254, S10RR023043.
Footnotes
Disclosures: none
Cited References
- 1.Ball G, Boardman JP, Rueckert D, et al. The effect of preterm birth on thalamic and cortical development. Cereb Cortex. 2012;22(5):1016–1024. doi: 10.1093/cercor/bhr176. [DOI] [PMC free article] [PubMed] [Google Scholar]
- 2.Ball G, Pazderova L, Chew A, et al. Thalamocortical Connectivity Predicts Cognition in Children Born Preterm. Cereb Cortex. 2015 doi: 10.1093/cercor/bhu331. [DOI] [PMC free article] [PubMed] [Google Scholar]
- 3.Sotiriadis A, Dimitrakopoulos I, Eleftheriades M, Agorastos T, Makrydimas G. Thalamic volume measurement in normal fetuses using three-dimensional sonography. J Clin Ultrasound. 2012;40(4):207–213. doi: 10.1002/jcu.21888. [DOI] [PubMed] [Google Scholar]
- 4.Wilkinson M, Kane T, Wang R, Takahashi E. Migration Pathways of Thalamic Neurons and Development of Thalamocortical Connections in Humans Revealed by Diffusion MR Tractography. Cereb Cortex. 2016 doi: 10.1093/cercor/bhw339. [DOI] [PMC free article] [PubMed] [Google Scholar]
- 5.Smart JL, Dobbing J, Adlard BP, Lynch A, Sands J. Vulnerability of developing brain: relative effects of growth restriction during the fetal and suckling periods on behavior and brain composition of adult rats. J Nutr. 1973;103(9):1327–1338. doi: 10.1093/jn/103.9.1327. [DOI] [PubMed] [Google Scholar]
- 6.Dobbing J. The later growth of the brain and its vulnerability. Pediatrics. 1974;53(1):2–6. [PubMed] [Google Scholar]
- 7.Ball G, Boardman JP, Aljabar P, et al. The influence of preterm birth on the developing thalamocortical connectome. Cortex. 2013;49(6):1711–1721. doi: 10.1016/j.cortex.2012.07.006. [DOI] [PubMed] [Google Scholar]
- 8.Johansen-Berg H, Behrens TE, Sillery E, et al. Functional-anatomical validation and individual variation of diffusion tractography-based segmentation of the human thalamus. Cereb Cortex. 2005;15(1):31–39. doi: 10.1093/cercor/bhh105. [DOI] [PubMed] [Google Scholar]
- 9.Behrens TE, Johansen-Berg H, Woolrich MW, et al. Non-invasive mapping of connections between human thalamus and cortex using diffusion imaging. Nat Neurosci. 2003;6(7):750–757. doi: 10.1038/nn1075. [DOI] [PubMed] [Google Scholar]
- 10.Counsell SJ, Dyet LE, Larkman DJ, et al. Thalamo-cortical connectivity in children born preterm mapped using probabilistic magnetic resonance tractography. Neuroimage. 2007;34(3):896–904. doi: 10.1016/j.neuroimage.2006.09.036. [DOI] [PubMed] [Google Scholar]
- 11.Hoffman JI, Kaplan S. The incidence of congenital heart disease. J Am Coll Cardiol. 2002;39(12):1890–1900. doi: 10.1016/s0735-1097(02)01886-7. [DOI] [PubMed] [Google Scholar]
- 12.Bellinger DC, Wypij D, duPlessis AJ, et al. Neurodevelopmental status at eight years in children with dextro-transposition of the great arteries: the Boston Circulatory Arrest Trial. J Thorac Cardiovasc Surg. 2003;126(5):1385–1396. doi: 10.1016/s0022-5223(03)00711-6. [DOI] [PubMed] [Google Scholar]
- 13.Limperopoulos C, Majnemer A, Shevell MI, et al. Predictors of developmental disabilities after open heart surgery in young children with congenital heart defects. J Pediatr. 2002;141(1):51–58. doi: 10.1067/mpd.2002.125227. [DOI] [PubMed] [Google Scholar]
- 14.Newburger JW, Bellinger DC. Brain injury in congenital heart disease. Circulation. 2006;113(2):183–185. doi: 10.1161/CIRCULATIONAHA.105.594804. [DOI] [PubMed] [Google Scholar]
- 15.Homsy J, Zaidi S, Shen Y, et al. De novo mutations in congenital heart disease with neurodevelopmental and other congenital anomalies. Science. 2015;350(6265):1262–1266. doi: 10.1126/science.aac9396. [DOI] [PMC free article] [PubMed] [Google Scholar]
- 16.Tisdall MD, Hess AT, Reuter M, Meintjes EM, Fischl B, van der Kouwe AJ. Volumetric navigators for prospective motion correction and selective reacquisition in neuroanatomical MRI. Magn Reson Med. 2012;68(2):389–399. doi: 10.1002/mrm.23228. [DOI] [PMC free article] [PubMed] [Google Scholar]
- 17.van der Kouwe AJ, Benner T, Salat DH, Fischl B. Brain morphometry with multiecho MPRAGE. Neuroimage. 2008;40(2):559–569. doi: 10.1016/j.neuroimage.2007.12.025. [DOI] [PMC free article] [PubMed] [Google Scholar]
- 18.Dudink J, Larkman DJ, Kapellou O, et al. High b-value diffusion tensor imaging of the neonatal brain at 3T. AJNR Am J Neuroradiol. 2008;29(10):1966–1972. doi: 10.3174/ajnr.A1241. [DOI] [PMC free article] [PubMed] [Google Scholar]
- 19.Rathi Y, Michailovich O, Setsompop K, Bouix S, Shenton ME, Westin CF. Sparse multi-shell diffusion imaging. Med Image Comput Comput Assist Interv. 2011;14(Pt 2):58–65. doi: 10.1007/978-3-642-23629-7_8. [DOI] [PMC free article] [PubMed] [Google Scholar]
- 20.de Macedo Rodrigues K, Ben-Avi E, Sliva DD, et al. A FreeSurfer-compliant consistent manual segmentation of infant brains spanning the 0–2 year age range. Front Hum Neurosci. 2015;9:21. doi: 10.3389/fnhum.2015.00021. [DOI] [PMC free article] [PubMed] [Google Scholar]
- 21.Fischl B. FreeSurfer. Neuroimage. 2012;62(2):774–781. doi: 10.1016/j.neuroimage.2012.01.021. [DOI] [PMC free article] [PubMed] [Google Scholar]
- 22.Fischl B, Salat DH, Busa E, et al. Whole brain segmentation: automated labeling of neuroanatomical structures in the human brain. Neuron. 2002;33(3):341–355. doi: 10.1016/s0896-6273(02)00569-x. [DOI] [PubMed] [Google Scholar]
- 23.Iglesias JE, Sabuncu MR, Van Leemput K. A Generative Model for Multi-Atlas Segmentation across Modalities. Proc IEEE Int Symp Biomed Imaging. 2012:888–891. doi: 10.1109/ISBI.2012.6235691. [DOI] [PMC free article] [PubMed] [Google Scholar]
- 24.Ou Y, Sotiras A, Paragios N, Davatzikos C. DRAMMS: Deformable registration via attribute matching and mutual-saliency weighting. Med Image Anal. 2011;15(4):622–639. doi: 10.1016/j.media.2010.07.002. [DOI] [PMC free article] [PubMed] [Google Scholar]
- 25.SignalDropQCTool.
- 26.Carquex C. Quality Control in Diffusion Weighted MRI. National Institute of Applied Sciences; Lyon, France: 2015. [Google Scholar]
- 27.Woolrich MW, Jbabdi S, Patenaude B, et al. Bayesian analysis of neuroimaging data in FSL. Neuroimage. 2009;45(1 Suppl):S173–186. doi: 10.1016/j.neuroimage.2008.10.055. [DOI] [PubMed] [Google Scholar]
- 28.Ratnarajah N, Rifkin-Graboi A, Fortier MV, et al. Structural connectivity asymmetry in the neonatal brain. Neuroimage. 2013;75:187–194. doi: 10.1016/j.neuroimage.2013.02.052. [DOI] [PMC free article] [PubMed] [Google Scholar]
- 29.Jbabdi S, Woolrich MW, Behrens TE. Multiple-subjects connectivity-based parcellation using hierarchical Dirichlet process mixture models. Neuroimage. 2009;44(2):373–384. doi: 10.1016/j.neuroimage.2008.08.044. [DOI] [PubMed] [Google Scholar]
- 30.Seghier ML. Laterality index in functional MRI: methodological issues. Magn Reson Imaging. 2008;26(5):594–601. doi: 10.1016/j.mri.2007.10.010. [DOI] [PMC free article] [PubMed] [Google Scholar]
- 31.Nieuwenhuys R, Voogd J, Huijzen Cv. The human central nervous system. Berlin ; New York: Springer; 2008. p. xiv.p. 967. [Google Scholar]
- 32.Innocenti GM, Price DJ. Exuberance in the development of cortical networks. Nat Rev Neurosci. 2005;6(12):955–965. doi: 10.1038/nrn1790. [DOI] [PubMed] [Google Scholar]
- 33.Naegele JR, Jhaveri S, Schneider GE. Sharpening of topographical projections and maturation of geniculocortical axon arbors in the hamster. J Comp Neurol. 1988;277(4):593–607. doi: 10.1002/cne.902770411. [DOI] [PubMed] [Google Scholar]
- 34.Song JW, Mitchell PD, Kolasinski J, Ellen Grant P, Galaburda AM, Takahashi E. Asymmetry of White Matter Pathways in Developing Human Brains. Cereb Cortex. 2015;25(9):2883–2893. doi: 10.1093/cercor/bhu084. [DOI] [PMC free article] [PubMed] [Google Scholar]
- 35.Dubois J, Hertz-Pannier L, Cachia A, Mangin JF, Le Bihan D, Dehaene-Lambertz G. Structural asymmetries in the infant language and sensori-motor networks. Cereb Cortex. 2009;19(2):414–423. doi: 10.1093/cercor/bhn097. [DOI] [PubMed] [Google Scholar]
- 36.Broser P, Vargha-Khadem F, Clark CA. Robust subdivision of the thalamus in children based on probability distribution functions calculated from probabilistic tractography. Neuroimage. 2011;57(2):403–415. doi: 10.1016/j.neuroimage.2011.04.054. [DOI] [PubMed] [Google Scholar]
- 37.Toulmin H, Beckmann CF, O’Muircheartaigh J, et al. Specialization and integration of functional thalamocortical connectivity in the human infant. Proc Natl Acad Sci U S A. 2015;112(20):6485–6490. doi: 10.1073/pnas.1422638112. [DOI] [PMC free article] [PubMed] [Google Scholar]
- 38.Mukherjee P, Miller JH, Shimony JS, et al. Normal brain maturation during childhood: developmental trends characterized with diffusion-tensor MR imaging. Radiology. 2001;221(2):349–358. doi: 10.1148/radiol.2212001702. [DOI] [PubMed] [Google Scholar]
- 39.Keller SS, Gerdes JS, Mohammadi S, et al. Volume estimation of the thalamus using freesurfer and stereology: consistency between methods. Neuroinformatics. 2012;10(4):341–350. doi: 10.1007/s12021-012-9147-0. [DOI] [PMC free article] [PubMed] [Google Scholar]
- 40.Stiles J, Jernigan TL. The basics of brain development. Neuropsychol Rev. 2010;20(4):327–348. doi: 10.1007/s11065-010-9148-4. [DOI] [PMC free article] [PubMed] [Google Scholar]
- 41.Miller SP, McQuillen PS, Hamrick S, et al. Abnormal brain development in newborns with congenital heart disease. N Engl J Med. 2007;357(19):1928–1938. doi: 10.1056/NEJMoa067393. [DOI] [PubMed] [Google Scholar]
- 42.Paquette LB, Votava-Smith JK, Ceschin R, et al. Abnormal development of thalamic microstructure in premature neonates with congenital heart disease. Pediatr Cardiol. 2015;36(5):960–969. doi: 10.1007/s00246-015-1106-8. [DOI] [PMC free article] [PubMed] [Google Scholar]
- 43.Srinivasan L, Dutta R, Counsell SJ, et al. Quantification of deep gray matter in preterm infants at term-equivalent age using manual volumetry of 3-tesla magnetic resonance images. Pediatrics. 2007;119(4):759–765. doi: 10.1542/peds.2006-2508. [DOI] [PubMed] [Google Scholar]
- 44.Chau V, Synnes A, Grunau RE, Poskitt KJ, Brant R, Miller SP. Abnormal brain maturation in preterm neonates associated with adverse developmental outcomes. Neurology. 2013;81(24):2082–2089. doi: 10.1212/01.wnl.0000437298.43688.b9. [DOI] [PMC free article] [PubMed] [Google Scholar]
- 45.Birca A, Vakorin VA, Porayette P, et al. Interplay of brain structure and function in neonatal congenital heart disease. Ann Clin Transl Neurol. 2016;3(9):708–722. doi: 10.1002/acn3.336. [DOI] [PMC free article] [PubMed] [Google Scholar]
- 46.Berman JI, Hamrick SE, McQuillen PS, et al. Diffusion-weighted imaging in fetuses with severe congenital heart defects. AJNR Am J Neuroradiol. 2011;32(2):E21–22. doi: 10.3174/ajnr.A1975. [DOI] [PMC free article] [PubMed] [Google Scholar]
- 47.Donofrio MT, Bremer YA, Schieken RM, et al. Autoregulation of cerebral blood flow in fetuses with congenital heart disease: the brain sparing effect. Pediatr Cardiol. 2003;24(5):436–443. doi: 10.1007/s00246-002-0404-0. [DOI] [PubMed] [Google Scholar]
- 48.Sun L, Macgowan CK, Sled JG, et al. Reduced fetal cerebral oxygen consumption is associated with smaller brain size in fetuses with congenital heart disease. Circulation. 2015;131(15):1313–1323. doi: 10.1161/CIRCULATIONAHA.114.013051. [DOI] [PMC free article] [PubMed] [Google Scholar]
Associated Data
This section collects any data citations, data availability statements, or supplementary materials included in this article.


