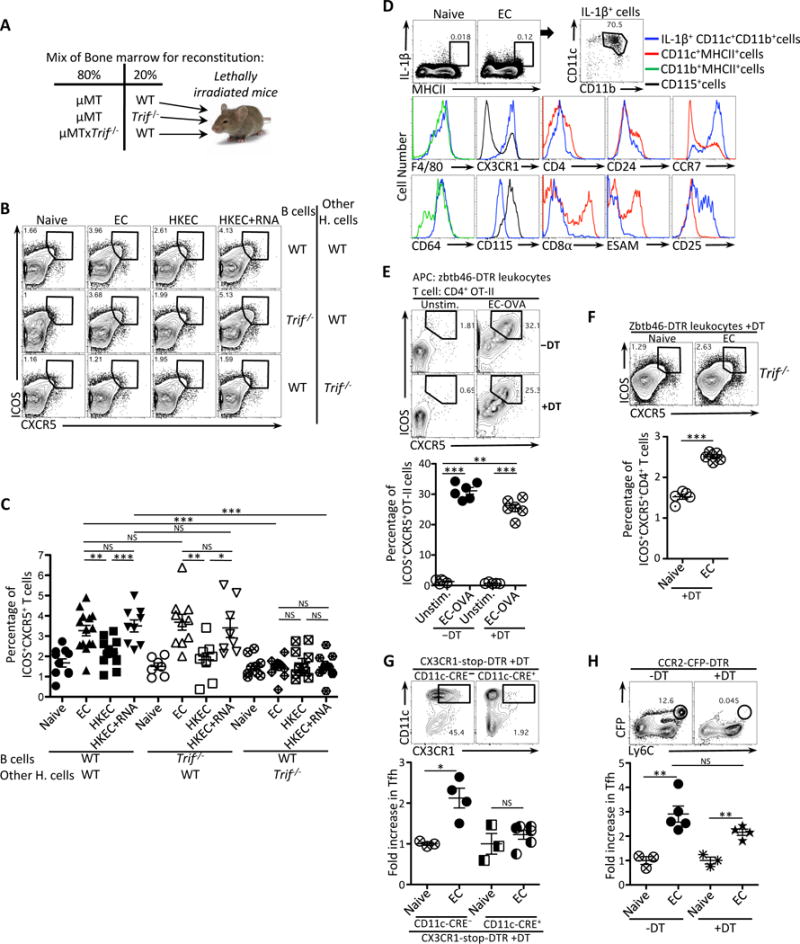
Figure 4. Tfh cell differentiation requires TRIF-mediated type-I interferon and inflammasome signals and CX3CR1+CCR2− monocytes.

(A) Experimental strategy to generate bone marrow chimeric mice.
(B, C) Flow cytometry dot plots (B) and percentages (C) of CXCR5+ICOS+CD4+ T cells in chimeric mice generated as in (A) and vaccinated with either 5×10⁷ live ThyA− EC, heat-killed ThyA− EC (HKEC), or HKEC+RNA(30μg).
(D) Flow cytometry analyses of splenic MHC-II+ cells stained intracellularly for IL-1β and for indicated surface markers in gated cell populations in naïve or vaccinated WT mice at 5 hours post-injection of live EC. Brefeldin A was injected at 1 hour post injection of live EC.
(E) Flow cytometry (upper panel) and percentages (lower panel) of CXCR5+ICOS+CD4+ T cells obtained in vitro after 4 days of co-culture of Zbtb46-DTR leukocytes and OVA-specific OT-II CD4+ T cells. DT was added at 100ng/ml to leukocytes 2 hours before infection with EC.
(F) Flow cytometry (upper panel) and percentages (lower panel) of CXCR5+ICOS+CD4+ T cells in vivo 7 days after vaccination with EC in Trif−/− mice that had been adoptively transferred with zbtb46-DTR leukocytes 26 hours before vaccination and treated with DT 2 hours later.
(G) Flow cytometry analyses of CD11c+CX3CR1+ cells in the spleen before and after depletion (upper panels). Fold increase of CXCR5+ICOS+CD4+ T cells in the spleens of DT-treated CX3CR1-stop-DTR (either CD11c-CRE− or CD11c-CRE+) 5 days after vaccination with EC (lower panel).
(H) Flow cytometry analyses of CFP+Ly6C+ monocytes in the spleens before and after depletion (upper panel). Fold increase of CXCR5+ICOS+CD4+ T cells in the spleens of PBS or DT treated CCR2-CFP-DTR mice 5 days after vaccination with EC (lower panel).
NS, not significant (P > 0.05); *, P<0.05; **, P≤0.01; ***, P≤0.001 (two-tailed unpaired t test). Data are mean±s.e.m. Numbers adjacent to outlined areas indicate percent of cells in gates. Each symbol represents an individual mouse. Mouse numbers are in (C) WT(WT B cells)(naive, n=11 ;+EC, n=14; +HKEC, n=12; +HKEC+RNA, n=9), WT(Trif−/− B cells)(naive, n=7 ;+EC, n=10; +HKEC, n=8; +HKEC+RNA, n=8) and Trif−/−(WT B cells)(naive, n=9 ;+EC, n=11; +HKEC, n=10; +HKEC+RNA, n=12); (F) naïve, n=5, +EC, n=5; (G) CCR2-CFP-DTR−DT(naïve, n=3, +EC, n=5) CCR2-CFP-DTR+DT(naïve, n=3, +EC, n=4); (H) CD11c-CRE−(naïve, n=3, +EC, n=4) CD11c-CRE+(naïve, n=3, +EC, n=6).
See also Figure S4
