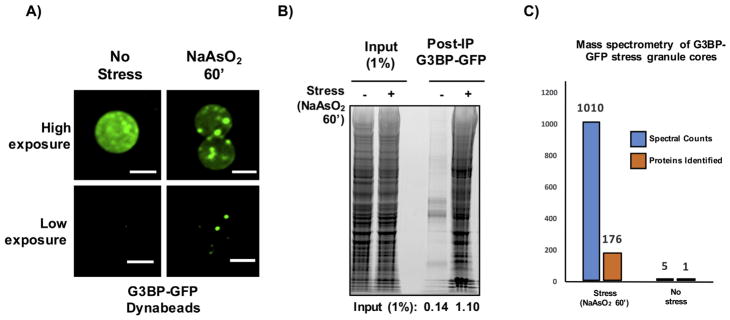
Fig. 4.
Expected results for mammalian stress granule core isolation. A) Representative images of Dynabeads following immunoprecipitation of G3BP-GFP using anti-GFP antibody. B) SYPRO Ruby staining following affinity purification of G3BP-GFP stress granule cores. Quantification is normalized to input and corrected for background using ImageJ. C) Mass spectrometry results of G3BP-GFP stress granule cores. Scale bars represent 2 μm.

