Abstract
Immunotherapy with PD-1 checkpoint blockade is effective in only a minority of patients with cancer, suggesting that additional treatment strategies are needed. Here we use a pooled in vivo genetic screening approach using CRISPR–Cas9 genome editing in transplantable tumours in mice treated with immunotherapy to discover previously undescribed immunotherapy targets. We tested 2,368 genes expressed by melanoma cells to identify those that synergize with or cause resistance to checkpoint blockade. We recovered the known immune evasion molecules PD–L1 and CD47, and confirmed that defects in interferon-γ signalling caused resistance to immunotherapy. Tumours were sensitized to immunotherapy by deletion of genes involved in several diverse pathways, including NF-κB signalling, antigen presentation and the unfolded protein response. In addition, deletion of the protein tyrosine phosphatase PTPN2 in tumour cells increased the efficacy of immunotherapy by enhancing interferon-γ-mediated effects on antigen presentation and growth suppression. In vivo genetic screens in tumour models can identify new immunotherapy targets in unanticipated pathways.
The notable clinical success of cancer immunotherapy using checkpoint blockade suggests that it is likely to form the foundation of curative therapy for many malignancies1,2. However, checkpoint blockade does not achieve sustained clinical response in most patients3 and additional immunotherapeutic strategies are therefore needed.
A small number of genes, such as PD-L1, that enable tumours to evade the immune system have been discovered and are the focus of intense clinical development efforts4–7. Although cancer cells could, in theory, express many more genes that regulate their response or resistance to tumour immunity, strategies to systematically discover such genes are lacking.
Loss-of-function genetic screens have increasingly been used to study the functional consequences of gene deletion in tumour cells8,9. These approaches include pooled genetic screens using CRISPR–Cas9-mediated genome editing that simultaneously test the role of a large number of genes on tumour cell growth, viability or drug resistance10. However, these screens have not been used to directly evaluate the role of tumour immunity11,12.
Here we use a pooled loss-of-function in vivo genetic screening approach that uses CRISPR–Cas9 genome editing to discover genes that increase sensitivity or cause resistance to immunotherapy in a mouse transplantable tumour model.
In vivo genetic screen recovers immune evasion genes
We developed a pooled genetic screening approach to identify genes that increase or decrease the fitness of tumour cells growing in vivo in animals treated with immunotherapy (Fig. 1a). First, we engineered the B16 melanoma cell line to express Cas9 (Extended Data Fig. 1a) and confirmed efficient DNA editing using small guide RNAs (sgRNAs) targeting PD-L1 (Extended Data Fig. 1g, top). Next, we created a library of lentiviral vectors encoding 9,872 sgRNAs targeting 2,368 genes from relevant functional classes that were expressed at detectable levels in the tumour cell line (Extended Data Fig. 1b). After transduction and in vitro passage to allow gene editing to take place, we transplanted the tumour cells into animals that were then treated with either a granulocyte-macrophage colony-stimulating factor (GM-CSF)-secreting, irradiated tumour cell vaccine (GVAX) or GVAX combined with PD-1 blockade using a monoclonal antibody against PD-1 to generate an adaptive immune response sufficient to apply immune-selective pressure on the tumour cells13–15 (Fig. 1b and Extended Data Fig. 1c). In parallel, we transplanted the library-transduced tumour cells into Tcra−/− mice, which lack CD4+ and CD8+ T cells and were therefore unable to apply adaptive immune-selective pressure on the tumours. After 12–14 days, we collected the tumours (Fig. 1b and Extended Data Fig. 1c) and compared the library representation in tumours from immunotherapy-treated wild-type animals to tumours growing in Tcra−/− mice (Extended Data Fig. 1d–f, h).
Figure 1. In vivo CRISPR–Cas9 screening recovers known mediators of immune evasion and resistance.
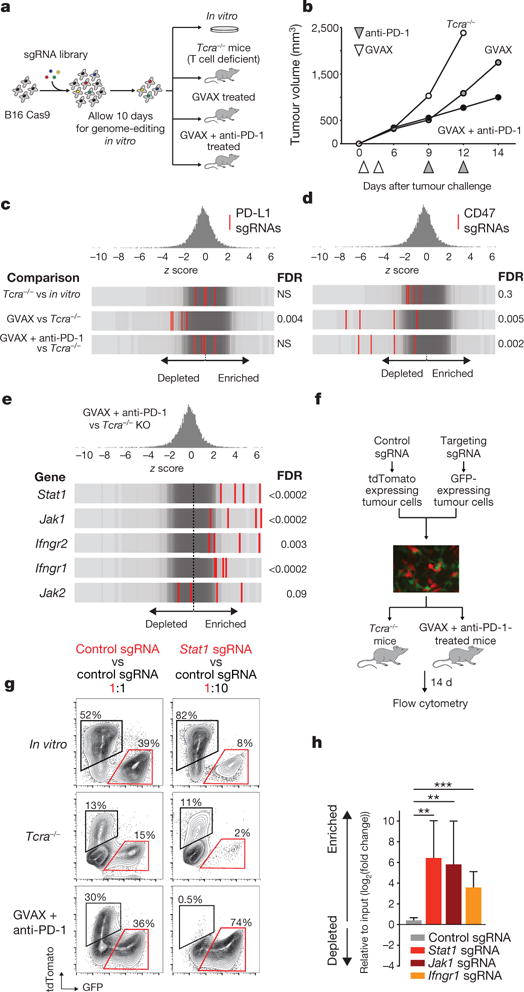
a, Diagram of screening system. b, Tumour volume averaged for groups indicated. n = 40 per group. c, Frequency histograms of enrichment or depletion (z score) for all sgRNAs. sgRNAs targeting indicated genes are shown by the red lines. d, Depletion of CD47-targeting sgRNAs. e, Enrichment of IFNγ pathway sgRNAs. f, Diagram of in vivo competition assay. g, Ratio of control:control and control:Stat1-null B16 cells for conditions indicated. h, Change in the ratios of B16 cells lacking the indicated genes in immunotherapy-treated mice compared with Tcra−/− mice. Data are mean ± s.e.m.; n = 8–10 mice per group). **P < 0.01; ***P < 0.001.
Inspection of the list of genes targeted by sgRNAs that are depleted from tumours treated with immunotherapy revealed the known immune evasion molecule PD-L1, indicating that loss of PD-L1 increased the sensitivity of tumour cells to immune attack. sgRNAs targeting PD-L1 were not depleted from tumours in Tcra−/− mice relative to cells growing in vitro, presumably owing to the absence of T-cell-mediated selective pressure (Fig. 1c), but were significantly depleted from tumours in wild-type mice treated with GVAX relative to Tcra−/− mice (false discovery rate (FDR) = 0.004). However, the depletion of PD-L1-targeting sgRNAs observed in GVAX-treated tumours was not found in tumours treated with GVAX and anti-PD-1, suggesting that loss of PD-L1 does not confer a selective disadvantage to tumours when PD-L1–PD-1 interactions are blocked (Fig. 1c).
We also found that sgRNAs targeting CD47, which enables immune evasion by impairing engulfment of tumours cells by phagocytes6, were markedly depleted in tumours treated with either GVAX or with GVAX and PD-1 blockade (FDR = 0.005, FDR = 0.002, respectively) (Fig. 1d and Extended Data Fig. 1g, bottom). To confirm that CD47-null tumours were more susceptible to GVAX and PD-1 blockade, we generated CD47-null B16 melanoma cells using transient transfection of a Cas9-sgRNA plasmid (Extended Data Fig. 2a) and found that loss of CD47 significantly improved control of tumour growth mediated by GVAX and anti-PD-1 immunotherapy (Extended Data Fig. 2b, P < 0.01). Therefore, in vivo genetic screening recovered genes known to confer immune evasion properties on cancer cells.
Defects in the IFNγ pathway induces resistance
We next analysed genes that, when deleted, become significantly enriched in immunotherapy-treated tumours, as these might represent resistance mechanisms. We observed that sgRNAs targeting five genes required for sensing and signalling through the IFNγ pathway (Stat1, Jak1, Ifngr2, Ifngr1 and Jak2) were significantly enriched in immunotherapy-treated mice (Fig. 1e; FDR < 0.09). We confirmed this finding in an in vivo competitive assay that compared the relative growth of mixtures of isogenic Stat1-null or control B16 cells in animals treated with immunotherapy (Fig. 1f). In wild-type mice treated with GVAX and anti-PD-1 immunotherapy, the relative proportion of Stat1-null cells increased significantly (Fig. 1g, h; P < 0.01, Student’s t-test), suggesting that Stat1-null cells have a marked growth advantage over wild-type tumour cells when under immune attack. Similar results were obtained for Jak1-null and Ifngr1-null cells (Fig. 1h). Consistent with this finding, tumours deficient in Stat1 or Ifngr1 (Extended Data Fig. 4a, c) grew significantly faster than wild-type tumours when treated with immunotherapy (Extended Data Fig. 2c; P < 0.05, Student’s t-test). Similar trends were observed for Jak1-null tumours (Extended Data Fig. 2c), and in the BrafV600E/Pten−/− (Braf/Pten) mouse melanoma line (J.L. et al., submitted). Mice injected with Braf/Pten melanoma cells deficient in Stat1, Jak1 or Ifngr1 (Extended Data Fig. 4b, d) had significantly larger tumours and shorter survival than mice with wild-type tumours when treated with PD-1 blockade (Extended Data Fig. 2d; P<0.05, Student’s t-test; P<0.0001, log-rank test). Therefore, the efficacy of immunotherapy in both melanoma models depends in part on the sensing of IFNγ by tumour cells.
We next sought to determine why IFNγ-pathway mutant tumours were resistant to immunotherapy. IFNγ-pathway-deficient B16 tumour cells had a significant growth advantage over wild-type tumour cells when exposed to IFNγ or IFNβ (Extended Data Fig. 2e, P <0.001, Student’s t-test). In addition, tumour cells deficient in Stat1, Jak1 or Ifngr1 failed to upregulate MHC-I presentation molecules after stimulation with IFNγ (Extended Data Fig. 2f). Indeed, co-culture of wild-type and Stat1-null tumour cells that had been engineered to express the model antigen ovalbumin (OVA) with antigen-specific OT-I CD8+ T cells resulted in a significantly larger fraction of Stat1-null B16 cells surviving relative to wild-type B16 cells (Extended Data Fig. 2g; P < 0.001, Student’s t-test), suggesting decreased sensitivity of Stat1-null tumour cells to the effects of cytotoxic T cells. Thus the screening platform recovered both known immune evasion molecules and mechanisms of resistance to immunotherapy.
Gene targets that increase efficacy of immunotherapy
Among the 50 most-depleted genes in immunotherapy-treated mice (all with an FDR < 0.08), we identified four prominent biological pathways. sgRNAs targeting genes involved in: (i) TNF signalling/NF-κB activation; (ii) antigen processing and presentation; (iii) inhibition of kinase signalling; or (iv) the ubiquitin-proteasome pathway were markedly depleted in mice treated with GVAX and PD-1 blockade (Fig. 2a) relative to growth in Tcra−/− mice. In many cases, multiple members of the same pathway (for example, Erap1, Tap2, Calr) or even the same multi-protein complex (for example, Rbck1, Rnf31, Birc2) were depleted under immune selective pressure, underscoring the importance of these diverse biological pathways.
Figure 2. Loss-of-function screening identifies targets that increase the efficacy of immunotherapy.
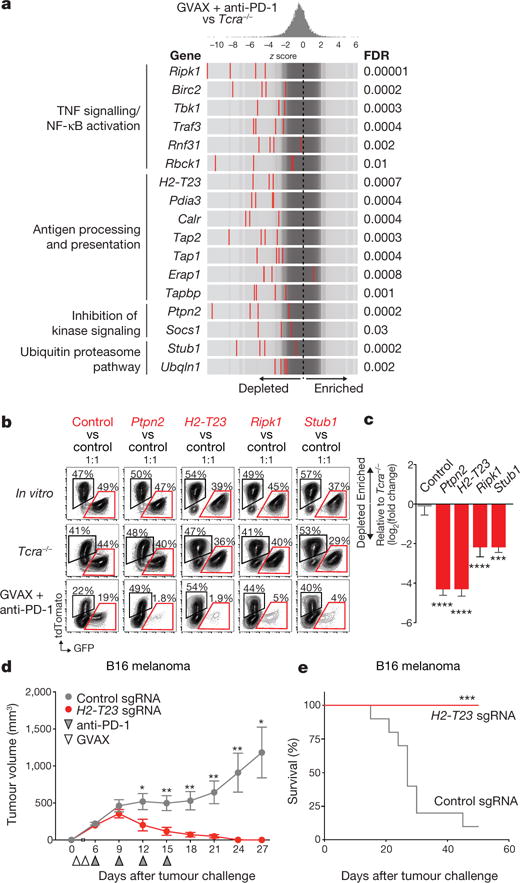
a, Frequency histograms of enrichment or depletion of sgRNAs targeting genes indicated. b, Competition assays of tumour cells lacking Ptpn2, H2-T23, Ripk1 or Stub1. c, Ratios of tumour cells lacking the indicated genes. n = 3–13 mice per group; representative of two independent experiments. d, e, Tumour volume (d) and survival analysis (e) of H2-T23-null (red) or control (grey) B16 tumours. Data are mean ± s.e.m.; n = 10 mice per group; representative of two independent experiments. *P < 0.05; **P < 0.01; ***P < 0.001; ****P < 0.0001.
We selected representative genes from each of these four groups to validate based on their highest cumulative score as ranked by the STARS algorithm (see Methods). These genes were Ptpn2, a phosphatase involved in multiple signalling processes; H2-T23, a non-classical MHC-I gene; Ripk1, a kinase that regulates cell death and inflammation; and Stub1, an E3 ubiquitin ligase involved in the regulation of the unfolded protein response. In vivo competition assays showed that tumour cells deleted of each of the four genes were strongly selected against in wild-type animals treated with immunotherapy, but grew at equivalent rates to control tumour cells in vitro and in Tcra−/− mice (Fig. 2b, c; P< 0.01, Student’s t-test). This suggests that loss of function of these genes renders tumour cells more sensitive to immunotherapy, but does not alter their cell growth or survival in the absence of T cells.
H2-T23 encodes Qa-1b (HLA-E in humans), a non-classical MHC molecule that binds the inhibitory receptor NKG2A on T cells and natural killer (NK) cells16. We confirmed that loss of function of Qa-1b enhanced the efficacy of immunotherapy by comparing the growth of H2-T23-null B16 melanoma cells (Extended Data Fig. 4g) to control B16 tumours in mice treated with GVAX and PD-1 blockade. Immunotherapy in control tumours eradicated only 1 out of 10 tumours. By contrast, immunotherapy of H2-T23-null tumours was curative in all 10 animals (Fig. 2d, e; P < 0.05, Student’s t-test). These results indicate that Qa-1b functions as an immune evasion molecule in tumours and that loss of function of H2-T23 improves tumour immunity.
Loss of Ptpn2 sensitizes tumours to immunotherapy
We next focused on Ptpn2, and confirmed that loss of Ptpn2 sensitized tumours to immunotherapy in in vivo competition assays with two additional sgRNAs (Extended Data Fig. 3a–c; P < 0.01, Student’s t-test; all sgRNAs shown). Ptpn2-null B16 tumours were significantly more sensitive to immunotherapy (Fig. 3a; P < 0.01, Student’s t-test; Extended Data Fig. 3d; P < 0.001, log-rank test), but did not show any growth disadvantage in the absence of T-cell-mediated immunity or immunotherapy (Extended Data Fig. 5a–d). Loss of Ptpn2 also increased sensitivity to T-cell immunity in the Braf/Pten melanoma model (Fig. 3b and Extended Data Fig. 4f), and the MC38 colon carcinoma model (Extended Data Fig. 5). Thus, loss of Ptpn2 sensitizes tumour cells to the effect of immunotherapy.
Figure 3. Deletion of Ptpn2 sensitizes tumours to immunotherapy.
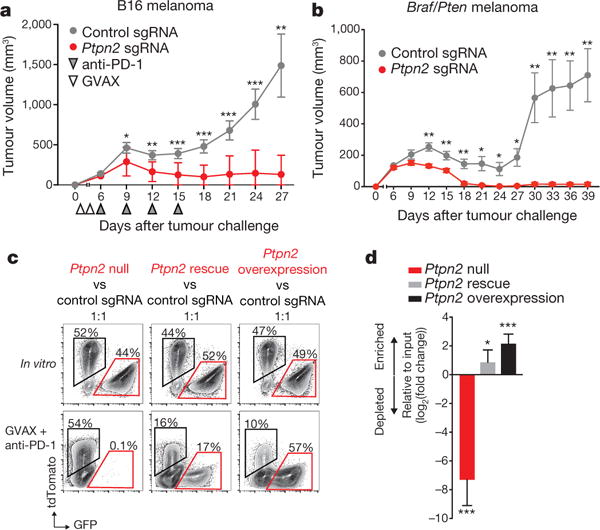
a, b, Tumour volume for control tumours or those with gene deletions as indicated in B16 melanoma (a; n = 20 animals per group; representative of three independent experiments) and Braf/Pten melanoma (b; n = 10 animals per group; representative of two independent experiments; data are mean ± s.e.m.). c, d, Flow plots (c) and change in ratios (d) of Ptpn2-null, Ptpn2 rescued or overexpressing B16 cells relative to control B16 cells. n = 5 animals per group. Data are mean ± s.d. *P < 0.05; **P < 0.01; ***P < 0.001.
Enforced expression of PTPN2 in Ptpn2-null tumour cells (that is, Ptpn2 rescue) abrogated the sensitivity to immunotherapy in vivo (Fig. 3c, d; P < 0.05, Student’s t-test), suggesting that off-target effects of gene editing were not likely to be the cause of the increased sensitivity. Moreover, overexpression of Ptpn2 in control B16 tumour cells (that is, Ptpn2 overexpression) led to an outgrowth of tumour cells in immunotherapy-treated mice (Fig. 3c, d; P < 0.001, Student’s t-test), indicating that increased Ptpn2 expression renders tumour cells resistant to the effect of immunotherapy.
To determine whether PTPN2 amplification was associated with immunotherapy resistance in human cancer, we examined exome-sequencing data from patients treated with blockade of PD-1, PD-L1 or CTLA-4. PTPN2 amplification occurred in 20 patients, but the majority of these events were chromosomal or arm-level amplifications. Focal amplification occurred in only two patients, a number too small to conclusively determine whether PTPN2 amplification results in a mechanism of resistance (Extended Data Fig. 6).
Ptpn2 loss increases antigen presentation by tumours
To identify the mechanisms by which loss of Ptpn2 enhanced the efficacy of immunotherapy, we compared the composition of immune cell subsets in the tumour microenvironment of control and Ptpn2-null tumours using flow cytometry. We observed no difference in the total number of CD45+ cells, NK cells, CD4+ T cells, FoxP3+ regulatory T cells, or cells in the myeloid compartment in Ptpn2-null tumours relative to wild-type tumours (Fig. 4a and Extended Data Figs 7a–d, 8a, b). However, Ptpn2-null tumours contained a significantly greater number of CD8+ T cells and γδ+ T cells (Fig. 4a; P < 0.05, Student’s t-test). We confirmed this observation with immunohistochemistry staining and found a threefold increase in the number of CD8α+ cells, which diffusely infiltrated Ptpn2-deficient tumours (Fig. 4b; P < 0.01, Student’s t-test) treated with immunotherapy. Further flow cytometry analysis revealed that Ptpn2-null tumours contained an increased fraction of CD8+ T cells expressing granzyme B (Fig. 4c; P < 0.01, Student’s t-test). Thus, Ptpn2 loss increased the number of activated, cytotoxic CD8+ T cells in tumours.
Figure 4. Deletion of Ptpn2 improves antigen presentation and T cell stimulation.
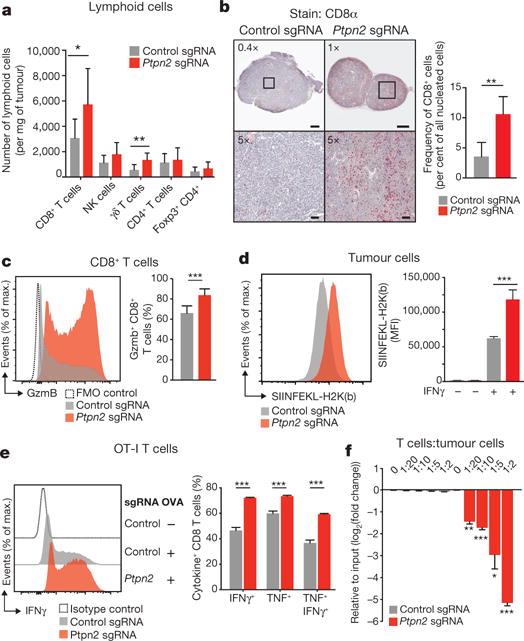
a, Quantification of immune cells in Ptpn2-null (red) or control (grey) B16 tumours. n = 8-10 animals per group; data from two experiments. b, Immunohistochemistry for CD8α in control or Ptpn2-null tumours. n = 4-5 animals per group. c, Granzyme B (Gzmb) expression by CD8+ T cells in Ptpn2-null or control B16 tumours. n = 8-10 animals per group; data from two experiments. d, SIINFEKL-H2K(b) presentation by Ptpn2-null or control B16 cells. MFI, mean fluorescence intensity. e, Intracellular IFNγ and TNF staining in CD8+ T cells after restimulation with Ptpn2-null or control B16 cells. f, Ratios of B16 cells lacking the indicated genes after co-culture with antigen-specific T cells. n = 3; representative of two independent experiments. Data are mean ± s.d. *P <0.05; **P< 0.01; ***P< 0.001.
We reasoned that the increase in number of cytotoxic CD8+ T cells in Ptpn2-null tumours could be due to improved recognition of tumour cells through increased antigen presentation. To test this, we expressed full-length OVA in Ptpn2-null or control B16 cells. Staining with a monoclonal antibody specific to the SIINFEKL epitope from OVA in the context of H2K(b) was significantly higher in Ptpn2-null cells, suggesting that loss of Ptpn2 increased the levels of antigen-loaded MHC-I on the surface of tumour cells (Fig. 4d; P <0.001, Student’s t-test). Additionally, Ptpn2-deficient cells had increased total MHC-I after treatment with IFNγ compared with control cells (Extended Data Fig. 9a; P< 0.01, Student’s t-test).
To test whether loss of Ptpn2 made tumour cells more recognizable to T cells, we cultured OVA-expressing Ptpn2-null or control cells with OT-I CD8+ T cells that recognize the SIINFEKL epitope. T cells cultured with Ptpn2-null OVA-B16 cells were significantly more activated as measured by intracellular IFNγ and TNF staining (Fig. 4e; P < 0.001, Student’s t-test). To test whether Ptpn2-null tumour cells were more sensitive to the presence of T cells, we co-cultured mixed populations of OVA-expressing Ptpn2-null or wild-type B16 cells with antigen-specific CD8+ T cells for six days. Ptpn2-deficient tumour cells were preferentially depleted from the co-culture (Fig. 4f; P< 0.05, Students t-test). Thus, loss of Ptpn2 in tumour cells increased antigen presentation and sensitivity to cytotoxic CD8+ T cells.
Loss of Ptpn2 increases IFNγ sensing by tumour cells
Ptpn2 negatively regulates IFNγ signalling by dephosphorylating JAK1 and STAT1 (refs 17, 18). We tested whether Ptpn2 loss sensitized tumours to immunotherapy by increasing IFNγ signalling. We first assayed STAT1 activity in Ptpn2-null cells in response to IFNγ stimulation. Ptpn2-null B16 cells showed increased phosphorylated (p-)STAT1 after treatment with IFNγ while overexpression of Ptpn2 repressed this phosphorylation (Fig. 5a).
Figure 5. Deletion of Ptpn2 sensitizes tumours to IFNγ.
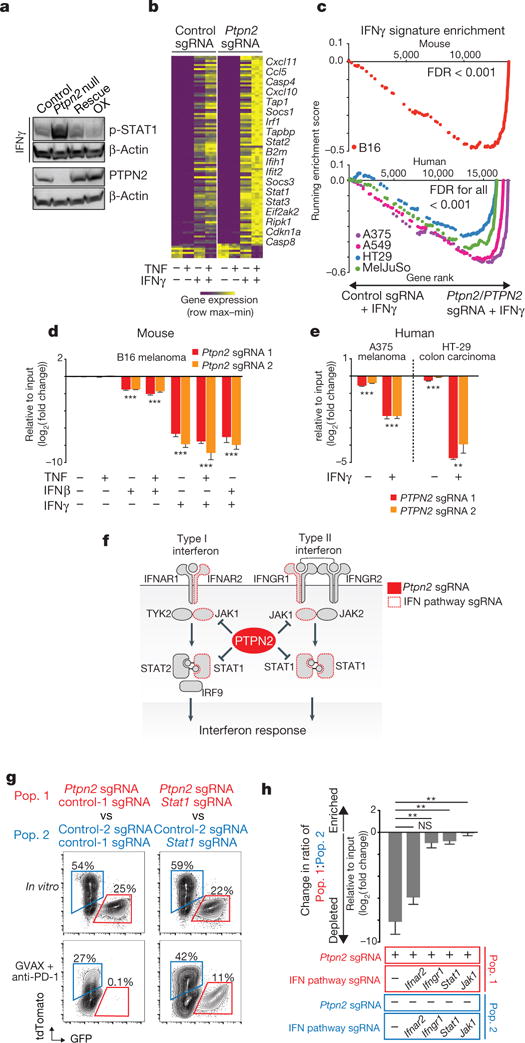
a, p-STAT1 after IFNγ treatment of control, Ptpn2-null, rescued or overexpressing (OX) B16 cells. For western blot source data, see Supplementary Fig. 1. b, IFNγ response gene expression in Ptpn2-null or control B16 cells. c, Gene set enrichment analysis of IFNγ response genes in mouse and human tumour cell lines. d, e, Ratios of mouse (d) or human (e) tumour cells with the indicated sgRNA cultured with the indicated cytokines. n = 3 replicates; representative of two independent experiments. Data are mean ± s.d. f, Diagram of the type I and type II interferon pathway. g, Flow cytometry plots showing frequencies of Stat1/Ptpn2 double-null cells versus Stat1-null cells (right) and Ptpn2-null cells versus control cells (left) in the condition indicated. n = 5 mice per group. h, Change in ratio of Stat1/Ptpn2 double-null cells versus Stat1-null cells and Ptpn2-null cells versus control cells in the condition indicated. **P < 0.01; ***P < 0.001; NS, not significant.
Transcriptional analysis of the Ptpn2-null and control B16 tumour cells exposed to IFNγ, TNF or both indicated that loss of Ptpn2 caused a marked change in the expression profile of IFNγ response genes following IFNγ exposure, but did not change gene expression in unstimulated conditions or after TNF stimulation alone (Fig. 5b; Supplementary Information 2). Co-stimulation of IFNγ and TNF had a synergistic effect on Ptpn2-null cells, because IFNγ stimulation appeared to sensitize B16 cells to TNF (Extended Data Fig. 9b). Loss of function of PTPN2 in four human tumour cell lines also increased expression of IFNγ response genes following stimulation with IFNγ (Fig. 5c; FDR < 0.001). Several T cell chemokines were upregulated in Ptpn2-null cells (Cxcl9, Cxcl10, Cxcl11 and Ccl5; Fig. 5b), which might increase infiltration of T cells into tumours. Members of the antigen processing and presentation pathway, such as Tap1, Tapbp and B2m were also upregulated in Ptpn2-null cells (Fig. 5b), consistent with our previous observation of enhanced antigen presentation in Ptpn2-deficient cells.
Cell-cycle regulators such as Cdkn1a and several genes involved in apoptosis, such as Casp4, Casp8, Ifit2, Ripk1 and Bak1 were significantly upregulated in Ptpn2-null tumour cells treated with cytokines relative to wild-type tumour cells. Consistent with this finding, exposure to IFNγ alone or in combination with IFNβ or TNF significantly reduced the growth of Ptpn2-null mouse (Fig. 5d; P < 0.001, Student’s t-test) and human (Fig. 5e; P< 0.01, Students t-test) tumour cell lines in vitro relative to wild-type tumour cells. These results demonstrate that IFNγ alone is sufficient to cause a growth disadvantage in both mouse and human tumour cells that lack Ptpn2/PTPN2.
Sensitivity of Ptpn2-null tumours depends on IFNγ
To determine whether the mechanism of increased immunotherapy sensitivity of Ptpn2-null tumour cells depends on IFNγ sensing and signalling, we generated B16 tumour cell lines in which Ptpn2 had been knocked out and Stat1, Jak1, Ifngr1 or Ifnar2 had also been knocked out (Fig. 5f). We then tested the growth of these double-null cells relative to tumour cells lacking only Stat1, Jak1, Ifngr1 or Ifnar2 in animals treated with GVAX and anti-PD-1 immunotherapy. Loss of Ptpn2 alone was associated with a significant growth disadvantage in the presence of immunotherapy as expected (Fig. 5g, h). However, simultaneous loss of function of any of the genes necessary for the sensing of IFNγ abolished the growth disadvantage of Ptpn2-null cells (Fig. 5g, h; P < 0.01, Student’s t-test). Loss of Ifnar2, a gene that senses type I interferon, did not abrogate the sensitivity of Ptpn2-null tumours to GVAX and anti-PD-1 immunotherapy (Fig. 5h). This genetic epistasis experiment indicates that in tumour cells that are unable to respond to IFNγ signalling, Ptpn2 deficiency cannot sensitize tumour cells to immunotherapy. Thus, the mechanism by which Ptpn2 deficiency sensitizes tumour cells to immunotherapy is dependent on the sensing of IFNγ.
Discussion
We used pooled loss-of-function genetic screens in vivo to discover multiple genes in diverse biological processes that sensitize tumours to immunotherapy, providing a new approach for immuno-oncology target discovery. Deletion of Ptpn2 markedly increased the response of tumours to immunotherapy. Ptpn2 encodes a protein tyrosine phosphatase that regulates a range of intracellular processes, including IFNγ signalling, which it can inhibit by dephosphorylating STAT1 and JAK1 (refs 17–21). Loss of Ptpn2 in tumour cells increased IFNγ signalling and antigen presentation to T cells, and amplified growth arrest in response to cytokines, suggesting that its therapeutic inhibition may potentiate the effect of immunotherapies that invoke an IFNγ response.
Loss of function of Qa-1b (the non-classical MHC molecule encoded by H2-T23, or HLA-E in humans) increased sensitivity of tumour cells to immune attack. The function of Qa-1b/HLA-E in tumour immunity has been unclear, because it can bind to both activating and inhibitory receptors expressed by T cells and NK cells16,22, and because it has been variously reported to be associated with good or bad clinical outcomes23,24. Loss of function of Qa-1b may increase the immune response to tumours by de-repression of T- or NK-cell function25,26 or by limiting the stimulation of CD8+ T regulatory cells27, either of which would make blockade of HLA-E an attractive immunotherapeutic approach.
Tumours were also sensitized to immunotherapy by deletion of Ripk1, as well as by loss of function of members of the linear ubiquitin assembly complex (LUBAC), Birc2, Rbck1 or Rnf31, that responsible for ubiquitination and stabilization of the signalling complex that includes Ripk1. Ripk1 has a complex role in the response to inflammation, including activation of NF-κB-mediated survival pathways28. Strategies to alter the stability of Ripk1 in tumours may provide additional therapeutic avenues to enhance tumour immunity.
Functional genomic approaches using genome editing have to date focused on identifying genes required by tumour cells for the cancer hallmarks of growth, metastasis and drug resistance11,12,29. Our study extends this approach to interrogate the interaction of the tumour cell with the immune system. We anticipate that it can be broadly applied to systematically define genes that govern interactions between cancer cells and the immune system.
METHODS
In vivo CRISPR screening in B16 tumour cells
We created a Cas9-expressing version of the B16 melanoma cell line and confirmed that it could edit DNA efficiently with CRISPR using sgRNAs targeting the PD-L1 gene. For screening the B16-Cas9 cell line, we created a library of 9,992 optimized sgRNAs targeting 2,398 genes, which were selected from the Gene Ontology (GO) term categories: kinase, phosphatase, cell surface, plasma membrane, antigen processing and presentation, immune system process, and chromatin remodelling. The transcript abundance of the genes in these categories were then filtered to include only those that were expressed > RPKM(log2) = 0.9. These genes were then ranked for expression in the B16 cell line using RNA-sequencing to select for the top 2,398 expressed genes. The library was divided into four sub-pools, each containing one sgRNA per gene and 100 non-targeting control sgRNAs. The four sub-pools were screened individually and sgRNAs were delivered to B16-Cas9 cells via lentiviral infection at an infection rate of 30%. Transduced B16 cells were purified using an hCD19 reporter by positive magnetic selection (Miltenyi) and then expanded in vitro before being implanted into animals. For each sub-pool, B16 cells were implanted into 10 Tcra−/− mice, 10 wild-type mice treated with GVAX, and 10 wild-type mice treated with GVAX and PD-1 blockade (see below for treatment protocols). B16 cells transduced with libraries were also grown in vitro at approximately 2,000× library coverage for the same time period as the animal experiment. Mice were euthanized 12–14 days after tumour implantation and tumour genomic DNA was prepared from whole tumour tissue using the Qiagen DNA Blood Midi kit. PCR was used to amplify the sgRNA region and sequencing to determine sgRNA abundance was performed on an Illumina HiSeq. Significantly enriched or depleted sgRNAs from any comparison of conditions were identified using the STARS algorithm31.
Cell lines
B16F10 melanoma and B16-GM-CSF were a gift from G. Dranoff. Braf/Pten melanoma were from D.E.F. MC38 colon carcinoma cells was a gift from A. Sharpe. A375 melanoma, A549 lung carcinoma and HT-29 colon carcinoma cells were purchased from ATCC. MelJuSo melanoma cells was a gift from the Cancer Cell Line Encyclopedia (Broad Institute). B16, MC38, A549 and HT-29 cells were all grown in DMEM (Gibco) with 10% fetal bovine serum (Gemini biosciences) and antibiotics. A375 and MelJuSo cells were grown in RPMI 1640 (Gibco) with 10% fetal bovine serum and antibiotics. All cell lines were subject to periodic testing for mycoplasma using the LookOut Mycoplasma PCR detection kit (Sigma).
Animal treatment and tumour challenges
The designs of these animal studies and procedures were approved by the Dana-Farber Cancer Institute IACUC committee. Dana-Farber Cancer Institute’s specific-pathogen free facility was used for the housing and care of all mice. Seven-week old wild-type female C57BL/6J mice were obtained from Jackson laboratories. A colony of B6.129S2-Tcratm1Mom/J (Tcra−/−) T cell-deficient mice were bred on site. Mice were age-matched to be 7–12 weeks old at the time of tumour inoculation. For screening, 2.0 × 10⁶ library-transduced B16-Cas9 cells resuspended in Hanks Balanced Salt Solution (Gibco) were mixed 1:1 by volume with Matrigel (Corning) and subcutaneously injected into the right flank on day 0. Mice were vaccinated with 1.0 × 10⁶ GM-CSF-secreting B16 (GVAX) cells (provided by G. Dranoff) that had been irradiated with 3,500 Gy on days 1 and 4 to elicit an anti-tumour immune response. Subsequently, mice were treated with 100 μg of rat monoclonal anti-PD1 (clone: 29F.1A12) on days 9 and 12 via intraperitoneal injection. For validation assays, 1.0 × 10⁶ tumour cells were subcutaneously injected into the right flank without Matrigel. Tumours were measured every three days beginning on day 6 after challenge until time of death. Death was defined as the point at which a progressively growing tumour reached 2.0 cm in the longest dimension. Measurements were taken manually by collecting the longest dimension (length) and the longest perpendicular dimension (width). Tumour volume was estimated with the formula: (L × W2) / 2.CO2 inhalation was used to euthanize mice on the day of euthanasia. Optimal group sizes were determined empirically. Researchers were not blinded to group identity and randomization of animal groups was done when appropriate.
Creation of CRISPR-edited tumour cell lines
Transient transfection of the Cas9-sgRNA plasmid (pX459, Addgene) was used to edit B16 and Braf/Pten melanoma cell lines. pX459 was digested with the enzyme Bpil (Thermo Fisher Scientific) as per the manufacturer’s instructions and sgRNA oligos were cloned into the plasmid using standard molecular cloning. For B16 cells, 5 × 10⁵ cells were plated in a well of a six-well plate and were transfected the following day using 2 μg of pX459 plasmid DNA and Turbofect (3:1 ratio, Thermo Fisher Scientific). After 24 h of transfection, transfectants were selected in puromycin (6 μg ml−1, Thermo Fisher Scientific). For Braf/Pten melanoma cells, 5 × 10⁵ cells were plated in a well of a six-well plate and were transfected the following day using 4 μg of pX459 plasmid DNA and Turbofect (3:1 ratio). After selection, cells were grown for 14 days in vitro before being implanted into mice.
In vivo competition assays
B16 cells were engineered to express GFP or tdTomato by lentiviral transduction to differentiate populations. Cas9-target sgRNA-transfected cells and Cas9-control sgRNA-transfected cells were mixed and then grown for at least two passages in vitro before implantation into mice. Mixes were analysed by flow cytometry on the day of tumour inoculation. Mice were euthanized 15–21 days after tumour inoculation for tumour collection. Tumours were macerated on ice and incubated in collagenase P (2 mg ml−1, Sigma-Aldrich) and DNase I (50 μg ml−1, Sigma-Aldrich) supplemented DMEM for 10 min at 37 °C. After incubation, tumour cells were passed through 70-μm filters to remove undigested tumour. Tumour cells were washed with ice-cold MACS medium and stained with Near-IR Live/Dead (1:1,000, BD Biosciences) for 10 min on ice. Tumour cells were then washed and resuspended in ice-cold PBS with 2% FBS. An Accuri C6 flow cytometry system (BD Biosiences) was used to analyse final GFP:tdTomato tumour cell ratios.
In vitro cytokine stimulations
Differentially labelled B16 cells were plated in 12-well plates in DMEM + 10% FBS containing the indicated combinations of cytokines: TNFα (10ng ml−1, PeproTech), IFNγ (100ng ml−1, Cell Signaling) and IFNβ (1,000 U ml−1, Pbl Assay Science). Cells were passaged every three or four days. On day 14, tumour cells were analysed by flow cytometry for changes in the ratio of GFP+:tdTomato+ cells.
In vitro T cell killing assays
Differentially labelled, ovalbumin-expressing B16 cells were plated onto 12-well plates in DMEM + 10% FBS containing IFNβ at 50 U ml−1. The following day, medium was removed and RPMI + 10% FBS was added containing preactivated OT-I T cells at the indicated ratio. Tumour cells were passaged and fresh OT-I T cells were added every two days until day 6. On day 6, tumour cells were analysed by flow cytometry for changes in the ratio of GFP+:tdTomato+ cells.
Analysis of tumour-infiltrating lymphocytes by flow cytometry
Mice were injected subcutaneously with 1.0 × 10⁶ CRISPR–Cas9 modified B16 cells and treated with GVAX and anti-PD-1, as above. Tumours were collected on day 12–13, weighed, mechanically diced, incubated with collagenase P (2 mg ml−1, Sigma-Aldrich) and DNase I (50 μg ml−1, Sigma-Aldrich) for 10 min, and pipetted into a single-cell suspension. After filtering through a 70-μm filter, cells were blocked with anti-mouse CD16/32 antibody (BioLegend) and stained with indicated antibodies for 30 min on ice. Dead cells were excluded using Aqua Live/Dead (1:1,000, ThermoFisher Scientific) added concurrently with surface antibodies. After washing, cells were fixed with Foxp3/Transcription Factor Staining Buffer Set (eBiosciences) as per manufacturer’s instructions, blocked with mouse and rat serum, then stained with intracellular antibodies. Spherotech AccuCount Fluorescent particles were added for cell quantification before analysis on an LSR Fortessa using single-colour compensation controls and fluorescence-minus-one thresholds to set gate margins. Comparisons between groups were performed using Student’s t-tests.
Flow cytometry analysis of B16 tumour cells
B16 cells were trypsinized and washed in PBS + 2% FBS, stained with antibodies against cell surface proteins as per the manufacturer’s instructions and then analysed on an Accuri C6 flow cytometry system.
Restimulation of T cells on B16 tumour cells
OT-I T cells were isolated from the spleens of OT-I T cell receptor transgenic mice using the CD8α+ T cell isolation mouse kit (Miltenyi), as per manufacturer’s instructions. Purified OT-I T cells were then stimulated in 24-well plates with plate-bound anti-mouse CD3ε (2 μg ml−1, BD Biosciences), soluble anti-mouse CD28 (2 μg ml−1, BD Biosciences) and recombinant human IL-2 (100 U ml−1, DFCI supply centre). After 48 h, activated OT-I T cells were transferred into fresh media containing recombinant human IL-2 and allowed to expand for 5–7 days. For restimulation, 1 × 10⁵ OVA-expressing Ptpn2-null or control sgRNA-transfected B16 tumour cells were first plated in 24-well plates and stimulated with recombinant mouse IFNγ overnight to induce ovalbumin surface expression. 1 × 10⁶ pre-activated OT-I T cells were then added to the wells on the next day and co-cultured with the B16 tumour cells for 2–3 h. Subsequently, 1× brefeldin (eBiosciences) was added to the cultures for 4 h to inhibit intracellular protein transport. Afterward, OT-I T cells were collected from each well, stained for surface markers and then fixed with Foxp3/Transcription Factor Staining Buffer Set (eBiosciences) as per the manufacturer’s instructions. Intracellular cytokine staining was then performed before analysis on an LSR Fortessa.
RNA-sequencing analysis of tumour cells
Ptpn2-null or control sgRNA-transfected B16 cells were stimulated with IFNγ (100ng ml−1, Cell Signaling Technology), TNFα (10 ng ml−1, Peprotech) or both for 48 h. RNA was extracted from cell pellets using the Qiagen RNeasy Mini kit according to the manufacturer’s instructions. First-strand Illumina-barcoded libraries were generated using the NEB RNA Ultra Directional kit according to the manufacturer’s instructions, including a 12-cycle PCR enrichment. Libraries were sequenced on an Illumina NextSeq 500 instrument using paired-end 37 bp reads. Data were trimmed for quality using the Trimmomatic pipeline with the following parameters: LEADING:15 TRAILING:15 SLIDINGWINDOW:4:15 MINLEN:16. Data were aligned to mouse reference genome mm10 using Bowtie2. HTSeq was used to map aligned reads to genes and to generate a gene count matrix. Normalized counts and differential expression analysis was performed using the DESeq2 R package. We performed gene set enrichment analysis, as described previously32,33.
Western blotting
Whole cell lysates were prepared in lysis buffer (60 mM Tris HCl, 2% SDS, 10% glycerol, complete EDTA-free protease inhibitor (Roche)) and 500 U ml−1 benzonase nuclease (Novagen). Samples were boiled at 100 °C and clarified by centrifugation. Protein concentration was measured with a BCA protein assay kit (Pierce). Subsequently, 50–150 μg of protein was loaded on 4–12% Bolt Bis-Tris Plus gels (Life Technologies) in MES buffer (Life Technologies). Protein was transferred to 0.45-μm nitrocellulose membranes (Bio-Rad). Membranes were blocked in Tris-buffered saline plus 0.1% Tween 20 (TBS-T) containing 5% nonfat dry milk for 1 h at room temperature followed by overnight incubation with primary antibody at 4 °C. Membranes were washed with TBS-T and incubated with HRP-conjugated secondary antibodies for 1 h at room temperature. HRP was activated with Supersignal West Dura Extended Duration Substrate (Pierce) and visualized with a chemiluminscent detection system using Fuji ImageQuant LAS4000 (GE Healthcare Life Sciences). Blots were then analysed using ImageJ and Adobe Photoshop software.
Immunohistochemistry
Whole B16 tumours were fixed for 24 h in 10% neutral-buffered formalin and then permeabilized in 70% ethanol overnight. Fixed tissue was subsequently embedded into paraffin, sectioned and then mounted onto slides for staining against mouse CD8α (eBiosciences, 14-0808-82). Slides were imaged on a Leica Scanscope XT and analysed using Aperio software.
Exome-sequencing analysis
All human studies were conducted in accordance with the Declaration of Helsinki and approved by the Dana-Farber Cancer Institute Institutional Review Board (Protocols 11-104, 02-180, 09-472, 02-021, 15-330). Informed consent was obtained from all subjects. Electronic medical charts were reviewed to assess best response by RECIST (version 1.1), duration of progressionfree survival, duration of overall survival, patient demographic characteristics and other relevant clinical details (for example, smoking history). Patients from the Dana-Farber Cancer Institute with metastatic bladder cancer, head and neck squamous cell carcinoma, lung cancer and melanoma treated with anti-PD-1, anti-PD-L1, anti-CTLA-4, or a combination of these therapies were identified, and pre-treatment tumour tissue and matched germline blood were obtained for exome sequencing. Copy-number alterations were called using a circular binary segmentation method34. Called copy-number ratio was corrected for tumour purity and ploidy using ABSOLUTE. A threshold of log2(copy ratio) > 0.5 was used to call amplifications. The amplified region containing PTPN2 for each tumour that was shown to be amplified was manually examined to determine whether the amplification was part of a chromosome-level, arm-level or focal amplification event. Patients were stratified by clinical benefit using the metric published previously35. In brief, patients with clinical benefit had a complete response or partial response by RECIST (version 1.1) or stable disease with overall survival exceeding one year. Patients with no clinical benefit had progressive disease as best response by RECIST or stable disease with overall survival less than one year. A third group of patients with PD but overall survival exceeding two years were called long-term survival with no clinical benefit.
Antibodies
For western blotting, primary antibodies against STAT1 (9172, Cell Signaling), JAK1 (3332 and 3344 (clone 6G4), Cell Signaling), p-STAT1 (Tyr701) (clone D4A7, Cell Signaling), β-actin (8227, Abcam), TC-TPT (PTPN2) (180764, Abcam) and Flag (clone M2, Sigma-Aldrich) were used. Peroxidase-conjugated secondary antibodies against rabbit IgG (111-035-046) and mouse IgG (115-035-174) were purchased from Jackson Laboratories.
For flow cytometry, the following anti-mouse fluorochrome-conjugated antibodies were used: H2K(b)/H2D(b) (clone 28-8-6, BioLegend), CD47 (clone miap301, BioLegend), SIINFEKL-H2K(b) (clone 25-D1.16, BioLegend), granzyme B (clone GB11, BioLegend), TNF (clone MP6-XT22, BioLegend), IFNγ (clone XMG1.2, BioLegend), CD8α (clone 53-6.7, BioLegend), CD4 (clone RM4-5 or GK15, BioLegend), TCRβ (clone H57-597, BioLegend), PD-1 (clone RPMI-30, BioLegend), Tim-3 (clone TMR3-2.3, BioLegend), CD45 (clone 104 or 30-F11, BioLegend), Ly6C (clone HK1.4, BioLegend), I–A/I–E (clone M5/114.15.2, BioLegend), F4/80 (clone BM8, BioLegend), CD11c (clone N418, BioLegend), CD24 (clone M1/69, BioLegend), CD11b (clone M1/70, BioLegend), CD103 (clone 2E7, BioLegend), CD3ε (clone 145-2C11, BioLegend), TCRγ/δ (clone GL3, BioLegend), NK1.1 (clone PK136, BioLegend), CD44 (clone IM7, BioLegend), Ki-67 (clone B56, BD Biosciences), CD274 (clone MIH5, BD Biosciences), IFNGR1 (clone 2E2, Life Technologies), IFNAR2 (R&D Systems; FAB1083A), FOXP3 (clone JFK-16 s, eBioscience).
CRISPR sgRNA sequences
Gene name, sgRNA number and sequence were as follows: Cd274 sgRNA1, GCCTGCTGTCACTTGCTACG; Cd274 sgRNA2, AATCAACCAGAGAATTTCCG; Cd274 sgRNA3, GGTCCAGCTCCCGTTC TACA; Cd274 sgRNA4, GTATGGCAGCAACGTCACGA; Cd47 sgRNA1, TATAGAGCTGAAAAACCGCA; Cd47 sgRNA2, CCACATTACGGACGA TGCAA; Cd47 sgRNA3, TCTTACGAGGAGGAGAAAGG; Cd47 sgRNA4, GCAAGTGTAGTTTCCCACCA; Stat1 sgRNA1, GATCATCTACAACTGTCTGA; Stat1 sgRNA2, GTACGATGACAGTTTCCCCA; Jak1 sgRNA1, CAGCGGAGAGTATACAGCCG; Jak1 sgRNA2, GTACTCACTGCACTCCTGGG; Ifngr1 sgRNA1, CGACTTCAGGGTGAAATACG; Ifngr1 sgRNA2, GGTATTCCCAGCATACGACA; Ptpn2 sgRNA1, CCATGACTATCCTCATAGAG; Ptpn2 sgRNA2, TCATTCACAGAACAGAGTGA; Ptpn2 sgRNA3, ATGTGCACAGTACTGGCCAA; Ifnar2 sgRNA1, GTACCAGAGGGTG TAGTTAG; Ifnar2 sgRNA2, ACACAAGCTGAGGAGACCGA; H2-T23 sgRNA1, TAGCCGACAATGATGAACCG; H2-T23 sgRNA2, AGGCCT CCTGACAATACCCG; H2-T23 sgRNA3, GGAACTTCAGAGTAAACCTG; Stub1 sgRNA1, GCATTGCTAAGAAGAAGCGC; Ripk1 sgRNA1, CACCGTAC ACGTCCGACTTCTCCG; control sgRNA1, GCGAGGTATTCGGCTCCGCG; control sgRNA2, GCTTTCACGGAGGTTCGACG; control sgRNA3, ATGTTG CAGTTCGGCTCGAT; control sgRNA4, ACGTGTAAGGCGAACGCCTT; control sgRNA5, ATTGTTCGACCGTCTACGGG; human PTPN2 sgRNA1, TTCGAACTCCCGCTCGATGG; human PTPN2 sgRNA2, CCATGACTA TCCTCATAGAG.
Data availability
All data presented in this manuscript are available from the corresponding author upon reasonable request.
Extended Data
Extended Data Figure 1. Analysis of screen performance.
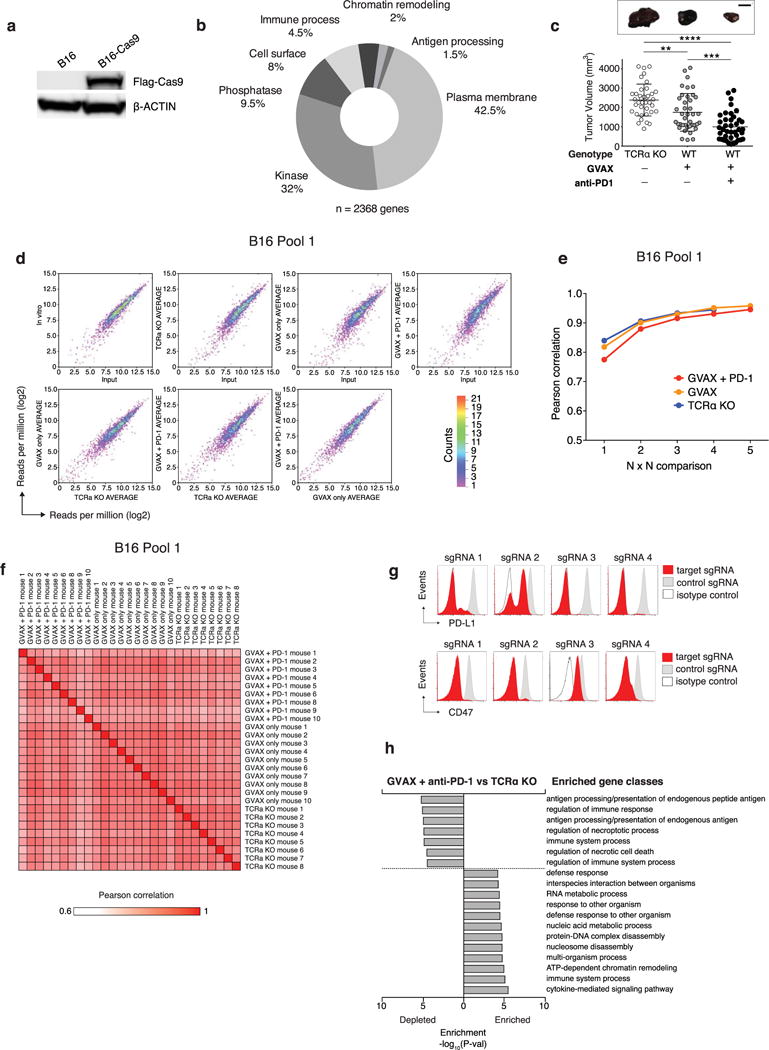
a, Western blot of for Cas9 and β-actin B16 cell lysate of uninfected cells or after transduction with a lentiviral vector encoding Cas9. For western blot source data, see Supplementary Fig. 1. b, Pie chart showing the fraction of genes targeted in the screen in each of the GO term categories indicated. c, Tumour volume for individual animals (dots) on the day of euthanasia in the conditions indicated. Data are mean ± s.d. d, 2D frequency histograms showing the pair wise distribution of sgRNAs abundance (averaged for each condition). e, Saturation analysis of animal replicates from the three in vivo screening conditions. Pearson’s correlations are calculated for the library distribution in one animal versus any other animal, then for two animals averaged versus any other two averaged, and so on. Saturation approaches r = 0.95. f, A matrix of the Pearson’s correlations of the library distribution from one animal compared to any other animal for B16 pool 1. g, Expression of PD-L1 (top) or CD47 (bottom) after infection of B16-Cas9 cells with four different sgRNAs targeting the indicated gene. h, Enrichment analysis (hypergeometric test) of functional classes of genes (GO) targeted by sgRNAs that were enriched or depleted in tumours in animals treated with GVAX and anti-PD-1 compared to Tcra−/− animals. **P <0.01; ***P< 0.001; ****P< 0.0001.
Extended Data Figure 2. Additional validation data for screen hits.
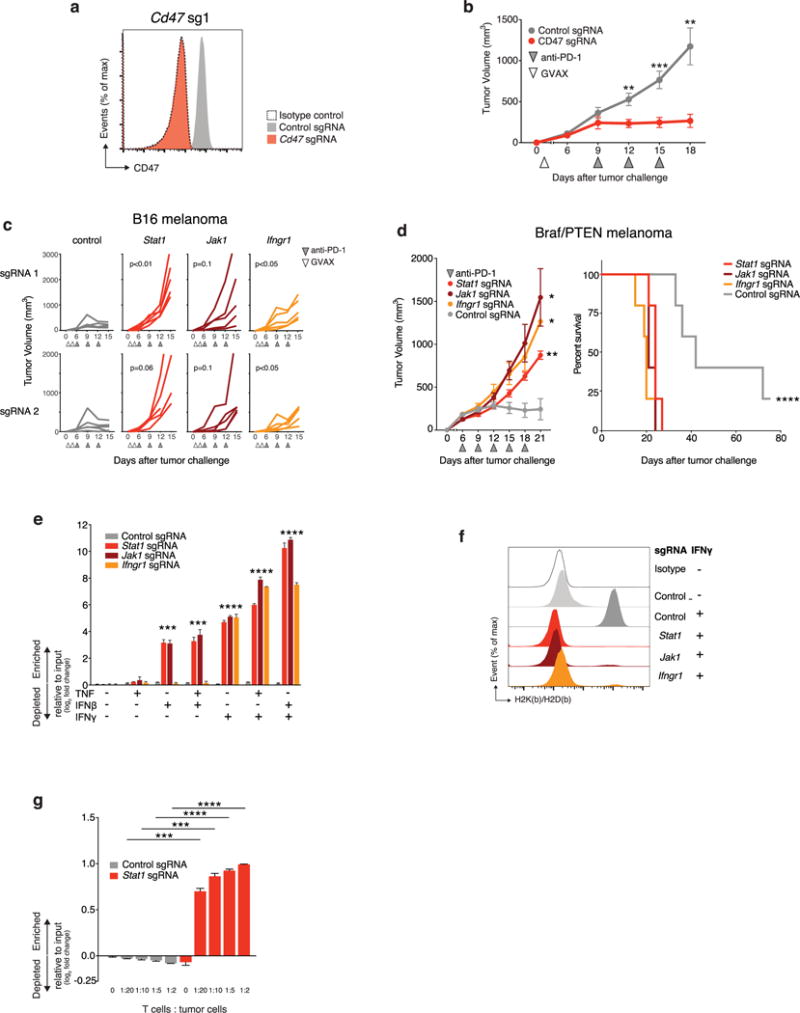
a, Expression of CD47 by B16 cells transfected with either CD47-targeting (red) or control (grey) sgRNA. b, Tumour volume over time for CD47− null or control tumours growing in mice treated with GVAX and PD-1 blockade. Data are mean ± s.e.m.; n = 10 animals per group; representative of two independent experiments. c, Tumour growth in immunotherapy-treated animals challenged with B16 cells lacking the indicated genes. Each line represents one animal; n = 5 animals per group. d, Tumour volume averaged for each group at each time point (left) and survival (right) for Braf/Pten melanoma cells lacking the indicated gene in mice treated with PD-1 blockade. Data are mean ± s.e.m.; n = 5 animals per group. e, Change in the ratios (log2(normalized fold change)) of B16 cells lacking the indicated genes:control cells after in vitro culture with the combinations of cytokines indicated below. Data are mean ± s.e.m.; n = 3 replicates per group. f, Expression of MHC-I (H2K(b)/H2D(b)) on B16 cells lacking the indicated genes with or without IFNγ treatment. g, Change in the ratios (log2(normalized fold change)) of OVA-expressing B16 cells lacking the indicated genes:control cells after in vitro co-culture with OVA-specific T cells at the indicated ratio of T cells:tumour cells. Data are mean ± s.d.; n = 3 replicates per group. *P < 0.05; **P< 0.01; ***P < 0.001; ****P < 0.0001.
Extended Data Figure 3. Additional validation data for Ptpn2.
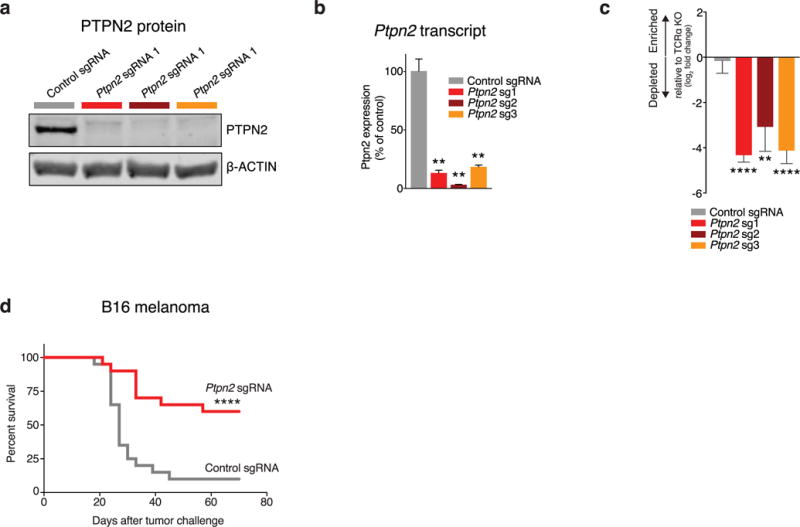
a, Western blot of B16 cell lysate for PTPN2 and β-actin after transfection with either control or Ptpn2-targeting sgRNAs. For western blot source data, see Supplementary Fig. 1. b, Ptpn2 transcript abundance for the same conditions as in a measured by qPOR. Data are mean ± s.d. c, Change in the ratios (log2(normalized fold change)) of B16 cells lacking Ptpn2:control cells in immunotherapy-treated mice relative to Tcra−/− mice with three different sgRNAs. Data are mean ± s.d.; n = 5 animals per group; representative of two independent experiments. d, Survival analysis for Ptpn2-null (red) or control (grey) B16 cells growing in mice treated with GVAX and PD-1 blockade. n = 20 animals per group; representative of two independent experiments. **P <0.01; ****p< 0.0001.
Extended Data Figure 4. Deletion of screen hits from tumour cells.
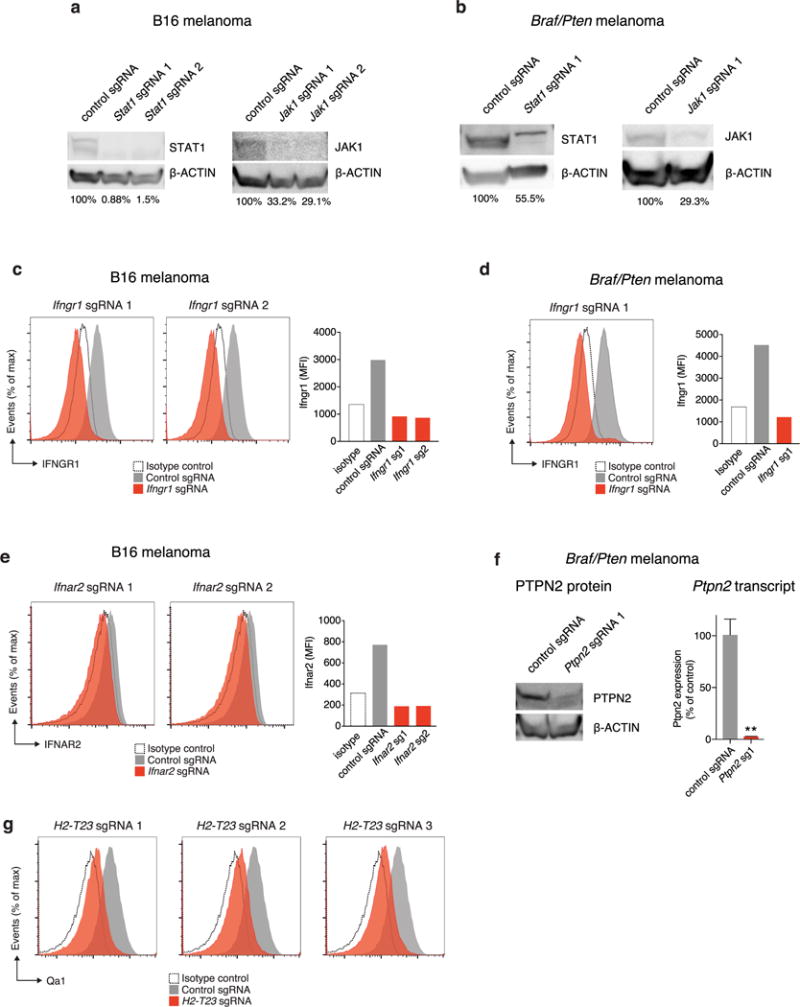
a, Western blot of B16 cell lysate for STAT1 (left) and JAK1 (right) after transfection with the indicated sgRNA and Cas9. β-Actin serves as a loading control for each. The numbers below the lane indicate the per cent expression of the target relative to control sgRNA cells. b, The same as in a, but for Braf/Pten melanoma cells. c, Expression of Ifngr1 in B16 cells transfected with the indicated Ifngr1-targeting (red) or control (grey) sgRNA and Cas9 (left) and quantification of mean fluorescence intensity (right). d, The same as in c, but for Braf/Pten melanoma cells. e, Expression of Ifnar2 in B16 cells transfected with the indicated Ifnar2-targeting or control sgRNA and Cas9 (left) and quantification of mean fluorescence intensity (right). f, Western blot of Braf/Pten melanoma cell lysate for PTPN2 and β-actin after transfection with either control or Ptpn2-targeting sgRNAs (left) and Ptpn2 transcript abundance for the same conditions measured by qPCR (right). Data are mean ± s.d. g, Expression of H2-T23 by B16-Cas9 cells infected with the indicated H2-T23-targeting (red) and control (grey) sgRNA. For western blot source data, see Supplementary Fig. 1. **P < 0.01.
Extended Data Figure 5. Ptpn2-null tumour cells do not have a growth disadvantage in vivo in the absence of T cells or immunotherapy and MC38 colon carcinoma cells are sensitive to Ptpn2 deletion in vivo.
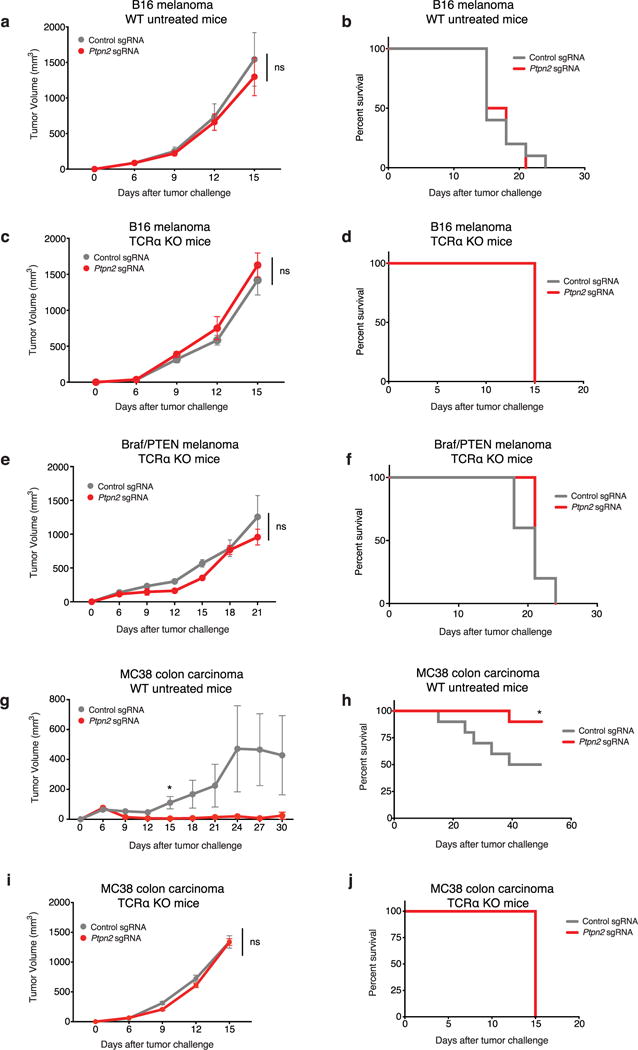
a, Tumour volume averaged for each group at each time point for Ptpn2-null (red) or control (grey) B16 cells growing in wild-type (WT) mice with no treatment. Data are mean ± s.e.m.; n = 10 animals per group. b, Survival analysis for the groups shown in a. c, Tumour volume averaged for each group at each time point for Ptpn2-null or control B16 cells growing in Tcra−/− mice with no treatment. Data are mean ± s.e.m.; n = 10 animals per group. d, Survival analysis for the groups shown in c. Both groups reached the end point on the same day. e, Tumour volume averaged for each group at each time point for Ptpn2-null or control Braf/Pten melanoma cells growing in Tcra−/− mice with no treatment. Data are mean ± s.e.m.; n = 5 animals per group. f, Survival analysis for the groups shown in e. g, Tumour volume averaged for each group at each time point for Ptpn2-null or control MC38 cells growing in wild-type mice with no treatment. Data are mean ± s.e.m.; n = 10 animals per group. h, Survival analysis for the groups shown in g. i, Tumour volume averaged for each group at each time point for Ptpn2-null or control MC38 cells growing in Tcra−/− mice with no treatment. Data are mean ± s.e.m.; n = 5 animals per group. j, Survival analysis for the groups shown in i. Both groups reached the end point on the same day. *P < 0.05.
Extended Data Figure 6. Analysis of Ptpn2 amplifications in human cancer using exome sequencing.
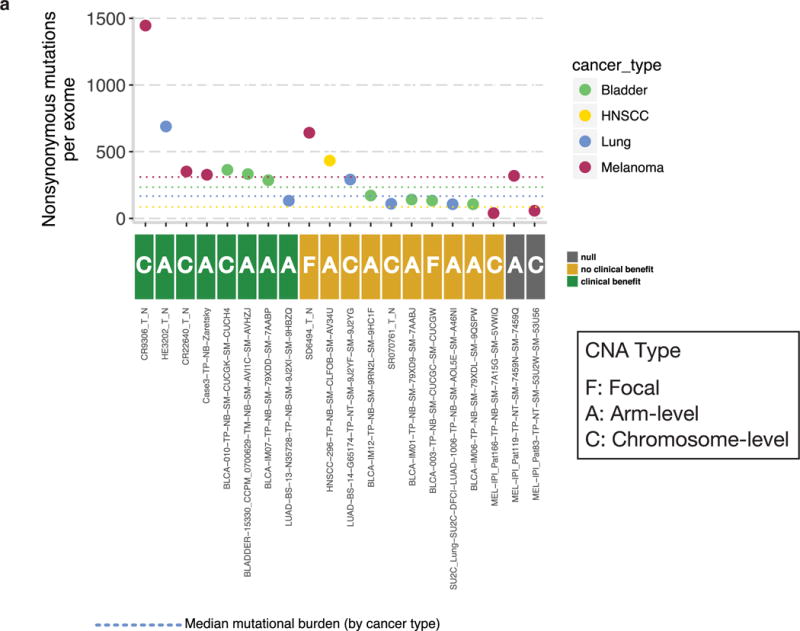
a, Patients treated with anti-PD-1, anti-PD-L1 or anti-CTLA-4 therapies in four cancer types: bladder cancer, head and neck squamous cell carcinoma (HNSCC), lung cancer and melanoma with copy-number amplifications (CNA) of PTPN2 were grouped according to whether or not they received clinical benefit from immunotherapy. The mutational burden is indicated on the y axis and the type of amplification event (focal, arm level or chromosome level) is indicated for each patient.
Extended Data Figure 7. Ptpn2-null tumours have increased effector T cell populations, but no other significant differences in immune infiltrates compared with control tumours were found.
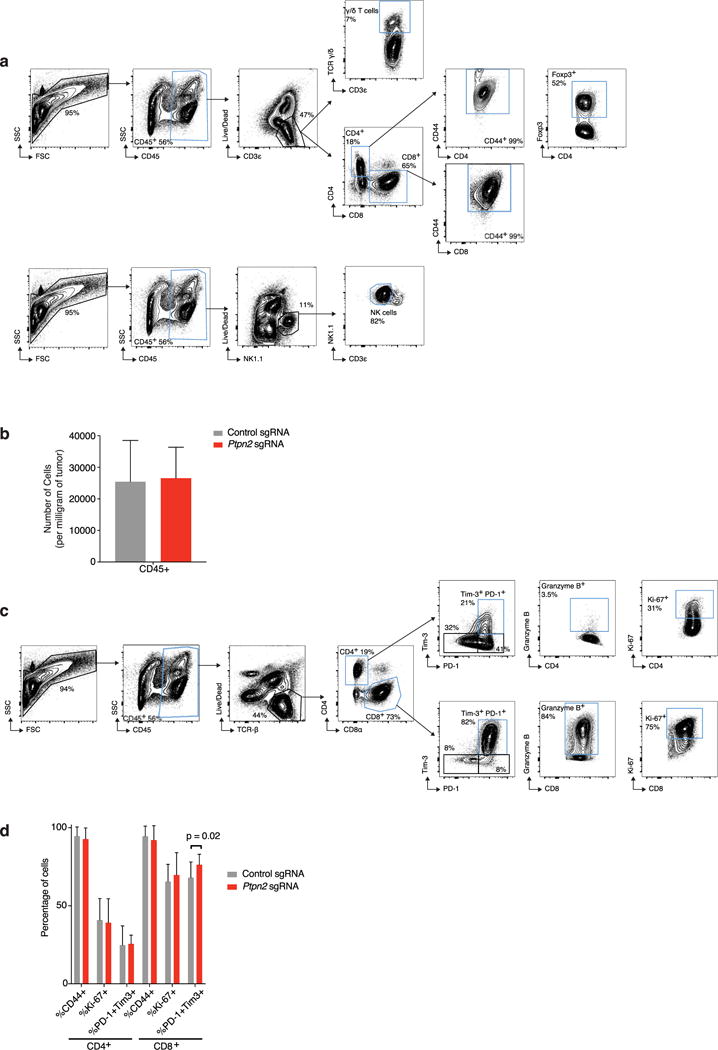
a, Representative plots showing the gating strategy for the data shown in Fig. 4a. Populations of interest are gated in blue. b, The number of CD45+ cells per mg of tumour for Ptpn2-null (red) and control (grey) B16 tumours. Data are mean ± s.d. c, Representative plots showing the gating strategy for the quantification of T cell populations from Ptpn2-null and control B16 tumours shown in d. Populations of interest are gated in blue. d, Quantification of effector T cell populations in either Ptpn2-null or control B16 tumours. Data mean ± s.d. Data pooled from two independent experiments with a minimum of eight mice per group.
Extended Data Figure 8. Ptpn2-null tumours show no significant differences in myeloid cell infiltration compared to control tumours.
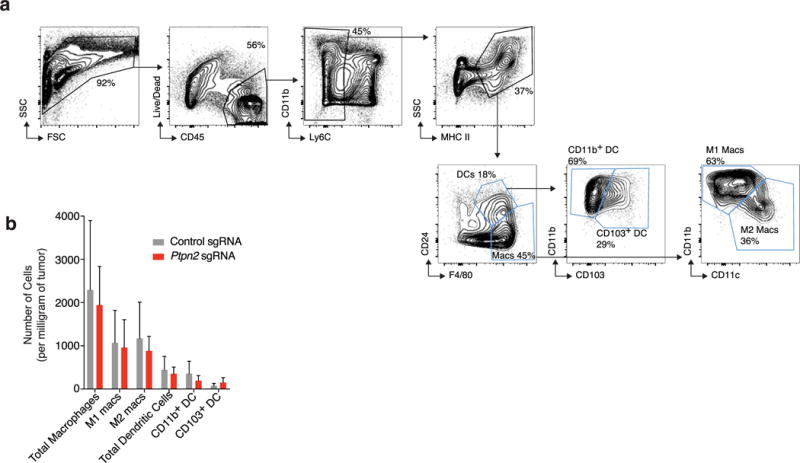
a, Representative plots showing the gating strategy for the myeloid cell populations quantified in b30. Populations of interest are gated in blue. b, Numbers of myeloid cells per mg of tumour for Ptpn2-null (red) and control (grey) B16 tumours. Data are mean s.d. Data pooled from two independent experiments with a minimum of eight mice per group.
Extended Data Figure 9. Ptpn2-null tumour cells have increased MHC-I expression after IFNγ stimulation and have increased sensitivity to costimulation with TNF and IFNγ.
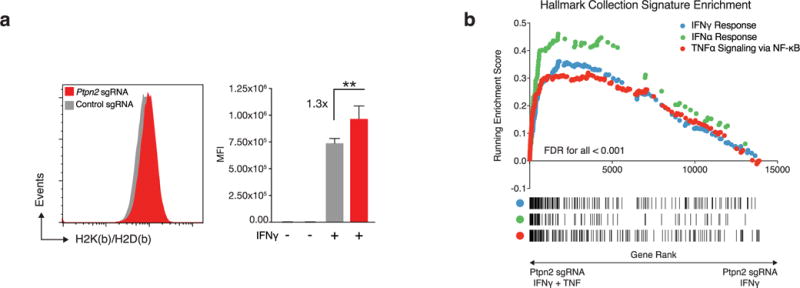
a, Expression of MHC-I (H2K(b)/H2D(b)) on either Ptpn2-null (red) or control (grey) B16 cells after stimulation with IFNγ for 72 h (left) and quantification of mean fluorescence intensity (right). Data are mean ± s.d. b, Gene set enrichment analysis showing enrichment of signatures for IFNγ, IFNα and TNFα signalling via NF-κB in Ptpn2-null B16 cells after costimulation with TNF and IFNγ relative to Ptpn2-null cells stimulated with IFNγ alone.
Supplementary Material
Acknowledgments
This work was supported by Broadlgnite and BroadNext10 awards from the Broad Institute of Harvard and MIT S.A.W. was supported by award number T32GM007753 from the NIGMS. We thank members of the Haining laboratory for their spirited discussions.
Footnotes
Online Content Methods, along with any additional Extended Data display Items and Source Data, are available in the online version of the paper; references unique to these sections appear only in the online paper.
Supplementary Information is available in the online version of the paper.
Author Contributions W.N.H. and R.T.M. conceived the study and wrote the manuscript. W.N.H., R.T.M. and N.B.C. contributed to study design. R.T.M., H.W.P, M.D.Z., K.B.Y., B.C.M., F.D.B., S.A.W. and K.B. conducted experiments with J.G.D., D.E.R. and M.W.L.J.L. and D.E.F provided the Braf/Pten line. V.R.J. and A.H.S. provided RNA-sequencing data of tumour cells. D.M. and E.V.A. analysed exome-sequencing data.
The authors declare no competing financial interests.
Readers are welcome to comment on the online version of the paper. Publisher’s note: Springer Nature remains neutral with regard to jurisdictional claims in published maps and institutional affiliations.
Reviewer Information Nature thanks R. Levine and the other anonymous reviewer(s) for their contribution to the peer review of this work.
References
- 1.Reck M, et al. Pembrolizumab versus chemotherapy for PD-L1-positive non-small-cell lung cancer. N Engl J Med. 2016;375:1823–1833. doi: 10.1056/NEJMoa1606774. [DOI] [PubMed] [Google Scholar]
- 2.Wolchok JD, et al. Nivolumab plus ipilimumab in advanced melanoma. N Engl J Med. 2013;369:122–133. doi: 10.1056/NEJMoa1302369. [DOI] [PMC free article] [PubMed] [Google Scholar]
- 3.Zaretsky JM, et al. Mutations associated with acquired resistance to PD-1 blockade in melanoma. N Engl J Med. 2016;375:819–829. doi: 10.1056/NEJMoa1604958. [DOI] [PMC free article] [PubMed] [Google Scholar]
- 4.Dong H, et al. Tumor-associated B7-H1 promotes T-cell apoptosis: a potential mechanism of immune evasion. Nat Med. 2002;8:793–800. doi: 10.1038/nm730. [DOI] [PubMed] [Google Scholar]
- 5.Holmgaard RB, Zamarin D, Munn DH, Wolchok JD, Allison J. P Indoleamine 2,3-dioxygenase is a critical resistance mechanism in antitumor T cell immunotherapy targeting CTLA-4. J Exp Med. 2013;210:1389–1402. doi: 10.1084/jem.20130066. [DOI] [PMC free article] [PubMed] [Google Scholar]
- 6.Tseng D, et al. Anti-CD47 antibody-mediated phagocytosis of cancer by macrophages primes an effective antitumor T-cell response. Proc Natl Acad Sci USA. 2013;110:11103–11108. doi: 10.1073/pnas.1305569110. [DOI] [PMC free article] [PubMed] [Google Scholar]
- 7.Sica GL, et al. B7-H4, a molecule of the B7 family, negatively regulates T cell immunity. Immunity. 2003;18:849–861. doi: 10.1016/s1074-7613(03)00152-3. [DOI] [PubMed] [Google Scholar]
- 8.Howard TP, et al. Functional genomic characterization of cancer genomes. Cold Spring Harb Symp Quant Biol. 2016;81:237–246. doi: 10.1101/sqb.2016.81.031070. [DOI] [PubMed] [Google Scholar]
- 9.Cowley GS, et al. Parallel genome-scale loss of function screens in 216 cancer cell lines for the identification of context-specific genetic dependencies. Sci Data. 2014;1:140035. doi: 10.1038/sdata.2014.35. [DOI] [PMC free article] [PubMed] [Google Scholar]
- 10.Shalem O, et al. Genome-scale CRISPR–Cas9 knockout screening in human cells. Science. 2014;343:84–87. doi: 10.1126/science.1247005. [DOI] [PMC free article] [PubMed] [Google Scholar]
- 11.Hart T, et al. High-resolution CRISPR screens reveal fitness genes and genotype-specific cancer liabilities. Cell. 2015;163:1515–1526. doi: 10.1016/j.cell.2015.11.015. [DOI] [PubMed] [Google Scholar]
- 12.Chen S, et al. Genome-wide CRISPR screen in a mouse model of tumor growth and metastasis. Cell. 2015;160:1246–1260. doi: 10.1016/j.cell.2015.02.038. [DOI] [PMC free article] [PubMed] [Google Scholar]
- 13.Dranoff G. GM-CSF-secreting melanoma vaccines. Oncogene. 2003;22:3188–3192. doi: 10.1038/sj.onc.1206459. [DOI] [PubMed] [Google Scholar]
- 14.Dranoff G, et al. Vaccination with irradiated tumor cells engineered to secrete murine granulocyte-macrophage colony-stimulating factor stimulates potent, specific, and long-lasting anti-tumor immunity. Proc Natl Acad Sci USA. 1993;90:3539–3543. doi: 10.1073/pnas.90.8.3539. [DOI] [PMC free article] [PubMed] [Google Scholar]
- 15.Duraiswamy J, Kaluza KM, Freeman GJ, Coukos G. Dual blockade of PD-1 and CTLA-4 combined with tumor vaccine effectively restores T-cell rejection function in tumors. Cancer Res. 2013;73:3591–3603. doi: 10.1158/0008-5472.CAN-12-4100. [DOI] [PMC free article] [PubMed] [Google Scholar]
- 16.Wada H, Matsumoto N, Maenaka K, Suzuki K, Yamamoto K. The inhibitory NK cell receptor CD94/NKG2A and the activating receptor CD94/NKG2C bind the top of HLA-E through mostly shared but partly distinct sets of HLA-E residues. Eur J Immunol. 2004;34:81–90. doi: 10.1002/eji.200324432. [DOI] [PubMed] [Google Scholar]
- 17.Kleppe M, et al. PTPN2 negatively regulates oncogenic JAK1 in T-cell acute lymphoblastic leukemia. Blood. 2011;117:7090–7098. doi: 10.1182/blood-2010-10-314286. [DOI] [PubMed] [Google Scholar]
- 18.Kleppe M, et al. Deletion of the protein tyrosine phosphatase gene PTPN2 in T-cell acute lymphoblastic leukemia. Nat Genet. 2010;42:530–535. doi: 10.1038/ng.587. [DOI] [PMC free article] [PubMed] [Google Scholar]
- 19.Pike KA, Tremblay ML. TC-PTP and PTP1B: regulating JAK–STAT signaling, controlling lymphoid malignancies. Cytokine. 2016;82:52–57. doi: 10.1016/j.cyto.2015.12.025. [DOI] [PubMed] [Google Scholar]
- 20.Todd JA, et al. Robust associations of four new chromosome regions from genome-wide analyses of type 1 diabetes. Nat Genet. 2007;39:857–864. doi: 10.1038/ng2068. [DOI] [PMC free article] [PubMed] [Google Scholar]
- 21.Wellcome Trust Case Control Consortium. Genome-wide association study of 14,000 cases of seven common diseases and 3000 shared controls. Nature. 2007;447:661–678. doi: 10.1038/nature05911. [DOI] [PMC free article] [PubMed] [Google Scholar]
- 22.Morandi F, Pistoia V. Interactions between HLA-G and HLA-E in physiological and pathological conditions. Front Immunol. 2014;5:394. doi: 10.3389/fimmu.2014.00394. [DOI] [PMC free article] [PubMed] [Google Scholar]
- 23.Benevolo M, et al. High expression of HLA-E in colorectal carcinoma is associated with a favorable prognosis. J Transl Med. 2011;9:184. doi: 10.1186/1479-5876-9-184. [DOI] [PMC free article] [PubMed] [Google Scholar]
- 24.Talebian Yazdi M, et al. The positive prognostic effect of stromal CD8+ tumor-infiltrating T cells is restrained by the expression of HLA-E in non-small cell lung carcinoma. Oncotarget. 2016;7:3477–3488. doi: 10.18632/oncotarget.6506. [DOI] [PMC free article] [PubMed] [Google Scholar]
- 25.Sáez-Borderías A, et al. IL-12-dependent inducible expression of the CD94/NKG2A inhibitory receptor regulates CD94/NKG2C+ NK cell function. J Immunol. 2009;182:829–836. doi: 10.4049/jimmunol.182.2.829. [DOI] [PubMed] [Google Scholar]
- 26.Moser JM, Gibbs J, Jensen PE, Lukacher AE. CD94-NKG2A receptors regulate antiviral CD8+ T cell responses. Nat Immunol. 2002;3:189–195. doi: 10.1038/ni757. [DOI] [PubMed] [Google Scholar]
- 27.Hu D, et al. Analysis of regulatory CD8 T cells in Qa-1-deficient mice. Nat Immunol. 2004;5:516–523. doi: 10.1038/ni1063. [DOI] [PubMed] [Google Scholar]
- 28.Ofengeim D, Yuan J. Regulation of RIP1 kinase signalling at the crossroads of inflammation and cell death. Nat Rev Mol Cell Biol. 2013;14:727–736. doi: 10.1038/nrm3683. [DOI] [PubMed] [Google Scholar]
- 29.Ebert BL, et al. Identification of RPS14 as a 5q− syndrome gene by RNA interference screen. Nature. 2008;451:335–339. doi: 10.1038/nature06494. [DOI] [PMC free article] [PubMed] [Google Scholar]
- 30.Broz ML, et al. Dissecting the tumor myeloid compartment reveals rare activating antigen-presenting cells critical for T cell immunity. Cancer Cell. 2014;26:638–652. doi: 10.1016/j.ccell.2014.09.007. [DOI] [PMC free article] [PubMed] [Google Scholar]
- 31.Doench JG, et al. Rational design of highly active sgRNAs for CRISPR–Cas9-mediated gene inactivation. Nat Biotechnol. 2014;32:1262–1267. doi: 10.1038/nbt.3026. [DOI] [PMC free article] [PubMed] [Google Scholar]
- 32.Liberzon A, et al. The Molecular Signatures Database hallmark gene set collection. Cell Syst. 2015;1:417–425. doi: 10.1016/j.cels.2015.12.004. [DOI] [PMC free article] [PubMed] [Google Scholar]
- 33.Subramanian A, et al. Gene set enrichment analysis: a knowledge-based approach for interpreting genome-wide expression profiles. Proc Natl Acad Sci USA. 2005;102:15545–15550. doi: 10.1073/pnas.0506580102. [DOI] [PMC free article] [PubMed] [Google Scholar]
- 34.Olshen AB, Venkatraman ES, Lucito R, Wigler M. Circular binary segmentation for the analysis of array-based DNA copy number data. Biostatistics. 2004;5:557–572. doi: 10.1093/biostatistics/kxh008. [DOI] [PubMed] [Google Scholar]
- 35.Van Allen EM, et al. Genomic correlates of response to CTLA-4 blockade in metastatic melanoma. Science. 2015;350:207–211. doi: 10.1126/science.aad0095. [DOI] [PMC free article] [PubMed] [Google Scholar]
Associated Data
This section collects any data citations, data availability statements, or supplementary materials included in this article.
Supplementary Materials
Data Availability Statement
All data presented in this manuscript are available from the corresponding author upon reasonable request.


