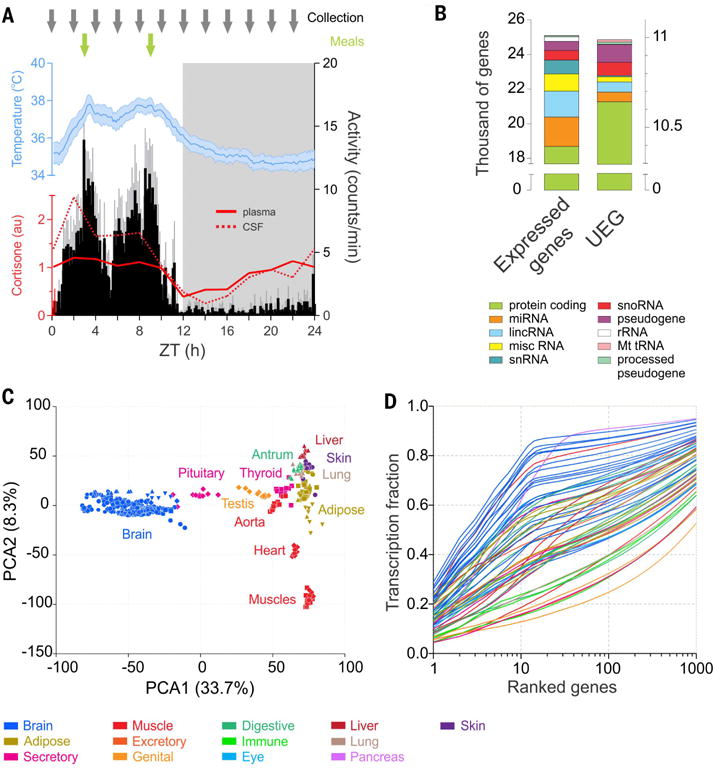
Fig. 2. Transcriptome complexity.

(A) Timing of sampling (gray arrows) across the 24-hour cycle (dark phase in gray shading) and timing of meals (green arrows) superimposed on the daily cycles of locomotor activity (black), body temperature (blue) (averages for 12 animals, ± 95% confidence interval, over the 14 days preceding the sample collection, average activity and temperature periods respectively 23.98 ± 0.02 and 23.97 ± 0.07 hours), and cortisone (plasma, solid red line; cerebrospinal fluid, dotted red line). (B) Number of genes expressed (average FPKM of the 12 time points >0.1) in at least one of the 64 tissues (25,098, left) or present in all the tissues sampled (UEG, 10,989, right). Different colors indicate the gene types. (C) Principal component analysis performed on the 12 time points of 36 representative tissues shows clustering of similar tissues groups based on gene expression profiles. The 22 tissues constituting the brain group clustered very tightly apart from the peripheral organs. (D) Cumulative distribution of the average fraction of total transcription contributed by genes when sorted from most to least expressed in each tissue (x axis). In all figures, each tissue is color-coded according to its system or functional group presented in Fig. 1.
