Abstract
The circadian clock imposes daily rhythms in cell proliferation, metabolism, inflammation and DNA damage response1, 2. Perturbations of these processes are hallmarks of cancer3 and chronic circadian rhythm disruption predisposes to tumor development1, 4. This raises the hypothesis that pharmacological modulation of the circadian machinery may be an effective therapeutic strategy for combatting cancer. The nuclear hormone receptors REV-ERBα and REV-ERBβ (REV-ERBs) are essential components of the circadian clock5, 6. Here we show that SR9009 and SR9011, two different agonists of REV-ERBs are specifically lethal to cancer cells and oncogene-induced senescent (OIS) cells, including melanocytic naevi, while having no effect on viability of normal cells or tissues. Anticancer activity of SR9009 and SR9011 affects a number of oncogenic drivers (such as H-RAS, BRAF, PIK3CA, and others), and persists in the absence of p53 and under hypoxic conditions. The regulation of autophagy and de novo lipogenesis by SR9009 and SR9011 plays a critical role in evoking an apoptotic response in malignant cells. Importantly, the selective anticancer properties of these REV-ERB agonists impair glioblastoma growth in vivo and improve survival without causing any overt toxicity in mice. These results indicate that pharmacological modulation of circadian regulators is an effective novel antitumor strategy, identifying the existence of a previously unknown class of anticancer agents with a wide therapeutic window. We propose that REV-ERB agonists are novel autophagy and de novo lipogenesis inhibitors with selective activity towards malignant and benign neoplasms.
The cell autonomous circadian clock pleiotropically coordinates a complex net of physiological processes1. Both in mice and humans, disruption of circadian rhythms increases cancer incidence1, 7. Given the unique ability of the circadian clock to directly control several pathways that are crucial for tumorigenesis2, 8–11, pharmacological modulation of circadian components may offer promising selective anticancer strategies.
REV-ERBs are Heme-binding circadian clock components6, 12, 13 acting as repressors of processes involved in tumorigenesis, including metabolism5, 14, 15, proliferation16 and inflammation2. Binding to tetrapyrrole Heme enhances the repressive function of REV-ERBs13. Development of pyrrole derivatives (SR9009 and SR9011)14 as specific REV-ERBs agonists with potent in vivo activity prompted us to test whether pharmacological activation of these circadian repressors can affect cancer cell viability by restraining pathways that are aberrantly activated in cancer.
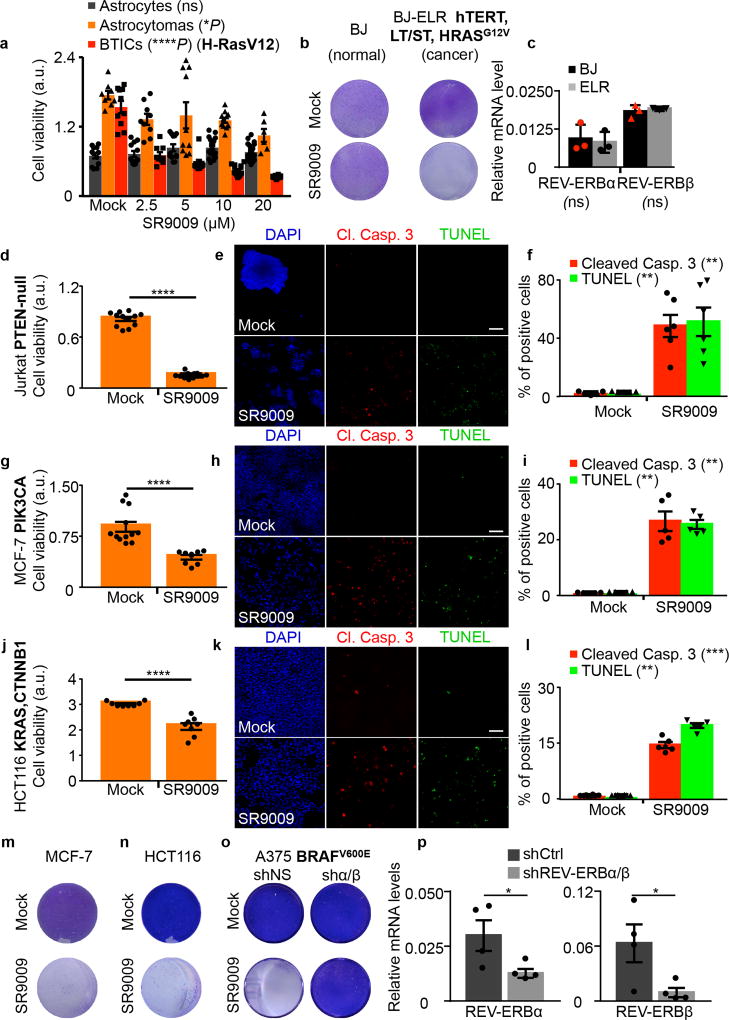
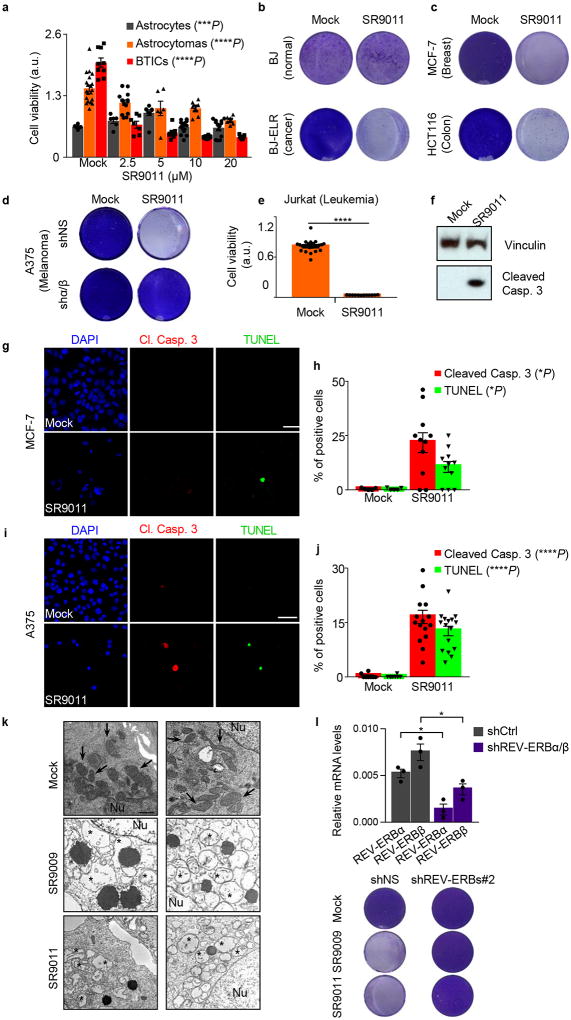
SR9009 treatment showed a cytotoxic effect on cancer cells derived from different tumor types, namely brain, leukemia, breast, colon and melanoma (Fig. 1a, c, f, i, n). A separate REV-ERBs agonist (SR9011) displayed similar cytotoxic properties against the same cancer cell lines (Extended Data Fig. 1a–j). Importantly SR9009 and SR9011 are effective against tumor cell lines harboring different oncogenic drivers, including H-RAS, K-RAS, BRAF, PTEN (deficiency), and β-catenin (Fig. 1 and Extended Data Fig. 1), while having little or no toxic effects on normal cells at comparable concentrations (Fig. 1a,b; Extended Data Fig. 1a,b). Therefore, the antitumor activity of REV-ERB agonists is not just limited to a single oncogenic driver, but is effective against a broad spectrum of tumorigenic pathways.
Figure 1. SR9009 is selectively lethal in cancer cell lines driven by different oncogenic signaling.
a, SR9009 treatment is specifically cytotoxic in cancer cells (72h, one-way ANOVA, n=biological replicates, astrocytes (n=12 mock), (12 2.5µM),(12 5µM), (15 10µM), (18 20µM), P=ns, astrocytoma (n=8 mock), (n=9 2.5µM), (n=10 5µM), (n=11 10µM), (n=6 20µM), *P=0.037, BTICs (n=10 mock), (n=9 2.5µM), (n=9 5µM), (n=15 10µM), (n=18 20µM), ****P<0.0001. b, SR9009 treatment impairs viability of BJ-ELR, but not BJ cells (20µM, 7 days); c REV-ERBs expression levels in BJ and BJ-ELR; (qRT-PCR n=3 biological independent samples, two-tailed Mann–Whitney test P=ns). d, Jurkat cells are affected by SR9009 (n=12 biological replicates 72h 20µM, Mann–Whitney test, one-tailed ****P< 0.0001). e–f, Immunostaining for cleaved caspase 3/TUNEL (72h, 20uM); Quantification in f; n=5 (mock) n=6 (SR9009) biological independent samples, Mann–Whitney test, one-tailed cleaved Caspase 3 **P=0.0022; Tunel **P=0.0022. g, MCF-7 viability is affected by SR9009 (n=12 mock, n=8 SR9009 biological replicates 72h 20µM, Mann–Whitney test one-tailed ****P<0.0001). h–i, Immunostaining for cleaved caspase 3/TUNEL (72h, 20uM). Quantification in i (n=5 biological independent samples Mann–Whitney test one-tailed, cleaved Caspase 3 **P=0.004; Tunel **P=0.004). j HCT116 viability is affected by SR9009 (n=8 biological replicates, WST-1 assay, 72h, Mann–Whitney test, one-tailed ****P< 0.0001. k–l, Induction of apoptosis is showed by cleaved Caspase 3/TUNEL staining (72h, 20µM); Quantification on panel l; n=8 (mock) n=5 (SR9009) biological independent samples, Mann–Whitney test one-tailed cleaved Caspase 3 ***P=0.0008; TUNEL assay **P=0.0021. m–o Prolonged SR9009 treatment eradicates cancer cells (7 days, 20µM), while does not affect REV-ERBα/β shRNA expressing cells; p, REV-ERBα and REV-ERBβ qRT-PCR; n=4 biological independent samples; Mann–Whitney test one-tailed *P=0.0286. NS= not significant. a.u= arbitrary unit. Scale bars 50 µm. All panels three biological independent experiments, mean ± s.e.m. except c (mean ± s.d.).
Levels of REV-ERB mRNA are comparable between normal cells and their transformed counterparts (Fig. 1b). The anticancer activity of SR9009 and SR9011 is abolished upon REV-ERBs downregulation by multiple shRNAs (Fig. 1o,p and Extended Data Fig. 1d,l).
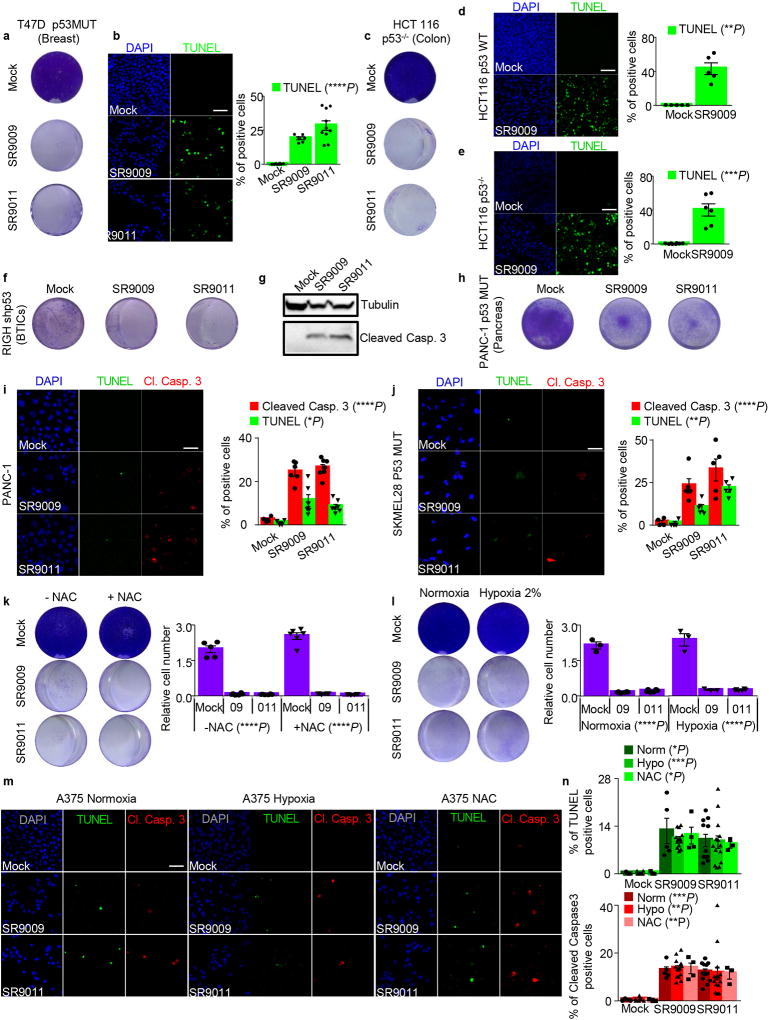
Impairment of cancer cell viability upon SR9009 and SR9011 treatment is due to induction of apoptosis, as assessed by cleaved Caspase 3, TUNEL assays, and further verified by electron microscopy (Fig. 1d–e,g–h,j–k, Extended Data Fig. 1g–j,k). As the tumor suppressor p53 plays an important role in apoptosis and is often inactivated in cancer, we tested whether the induction of apoptosis by REV-ERB agonists requires p53. Agonist-induced apoptosis was largely intact in cells with compromised p53 function (mutation, deletion, or shRNA-mediated downregulation, Fig. 1a–b; Extended Data Fig. 2a–j), indicating that the downstream apoptosis trigger is p53 independent. Therefore REV-ERB agonists do not require the presence of wild-type p53, and are effective against several oncogenic pathways; these observations potentially expand the therapeutic repertoire of REV-ERB agonists against multiple tumor types.
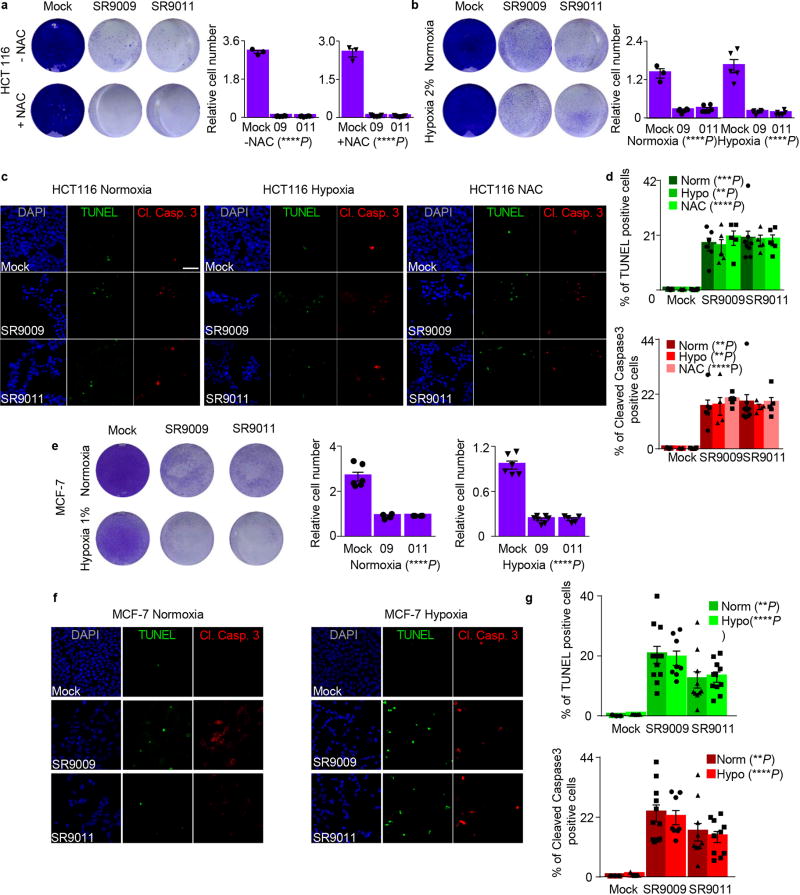
The selectivity of REV-ERB agonists towards cancer cells suggests that SR9009 and SR9011 may affect cellular processes that are specifically critical for the survival of tumor cells and not essentials for normal cells. Increased production of reactive oxygen species (ROS) is specifically detrimental to cancer cells17, in that normal cells exhibit greater tolerance to increased ROS production than cancer cells. Circadian clock and REV-ERB agonists regulate mitochondria metabolism and its oxidative activity15, 18. If ROS overproduction is involved in enhanced sensitivity of cancer cells to REV-ERBs agonists, lowering oxidative stress would protect them against the agonists. We co-treated cancer cells with REV-ERB agonists and the antioxidant N-acetylcysteine (NAC). As a second way of lowering oxidative stress, we administered REV-ERB agonists under hypoxic conditions. Both experimental settings, did not impair the ability of REV-ERB agonists to trigger apoptosis in cancer cells (Extended Data Fig. 2k–n, 3), thus excluding the potential involvement of excessive ROS production.
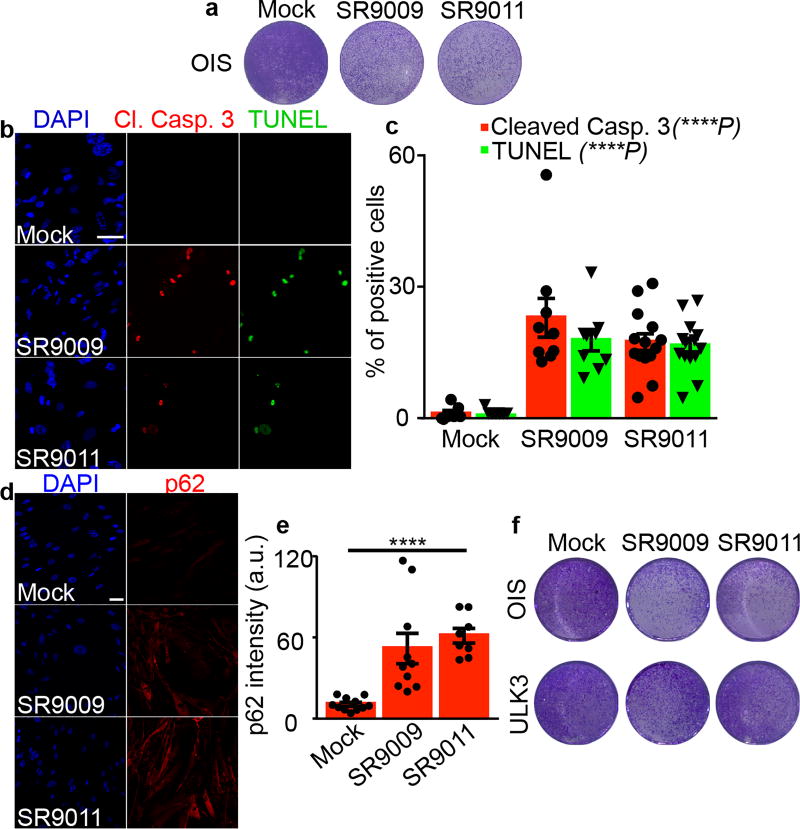
Figure 3. SR9009 and SR9011 treatment evokes an apoptotic response and induces inhibition of autophagy in OIS cells.
a, Proliferation assay shows that REV-ERBs agonists impair viability of OIS cells (6 days, 20µM). b–c, Immunofluorescence assay for cleaved Caspase 3 and TUNEL assay shows apoptosis induction specifically in OIS (n=biological independent samples, n=7 mock, n=9 SR9009, n=14 SR9011, 72h, 20µM; one-way ANOVA, Cl. Casp 3 ****P<0.0001, TUNEL ****P<0.0001, mean ± s.e.m). d–e, p62 accumulates upon REV-ERBs agonists treatment as assayed by immunofluorescence for p62 (n=biological independent samples, n=11 mock, n=10 SR9009, n=8 SR9011 one-way ANOVA, 72h days 20µM, ****P<0.0001; mean ± s.e.m.). f, ULK3 overexpression protects OIS cells from cytotoxicity induced by REV-ERBs agonists (6 days 20µM, mean ± s.e.m.). All scale bars 50 µm. All panels three biological independent experiments with similar results.
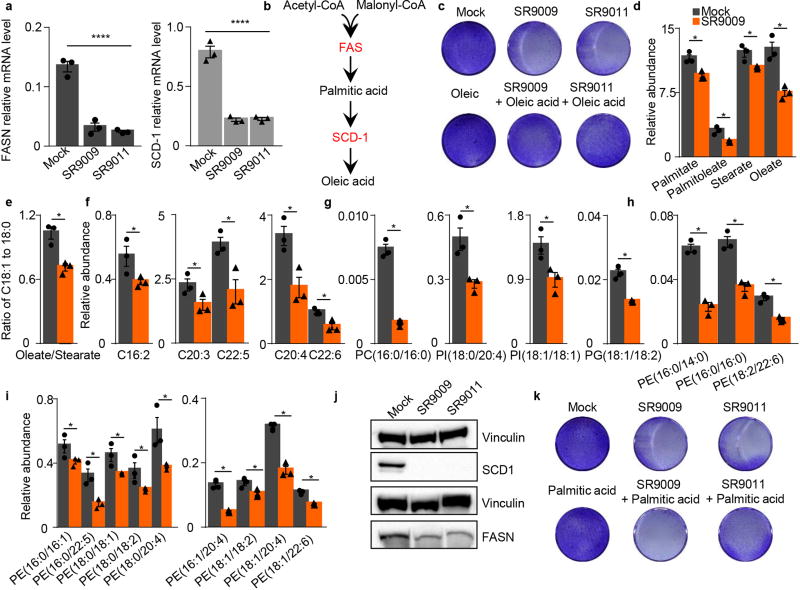
Next, we explored whether REV-ERB agonists can target anabolic pathways selectively critical for cancer cell survival. REV-ERBs tightly control lipid metabolism by repressing several lipogenic enzymes, including Fatty acid synthase (FAS) and Stearoyl-CoA desaturase 1 (SCD1) 14. Importantly, unlike normal cells, cancer cells are highly dependent on de novo lipogenesis, and major efforts are underway to develop cancer therapeutics based on specific inhibitors of FAS and SCD119. Interestingly, REV-ERB agonists strongly reduced the expression levels (both mRNA and protein) of these two key rate-limiting enzymes involved in de novo lipogenesis (Extended Data Fig. 4a–b). Importantly, this reduction lead to the perturbation of several fatty acids and phospholipids (Extended Data Fig. 4c–i). Since oleic acid is the final product of SCD-1 (Extended Data Fig. 4j), we explored whether supplementing culture media with oleic acid may attenuate the anticancer activity of REV-ERB agonists. Indeed, oleic acid impaired the anticancer activity of REV-ERB agonists (Extended Data Fig. 4k), but did not completely abrogate cytotoxicity, thus suggesting the involvement of additional mechanisms. In contrast, palmitic acid supplementation, did not confer protection (Extended Data Fig. 4l).
Cancer cells deal with their high metabolic demands by a complex metabolic rewiring that involves the hyperactivation of autophagy20. Autophagy is essential for cancer cell survival, whereas normal cells depend on this catabolic cellular process only in starvation conditions20. Accordingly, inhibition of autophagy is a promising therapeutic strategy. However, the most common autophagy inhibitors, chloroquine and its derivatives, lack specificity and are toxic at high doses, potentially limiting their utility in clinical setting21.
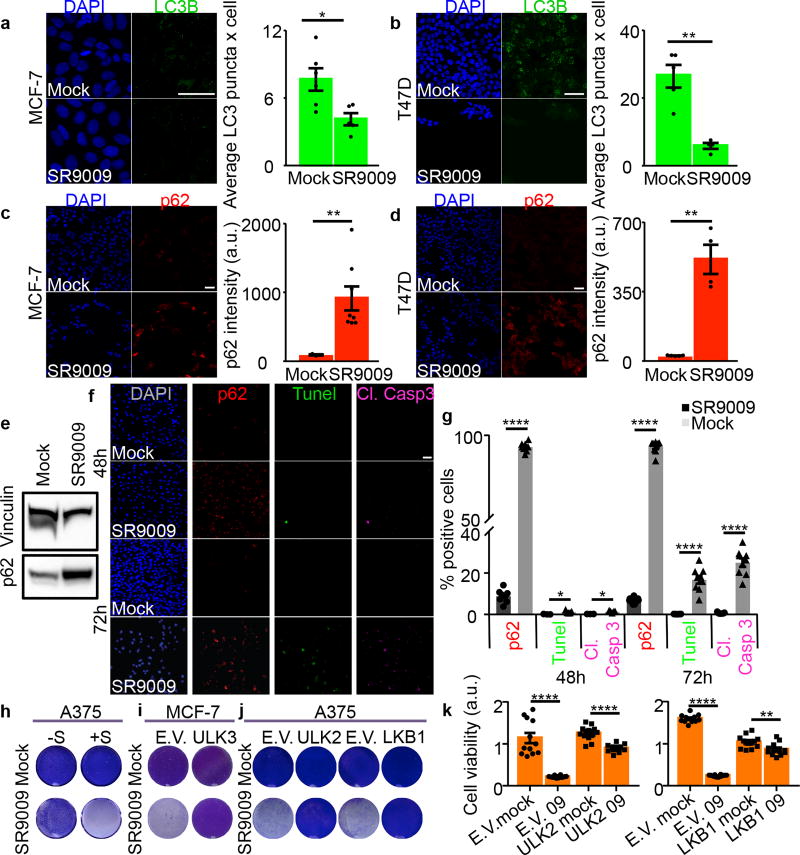
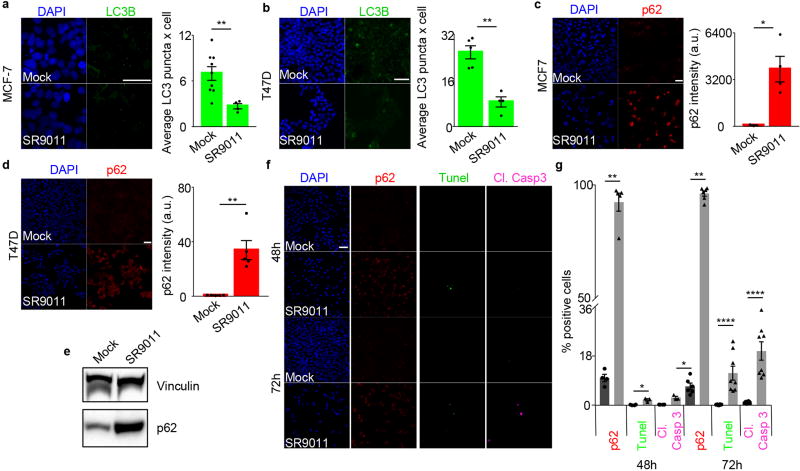
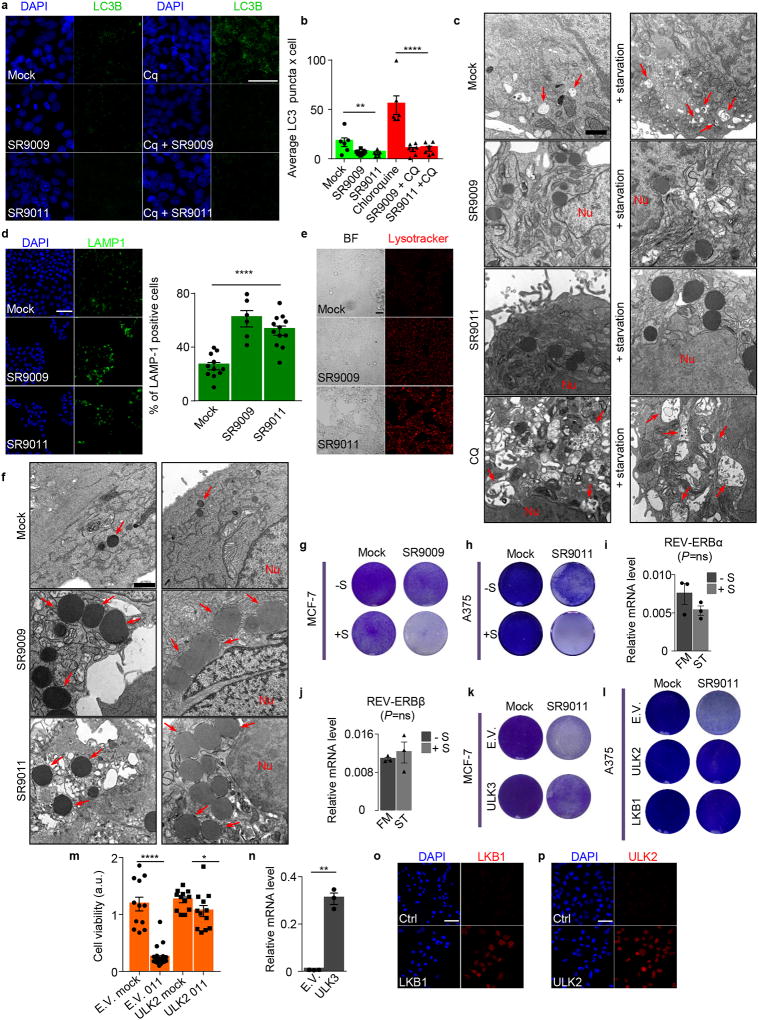
Autophagy is modulated in a circadian fashion and is controlled by REV-ERBα15, 22. These observations prompted us to investigate whether inhibition of autophagy is involved in REV-ERB agonists anticancer activity. Initially we analyzed whether REV-ERB agonists impacts autophagosome numbers (assayed by analyses of the autophagosome marker LC3B). Interestingly, SR9009 and SR9011 reduced the number of autophagosomes (Fig. 2a–b, Extended Data Fig. 5a–b). Decrease in autophagosomes suggests that the administration of REV-ERB agonists inhibited autophagy. To expand upon this initial observation, we tested whether p62, a protein specifically degraded by autophagy, accumulates upon treatment with REV-ERB agonists. Indeed, REV-ERB agonists induced a dramatic accumulation of p62 in different cancer cell lines. (Fig. 2c–e, Extended Data Fig. 5c–d). If autophagy plays a dominant role in the induction of apoptosis triggered by REV-ERB agonists, autophagy inhibition should temporally precede apoptosis induction. Accordingly, autophagy blockage, as shown by p62 accumulation, occurred prior to the induction of apoptosis (Fig. 2f–g and Extended Data Fig. 5f–g). Autophagy inhibition was further confirmed by analyzing the autophagic flux and by electron microscopy that showed impair autophagosomes formation upon starvation (Extended Data Fig. 6a–c). In addition, treatment with REV-ERB agonists prevented lysosome turnover, as shown by an increase in the lysosomal protein LAMP1, and by enhanced lysotracker activity, which stains acidic vesicles (Extended Data Fig. 6d–e). Accumulation of lysosomes was also observed by transmission electron microscopy (Extended Data Fig. 6f). Together, these results indicate that REV-ERB agonists potently inhibit autophagy.
Figure 2. REV-ERBs agonist SR9009 inhibits autophagy.
a–b, SR9009 treatment reduces the number of autophagosomes, as shown by immunofluorescence of LC3B, (n=biological independent samples MCF7 (n=6 mock), (n=5 SR9009) and T47D (n=5 mock) (n=4 SR9009) Mann–Whitney test one-tailed MCF7 20µM 24h *P=0.0152, T47D 20µM 48h **P=0.0079; c–d SR9009 induces accumulation of p62 as shown by immunofluorescence; n= biological independent samples MCF7 (n=3 mock), (n=8 SR9009) and T47D (n=5 mock), (n=4 SR9009) Mann–Whitney test one-tailed 48h MCF7 p62 **P=0.0061; 48h T47D **P=0.0079; e, Inhibition of autophagy is confirmed by the immunoblot for p62 (20µM 48h, A375); f–g, Inhibition of autophagy precedes apoptosis induction as shown by immunofluorescence of p62, cleaved Caspase 3 and TUNEL assay; n=biological independent samples, Mann–Whitney test one-tailed, A375 20µM Cl. Casp. 3 48h (n=3) *P=0.0179; Cl. Casp. 3 72h (n=7) ****P<0.0001; Tunel 48h (n=3) *P=0.0179; Tunel 72h (n=7) ****P<0.0001; p62 48h ****P<0.0001 (n=8); p62 72h (n=9) ****P<0.0001; h, Starvation dramatically accelerate the cytotoxic effect of REV-ERB agonist SR9009 (A375, 3 days 20µM, starvation time 24h; i, Overexpression of ULK3 impairs SR9009 induction of apoptosis (MCF-7, 6 days 20µM); j, Overexpression of ULK2 and LKB1 impairs SR9009 induction of apoptosis (A375, 6 days 20µM). k, WST-1 viability assay shows abrogation of apoptosis in ULK2 and LKB1 overexpressing cells (n=biological replicates A375, 6 days 20µM; Mann–Whitney test one-tailed n=12, E.V. Mock vs E.V. 09 ****P<0.0001; ULK2 Mock (n=12) vs ULK2 09 (n=10) ****P<0.0001; n=12 E.V. Mock vs E.V. 09 ****P<0.0001 and LKB1 Mock vs LKB1 09 **P=0.0028. All scale bars 50 µm. All panels three biological independent experiments with similar results. All the data are plotted as mean ± s.e.m. For gel source data, see Supplementary Fig. 1.
Cancer cells are extremely sensitive to autophagy inhibition when challenged with starvation. Indicating the involvement of autophagy inhibition, SR9009 and SR9011 cytotoxicity was enhanced by starvation in different cancer cell lines (Fig. 2h, Extended Data Fig. 6g–h). Starvation did not induce the expression of REV-ERBs (Extended Data Fig. 6i–j), showing that autophagy inhibition is responsible for the increased sensitivity in starved cancer cells. Finally, overexpression of core autophagy genes (ULK2, ULK3, LKB1) abrogated apoptosis induction in different tumor cell lines (Fig. 2i–k, Extended Data Fig. 6k–p).
Next, we sought to determine how REV-ERB agonists block autophagy. We initially compared differential autophagy outcomes observed between chloroquine and REV-ERB agonists. Chloroquine blocks the fusion of autophagosomes and lysosomes, thereby inhibiting autophagy at a late stage and resulting in the accumulation of autophagosomes (Extended Data Fig. 6a–c). In contrast, REV-ERB agonists decreased the number of autophagosomes. Altogether, these data indicate that REV-ERB agonists block autophagy at an early stage.
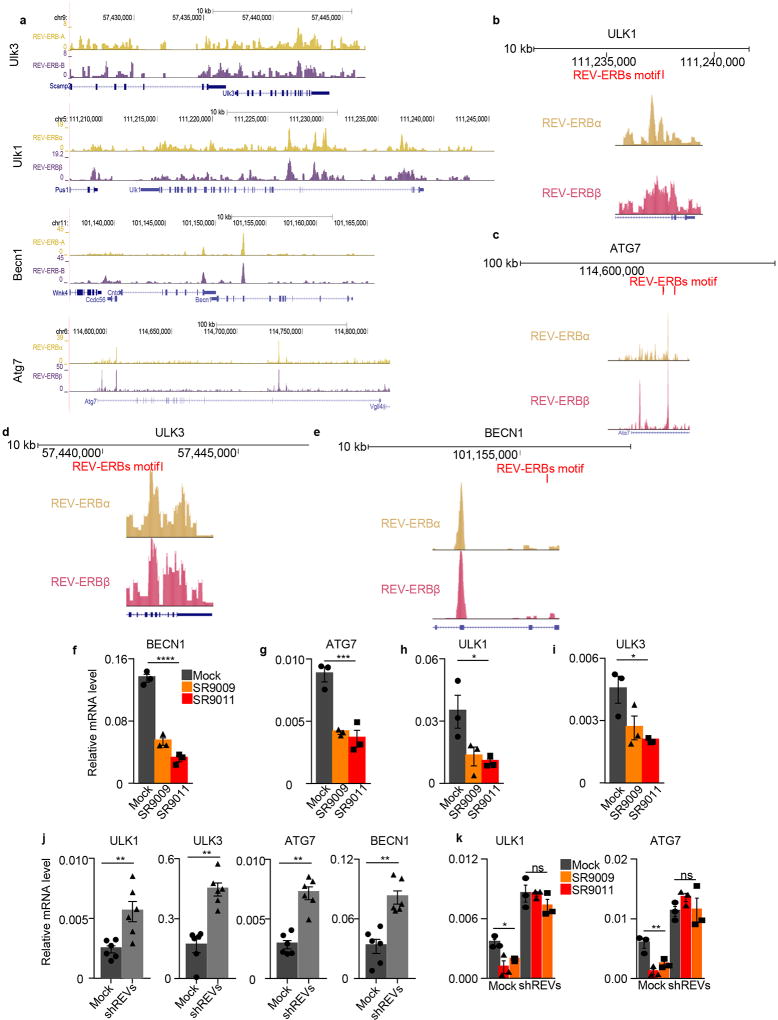
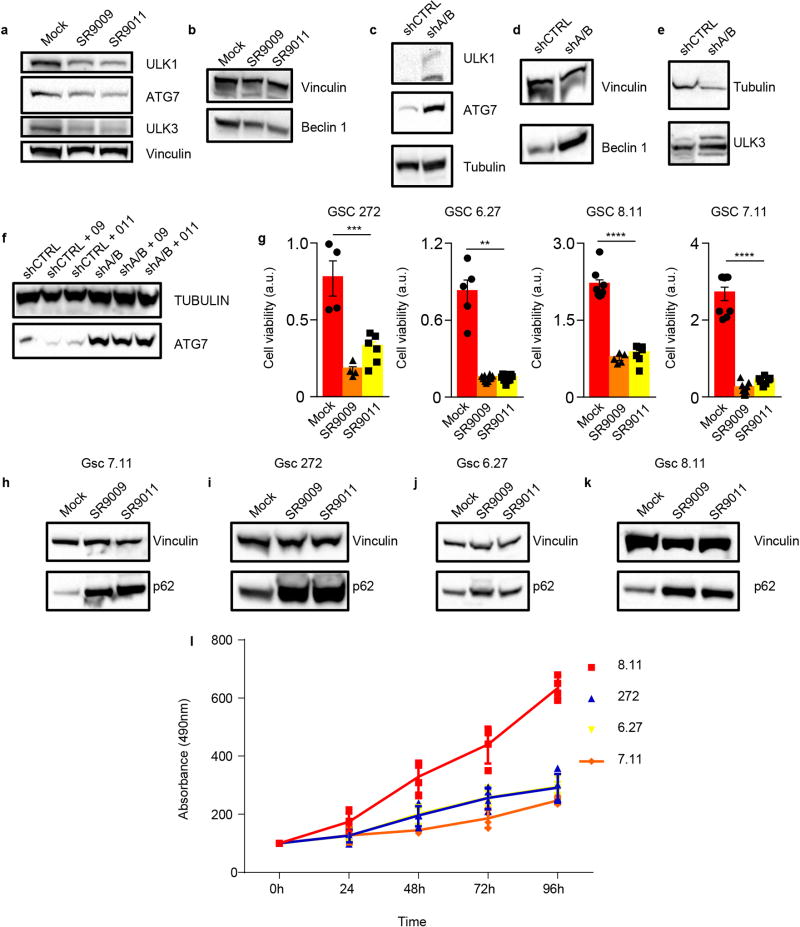
To gain additional mechanistic insights, we investigated whether REV-ERB agonists can regulate the expression of core autophagy genes. Analysis of REV-ERB chromatin occupancy data6 revealed the presence of REV-ERBs peaks in Ulk3, Ulk1, Beclin1, and Atg7 (Extended Data Fig. 7a). Using HOMER, we also find the presence of REV-ERB-α and REV-ERB-β consensus binding sites within these genetic loci (Extended Data Fig. 7b–e). Accordingly, mRNAs and protein levels of ULK3, ULK1, BECLIN1, and ATG7 were downregulated upon treatment with REV-ERB agonists, whereas the expression of these genes was induced upon depletion of REV-ERBs by shRNA (Extended Data Fig. 7f–j, 8a–e). Furthermore, in REV-ERB depleted cells, REV-ERB agonists failed to repress autophagy genes (Extended Data Fig. 7k, 8f).
Activation of aberrant oncogenic stimuli is an early step in tumorigenesis. Oncogene-induced senescence (OIS) arises in normal cells to limit the expansion of cells affected by oncogenic stress23, 24. While providing an immediate benefit by arresting potentially dangerous cells, the accumulation of senescent cells over long periods of time contributes to tumor formation, tumor progression, and age-related diseases25. Furthermore, induction of cellular senescence upon anticancer chemotherapy treatment promotes chemotherapy resistance and generates an environment that may support uncontrolled growth of neighboring cells and fuel relapse25. This highlights the urgent need for senolytic agents. While de novo lipogenesis is upregulated in cancer but not in OIS26, elevated levels of autophagy is a known characteristic of OIS cells27. REV-ERB agonists are lethal when administered to cells characterized by oncogenic RAS signaling (Fig. 1 and Extended Data Fig. 1), affect slowly proliferating cancer stem cells and potently inhibit autophagy (Extended Data Fig. 8g–I, Fig. 2, Extended Data Fig. 5–6)
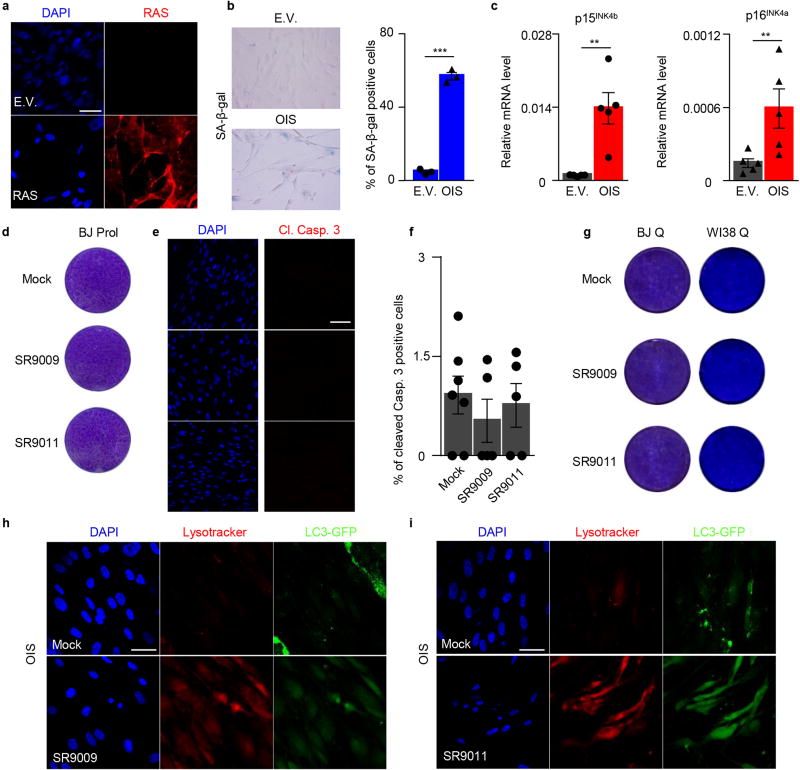
Accordingly, we tested whether treatment of OIS cells with REV-ERB agonists could block autophagy, leading to their apoptosis. H-RasV12 overexpression (Extended Data Fig. 9a) established OIS, as shown by an increase in senescence-associated beta-galactosidase activity and by upregulation of cell cycle inhibitors (Extended Data Fig. 9b–c). Strikingly, REV-ERB agonists triggered the induction of apoptosis in OIS cells without affecting normal proliferating or quiescent cells (Fig. 3a–c and Extended Data Fig. 9d–f). In line with previous results, REV-ERB agonist treatment led to the accumulation of p62 and lysosomes, while reducing autophagosomes (Fig. 3d–e and Extended Data Fig. 9h–i). Therefore, REV-ERB agonists inhibited autophagy in OIS. Finally, upon overexpression of ULK3, the pro-apoptotic ability of REV-ERB agonists was impaired (Fig. 3f). These results show that REV-ERB agonists, through their ability to block autophagy, can target a premalignant non-proliferating cellular population. Therefore, in addition to their oncolytic effects, REV-ERB agonists display an additional senolytic activity.
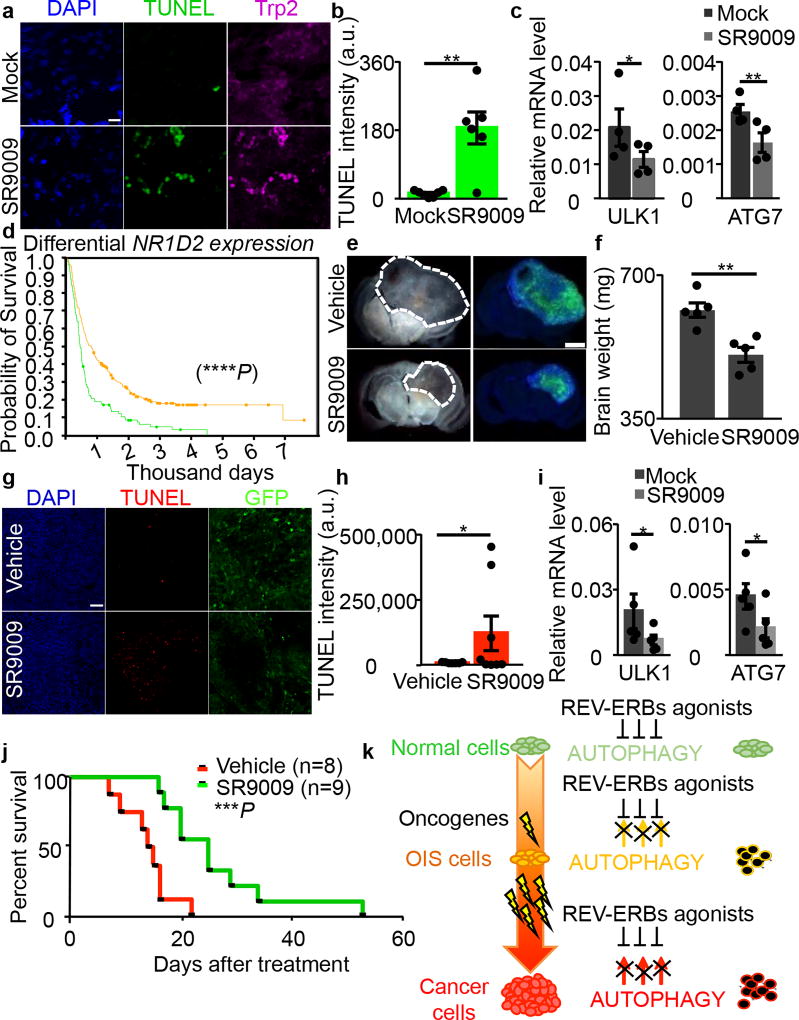
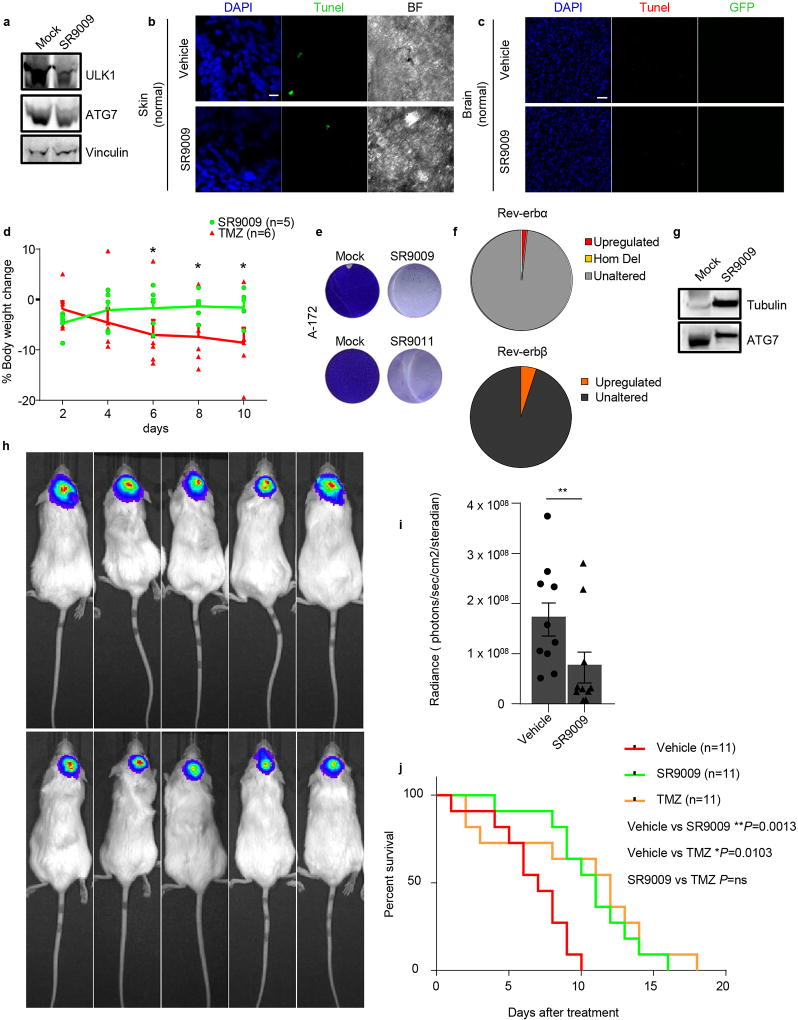
To understand whether REV-ERB agonists represent an effective therapeutic strategy, we asked whether REV-ERB agonists affect OIS and tumor viability in vivo. Naevi are benign lesions consisting of cutaneous melanocytes that have undergone OIS upon aberrant activation of Ras signaling28. Consistent with our previous in vitro observations, SR9009 treatment led to an increase in apoptosis in NRAS-induced naevi and the repression of autophagy genes (Fig. 4a–c and Extended Data Fig. 10a). This indicates that non-proliferating premalignant cells can be potentially selectively targeted by REV-ERBs agonists in vivo. Nevertheless, although naevi have been used as a model for studying OIS in vivo, they do not affect neighboring tissues, and do not evolve into melanoma; therefore, further studies are necessary to assess the therapeutic relevance of REV-ERB agonists as novel senolytic tool25, 29. Importantly, REV-ERB agonists do not show overt toxicity, as previously reported14, 15, and shown here by TUNEL analyses performed in normal skin and brain tissues, as well as by body weight analyses (Extended Data Fig. 10b–d). In contrast, established anticancer agents, such as TMZ, are characterized by several side effects (Extended Data Fig. 10d).
Figure 4. SR9009 impairs viability of NRAS-driven naevi, glioblastoma growth and extends survival.
a–b, SR9009 treatment induces apoptosis in vivo in NRAS naevi as assayed by immunofluorescence analysis (representative images of two independent experiments with similar results, Trp2 melanocytic marker and TUNEL, Mann–Whitney test one-tailed **P=0.0058, n=biologically independent samples, n=7 mock, n=6 SR9009, 12 days SR9009 20 µM, four mice). Scale bar 10 µm. c, Autophagy genes are downregulated upon treatment of NRAS naevi n=4 mice; Mann–Whitney one-tailed ULK1 *P=0.0249, ATG7 **P=0.007. d, REV-ERBβ expression correlates with survival in brain cancer patients (n= biologically independent samples, yellow line intermediate expression n=224, green line downregulated n=119 NIH Rembrandt database; Log-rank two-sided ****P<0.0001;). e–f, SR9009 treatment impairs in vivo growth of glioblastoma (representative images of one experiment n=5 mice, 6 days, 200mg/kg b.i.d.; Mann-Whitney test one-tailed **P=0.004). g–h, SR9009 induces apoptosis in glioblastoma as shown by TUNEL assay; tumor cells are GFP-positive (representative images of one independent experiment, 6 days 200mg/kg b.i.d., Mann–Whitney test one-tailed *P=0.02; n=biologically independent samples, n=7 mock, n=8 SR9009, five mice). i, In vivo treatment with SR9009 results in downregulation of main autophagy genes (6 days, 200mg/kg b.i.d., n=5 mice, Mann-Whitney test one-tailed *P=0.0476). j, SR9009 improves survival of mice affected by glioblastoma. SR9009 100mg/kg, Vehicle n=8 SR9009 n=9 mice; log-rank two-tailed ***P=0.0009. k, Scheme illustrating how REV-ERB agonists selectively affect OIS and cancer cells. All panels mean ± s.e.m.
SR9009 is known to cross the blood–brain barrier14, and several glioblastoma (GBM) cell lines (including brain tumor initiating cells 005 and RIGH (BTICs), A172, and patient-derived GBM stem cells) are sensitive to treatment with REV-ERB agonists in vitro (Fig. 1a, Extended Data Fig. 1a, 2e–f, 8g and 10e). Interestingly, upon analysis of REV-ERB status in glioblastoma TCGA data (The Cancer Genome Atlas), we observed that REV-ERBα and REV-ERBβ status was unaltered in nearly all GBM patients (Extended Data Fig. 10f, and data not shown), suggesting a possible therapeutic use for REV-ERB agonists in the clinical settings.
Finally, REV-ERBβ expression positively correlated with survival in brain cancer patients (Fig. 4d, REV-ERBα data are not available). For the above reasons and low toxicity of REV-ERB agonists, we tested these tool compounds for treating brain tumors. BTICs were transplanted into mouse brains by stereotaxic injection and upon tumor establishment, SR9009 treatment was initiated. SR9009 reduced GBM growth, triggered apoptosis, and downregulated the expression of autophagy genes (Fig. 4e–I and Extended Data Fig. 10g). Additionally, SR9009 reduce tumor growth in a GBM patient-derived xenograft model (Extended Data Fig. 10h–i). Most importantly, SR9009 effectively and significantly improved survival in two glioblastoma models, including a patient-derived xenograft (Fig. 4j, Extended Data Fig. 10j). SR9009 anticancer activity was similar to the current therapeutic standard for glioblastoma, which is temozolomide (TMZ) (Extended Data Fig. 10j). Unlike TMZ, SR9009 lacked toxicity.
Together, these results indicate that REV-ERB agonists are novel pharmacological tools for targeting with high selectivity and low toxicity a potentially wide spectrum of tumors and therapeutic window (Fig. 4k). Importantly, REV-ERB agonists selectively target slowly proliferating tumorigenic and premalignant populations, such as naevi (Fig. 4k). We propose that the anticancer activity of REV-ERB agonists involve the inactivation of at least two cancer hallmarks3 de novo lipogenesis and autophagy, with a major role played by autophagy, given its central role in meeting cancer cell metabolic demands. By simultaneously targeting two vital cancer hallmarks, REV-ERB agonists may represent an improved therapeutic strategy for treating cancer. These results strongly indicate that pharmacological modulation of circadian machinery is a previously unrecognized innovative and selective strategy for cancer treatment (Fig. 4k).
METHODS
Cell Culture and treatments
BJ, WI38, BJ-ELR, A375, Jurkat, MCF7, T47D, HCT116, Becker (astrocytoma line, JCRB Cell Bank), PANC-1, SK-MEL28 cells were grown under standard tissue-culture conditions and obtained through ATCC. No further authentication has been performed. HCT116 p53−/− were a kind gift of Dr. Bruno Amati. 005, RIGH brain tumor initiating cancer cells were cultured as previously described30. OIS cells were generated as previously described31. Quiescent cells were obtained by contact inhibition. Cell lines were tested for mycoplasma contamination. SA-β-galactosidase assay (Cell Biolabs) was performed as described in31. SR9009 (Xcessbio, Millipore), SR9011 (Xcessbio) were dissolved in DMSO for in vitro studies and for ear topical administration; SR9009 and TMZ (Cayman Chemicals) was dissolved in 15% Cremophor (SIGMA) in sterile water for in vivo studies. Hypoxia was induced by lowering incubator oxygen percentage at 1 or 2%; EBSS (Life technologies) was used to induce starvation, NAC (10Mm SIGMA-ALDRICH). Proliferation assays was performed in order to assess the cytotoxicity of SR9009 and SR9011 in normal and cancer cells by using Crystal Violet and Cell Proliferation Reagent WST-1 (Roche); all treatment started when cells where 80% confluent (except for the BTICs experiments). MTS assays were performed per the manufacturer’s instructions (CellTiter 96 Aqueous One, Promega, Madison, WI).
Human samples
GSCs were isolated from specimens of Glioblastoma patients who had undergone surgery at the University of Texas MD Anderson Cancer Center32. The diagnosis of glioblastoma was established on histological examination according to the WHO classification. Patient-derived samples were obtained from consented patients and under an ethically approved Institutional Review Board (IRB) protocol LAB04-0001 chaired by Frederick F. Lang (UTMDACC). Tumor specimens were dissociated and resuspended in Dulbecco's modified Eagle's medium/F12 (Gibco) supplemented with B27 (×1, Invitrogen), bFGF (20 ng/ml Peprotech Rocky Hill, N.J.), and EGF (20 ng/ml, Peprotech). Cells were cultured as neurospheres and passaged every 5–7 days, based on sphere size.
Plasmids
pBABE-Puro, pBABE-Puro H-RasV12, were used as described in31. pLKO.1 shREV-ERBα, pLKO.1 shREV-ERBβ (SIGMA), pLPCULK3, pLPCLC3B (a kind gift of Narita lab) pLenti-ULK2 (ABM), pBABE-LKB1 (a kind gift of Shaw lab). shREV-ERBα#1: CCGGGCGCTTTGCTTCGTTGTTCAACTCGAGTTGAACAACGAAGCAAAGCGCTTTTT; shREV-ERBα#2:CCG-GCC-AGC-CCT-GAA-TCC-CTC-TAT-ACT-CGA-GTA-TAG-AGG-GAT-TCAGGGCTGGTTTTT; shREV-ERBβ#1: CCG-GGC-CCT-CCA-ACT-TAG-TGATGAACTCGAGTTCATCACTAAGTTGGAGGGCTTTTT; shREV-ERBβ#2: CCG-GCC-AGT-ACA-AGA-AGT-GCC-TGA-ACT-CGA-GTT-CAG-GCA-CTT-CTT-GTA-CTG-GTT-TTT.
Immunofluorescence microscopy
For brain tissues immunofluorescence, all mice were perfused with 0.9% NaCl followed by 4% paraformaldehyde in PBS. The brains were collected, fixed overnight and transferred to 30% sucrose in PBS. For fluorescent staining, 40 µm coronal sections on a sliding microtome were prepared and imaged with the Zeiss LSM 780 Side Port Laser Scanning Confocal Microscope. Mice ears were fixed in 4% paraformaldehyde and subjected to histology. Paraffin-embedded sections were stained with anti-TRP2 at 2 µg/mL (Santa Cruz, Dallas, Texas), TUNEL in situ Cell Death Detection Kit, Fluorescein (Roche). Cells were fixed and probed as previously described31. Images and confocal sections were acquired using the Zeiss LSM 780 Side Port Laser Scanning Confocal Microscope. Comparative immunofluorescence ––microscopy analyses were performed in parallel with identical acquisition and analysis parameters. Image J software (version 1.49g) was used to perform quantitative analyses and to assay intensity differences. To count lc3b puncta, upon selection of a threshold in order to minimize any impact of background signal in the analyses, analyses where performed on projected stack by using the Image J function analyze particles. 3D Objects Counter was used to analyze intensity. Apoptosis was evaluated by immunostaining of cleaved caspase 3 (Cell signaling #9664 1:200) and by TUNEL assay using In Situ Cell Death Detection Kit, Fluoresceine or TMR red (Roche). Antibodies: Lc3b (Cell Signaling #3868 1:200) Lamp1 (Cell Signaling #9091 1:200), Sqstm1/p62 (Abcam ab56416 1:100), Sqstm1/p62 (MBL PM045), Ras (BD #610002, 1:200). LysoTracker® Red DND-99 (Lifetech) was used to visualize lysosomes.
Electron microscopy
Cells grown on ACLAR coverslips were fixed in 2.5% glutaraldehyde with 2% paraformaldehyde in 0.15M cacodylate buffer containing 2mM calcium chloride, pH 7.4, at 37°C for five minutes followed by an hour at 4°C. The coverslips were then washed in 0.15M cacodylate buffer containing 2mM calcium chloride, and secondarily fixed in 1% osmium tetroxide/0.3% potassium ferrocyanide in the same buffer. Subsequently, the coverslips were washed in water and en bloc stained with 2% uranyl acetate followed by a graded dehydration in ethanol (35%, 50%, 70%, 90%, 100%, 100%). Samples were then rapidly infiltrated in Epon resin using a Pelco BioWave microwave processing unit (Ted Pella, Redding, CA), flat embedded, and cured at 60°C overnight. Regions of interest were excised and remounted on blank resin stubs. 70nm ultrathin sections were then cut on a Leica UC7 ultramicrotome (Leica, Vienna) and cells were imaged on a TEM at 120kV (Zeiss Libra 120 PLUS, Oberkochen, Germany).
Immunoblotting
Cells were lysed in sample buffer and 20–50 µg of whole cell lysate were resolved by gel electrophoresis (Bolt 4–12% Bis-Tris Plus Gels, Life Technologies), transferred to nitrocellulose (iBlot Transfer Stack, nitrocellulose, Life Technologies) and probed with the following antibodies: Anti-Cleaved Caspase 3 (1:250 Cell signaling #9664); anti-vinculin clone hVIN-1 (SIGMA; 1:10000 immunoblotting); anti Sqstm1/p62 (Abcam ab56416 1:500), BECN1 (1:250, Santacruz H-300, sc-11427), ATG7 (1:1000 Sigma; Cat#: A2856), ULK1 (1:250, SIGMA; Cat#: A7481) ULK3 (1:500 SIGMA; Cat#: SAB4200132), SCD1 (1:1000, ABCAM, ab19862), FASN (1:1000, Cell Signaling, #3180), TUBULIN (1:5000, MILLIPORE #05-829).
qPCR
Total RNA was extracted from cells and tissues using RNAeasy (Qiagen) according to the manufacturer’s instructions, and treated with DNAse before reverse transcription. cDNA was generated using the qScript cDNA SuperMix (Quanta BioSciences). The cDNA was used as template in real-time quantitative PCR reactions with specific primers on ABI 7900HT Fast Real-Time PCR System. The reactions were prepared using SyBR Green reaction mix from Roche. Ribosomal protein P0 (RPP0) was used as a control gene for normalization. Human primer sequences for qRT–PCR: RPPO-fw, 5′-TTCATTGTGGGAGCAGAC-3′; RPPO-rev, 5′-CAGCAGTTTCTCCAGAGC-3′; NR1D1-fw 5′-GCATGGAGAATTCCGCTTC-3′; NR1D1-rev 5′-CGGTTCTTCAGCACCAGAG-3′; NR1D2-fw 5′-CATTTCTATATTTG- AAAGTAGCCCAAT-3′; NR1D2-rev 5′-ACTCAATCAAAGAATGTGCTTGTAA-3′; ULK2-fw 5′-TCAAGCATCTTCCAACCTGTT-3′; ULK2-rev 5′-ATTCCCGTGGCTCATTCCCAT-3′; LKB1-fw 5′-GAGCTGATGTCGGTGGGTATG-3′; LKB1-rev 5'-CACCTTGCCGTA- AGAGCCT-3'; ULK1-fw 5′-AAGCACGATTTGGAGGTCGC-3′; ULK1-rev 5′-TGATT- TCCTTCCCCAGCAGC-3′; BECLIN1-fw 5′-CCATGCAGGTGAGCTTCGT-3′; BECLIN1-rev 5′-GAATCTGCGAGAGACACCATC-3′; ULK3-fw 5′-TGAAGGAGCAGGTCAAGATGA-3′; ULK3-rev 5′-GCTACGAACAGATTCCGACAG-3′; p15-fw 5′-GCGGG- GACTAGTGGAGAAG-3′; p15-rev 5′-CTGCCCATCATCATGACCT-3′; p16-fw 5′-CCCAACGCACCGAATAGTTAC; p16-rev ATTCCAATTCCCCTGCAAACT; SCD1-fw 5′-GACGATGAGCTCCTGCTGTT-3′; SCD1-rev 5′-CTCTGCTACACTTGGGAGCC; FASN-fw 5′-CATCGGCTCCACCAAGTC-3′ FASN-rev 5′-GCTATGGAAGTGCAGGTTGG-3′; Mouse primer sequences for qRT–PCR: ULK1-fw 5′-GAGCCGAGAGTGGGGCTTTGC-3′; ULK1-rev 5′-GCCCTGGCAGGATACCACGC-3′; ATG7-fw 5′-CCGGTGGCTTCCTACTGTTA-3′; ATG7-rev 5′-AAGGCAGCGTTGATGACC-3′.
Chromatin immunoprecipitation (ChIP) seq data analysis
Peak calling was performed using MACS33 (Model-based Analysis of ChIP-Seq) Galaxy Tool Version 1.0.166. P-value cutoff for peak detection was selected as ≤10−5 and false discovery rate (FDR) as ≤0.05.
Promoter motif analysis
Regions 2000 bp upstream and 100 bp downstream from the TSS of Beclin1, Atg7, Ulk1, and Ulk3 were scanned using the mouse (mm10) genome annotation using the HOMER v4.9.1 findMotifs.pl script with start = −2000 and end = 100, with a log odds score threshold of 5, looking for the motif "GTAGGTCACTGGGTCA" trained on data from34.
Lipid Extraction
Lipid extraction was performed as described35, 36. A172 cells were vortexed for 30 seconds in a mixture of 1 mL: 1 mL: 2 mL PBS:methanol:chloroform. 13C16-palmitic acid standard (200 pmol per sample) was added to chloroform prior to extraction. The resulting mixture was centrifuged at 2,200 g, 5 min, 4 °C to separate organic and aqueous phases. The organic phase (bottom layer) was collected and dried under a stream of N2.
Lipidomic Analysis
Lipidomic analysis was performed as described37. Briefly, a Bio-Bond 5U C4 column (Dikma) was used to achieve separation of lipids. The LC solvents were as follows: buffer A, 95:5 H2O:methanol + 0.03% NH4OH; buffer B, 60:35:5 isopropanol:methanol:H2O + 0.03% NH4OH. A typical LC run consisted of the following for 70 min after injection: 0.1 mL/min 100% buffer A for 5 min, 0.4 mL/min linear gradient from 20% buffer B to 100% buffer B over 50 min, 0.5 mL/min 100% buffer B for 8 min and equilibration with 0.5 mL/min 100% buffer A for 7 min. Lipidomic analysis was performed using a Thermo Scientific Q Exactive Plus fitted with a heated electrospray ionization source in negative ionization mode. The MS source parameters were 4 kV spray voltage, with a probe temperature of 437.5 °C and capillary temperature of 268.75 °C. Full-scan MS data was collected with a resolution of 70 k, AGC target 1 × 10⁶, maximum (max) injection time of 100 ms and a scan range of 150–2,000 m/z. Data-dependent MS (top 5 mode) was acquired with a resolution of 35 k, AGC target 1 × 10⁵, max injection time of 50 ms, isolation window 1 m/z, scan range 200 to 2,000 m/z, stepped normalized collision energy (NCE) of 20, 30 and 40. Extracted ion chromatograms for each lipid were generated using a threshold of 5 ppm around the molecular anion [M-H]- exact mass. Lipids, acyl chain composition, and degree of unsaturation were validated by analyzing the product ions in the corresponding tandem mass spectra (i.e. MS/MS). Relative quantification of lipids was performed by measuring the area under the peak and dividing this number by the area under the peak for the internal standard 13C16-palmitatic acid.
In vivo experiments
Mice were purchased from The Jackson Laboratories. All the colonies were bred as indicated by Jackson Laboratories and maintained in pathogen-free conditions at The Salk Institute except the NOD.Cg-PrkdcscidIl2rgtm1Wjl/SzJ which were maintained at The University of Texas MD Anderson Cancer Center and the *Tyr-NrasQ61K* mice and their wild type counterparts which were maintained in University of California, Irvine. C57BL/6, NOD.Cg-PrkdcscidIl2rgtm1Wjl 625 /SzJ and Tyr-NrasQ61K males and females between 8–14 weeks old. Sample size was determined according to previous experimental observations. All the procedures performed in this study were approved by the Institutional Animal Care and Use Committee (IACUC) of the SALK institute, the University of California, Irvine and the University of Texas MD Anderson Cancer Center. In all the experiments mice were monitored daily for signs of illness and they were euthanized when reached endpoints. 005 cells (5×10⁴ cells in 1.5 µl) or GSC 8.11 (1.5×10⁵ in 1.5ul) were stereotaxically injected into mice (C57BL/6J for 005 and NOD.Cg-PrkdcscidIl2rgtm1Wjl/SzJ for GSC) at the age of 8–16 weeks old under anesthesia. The following coordinates were used (in mm posterior, lateral and dorsal to the bregma): SVZ (1.5, 2.0, 2.3), HP (2.0, 1.5, 2.3), CTX (1, 1, 0.5 or 1.0; 0, 1, 0.5 or 1.0 and 2.0, 1.5, 0.5) and striatum (0, 1.4, 3.0). In order to ensure that each experimental group had an equivalent starting tumor upon quantification of tumor sizes by magnetic resonance imaging (MRI) mice were divided into two groups (vehicle and SR9009) and three weeks after injection the treatment started. Similarly NOD.Cg-PrkdcscidIl2rgtm1Wjl/SzJ were imaged by bioluminescence imaging and upon quantification of tumor size they were divided in two groups (vehicle and SR9009) and three groups (vehicle, SR9009, TMZ). No reasons to randomize experiments for this study and no blinding was performed. For all BLI, D-luciferin (150 mg/kg) was administered by subcutaneous injection to mice 10 min before imaging. Mice were fed with Picolab Diet 20 #5058. SR9009 was administered twice per day dosing (i.p.) at the concentrations indicated for one week and for the subsequent days once a day unless otherwise stated in the text. TMZ was administered once per day by i.p. at 82.5 mg/kg for 5 days. All mice in this study were cared accordingly to the guidelines approved by the Animal Care and Use Committee of the Salk Institute. For the naevi studies both ears of *Tyr-NrasQ61K* and wild type littermate mice at postnatal day 21 were treated with either drug SR9009 or DMSO. 40 µl of drug SR9009 at 20µM diluted with DMSO was applied to each ear twice daily for twelve consecutive days. Mice were sacrificed one hour after the last treatment. Four mice (eight ears) were used in each group.
Statistical analysis
Results are shown as means ± s.d. or s.e.m. as indicated in figure legends. P-values were calculated as indicated in figure legends with 95% confidence level.
Data availability
All data and reagents are available from the authors upon reasonable request. All gel source data are available in Supplementary Fig. 1. Tumor source data (Figure 4f and Extended Data Figure 9d, I) are available in the source data file, ChIP-seq data are available in5 and TCGA data are available in38, 39.
Extended Data
Extended Data Figure 1. SR9011 an additional REV-ERBs agonist, selectively kills cancer cell lines.
a, Viability assay show that SR9011 is specifically cytotoxic in cancer cells 72h, one-way ANOVA astrocytes, n= biological replicates (n=7 mock), (n=7 2.5µM), (n=9 5µM), (n=13 10µM), (n=13 20µM) ***P=0.0004, astrocytoma (n=21 mock), (n=15 2.5µM), (n=7 5µM), (n=8 10µM), (n=7 20µM) ****P<0.0001, BTICs (n=10 mock), (n=8 2.5µM), (n=9 5µM), (n=13 10µM), (n=10 20µM) ****P<0.0001. b–d, Proliferation assay show that SR9011 treatment does not affect BJ normal cells while is deleterious for transformed BJ-ELR cells, cancer cell lines MCF-7, HCT116 (20µM, 7 days). Depletion of REV-ERBs by shRNA impairs apoptosis induction by REV-ERBs agonist SR9011; n=3 biological independent experiments). e, Human acute T cell leukemia cells are affected by REV-ERB agonist SR9011 (72h, Mann–Whitney test one-tailed ****P< 0.0001; n=24 mock, n=12 SR9011 biological replicates). f, Immunoblot analysis of cleaved Caspase 3 shows that REV-ERB agonist triggers apoptosis in A375 melanoma cell line (representative of n=2 biological independent experiments). g–j, Immunostaining for cleaved Caspase 3 and TUNEL assay confirm apoptosis induction by SR9011 in cancer cell lines MCF-7 and A375. h–j, Quantification of g,i (n= biological independent samples, MCF-7 n=5 mock, n=11 SR9011; A375 n=8 mock, n=16 SR9011).; Mann–Whitney test one-tailed MCF-7 cleaved Casp. 3 *P=0.0117; Tunel *P= 0.0231; A375 cleaved Casp. 3 ****P<0.0001; Tunel ****P<0.0001. Scale bars 50 µm. k, Electron microscopy confirms induction of apoptosis as indicated by extensive presence of swollen mitochondria (representative of n=3 biologically independent samples in two experiments). Arrows indicate normal mitochondria, asterisks swollen mitochondria. Nu= nucleus. Scale bar 1 µm. l, Downregulation of REV-ERBα and REV-ERBβ is confirmed by qRT-PCR (A375). n=3 biological independent samples; Mann–Whitney test one-tailed *P=0.05. All panels three biological independent experiments unless otherwise specified. All the data are plotted as mean ± s.e.m. For gel source data, see Supplementary Fig. 1.
Extended Data Figure 2. Induction of apoptosis by REV-ERBs agonists is p53 and oxidative stress independent.
a–j, REV-ERBs agonists treatment triggers apoptosis independently of p53 status as showed by proliferation assay (7 days 20 µM; a,c,f,h) and TUNEL assays (b,i,j 3 days, 20 µM) in cancer cell lines affected by different types of p53 alterations. N= biological independent samples T47D n=8 (mock), n=6 (SR9009), n=10 (SR9011) One-way ANOVA test ****P<0.0001, PANC-1 n=4 (mock), n=6 (SR9009), n=7 (SR9011) one-way ANOVA test TUNEL *P=0.0108, Cl. Caspase 3 ****P<0.0001; SKMEL28 n=4 (mock), n=5 (SR9009, SR9011) one-way ANOVA test TUNEL ****P<0.0001, Cl. Caspase 3 **P=0.0035,).; d–e, Apoptosis is induced in both WT and p53 null HCT116 cell (TUNEL assay 4 days, 20 µM mean ± s.e.m., n= biological independent samples Mann–Whitney test one-tailed HCT116 WT n=5 (mock, SR9009) **P=0.004; HCT116 p53 KO n=8 (mock), n=6 (SR9009) ***P=0.0003); f, Immunoblot analysis of cleaved Caspase 3 shows that REV-ERBs agonist triggers apoptosis in RIGH cell line (one experiment). k, Co-treatment with the reducing agent N-acetyl-L-cysteine (NAC 10mM) does not rescue A375 viability (20 µM 7 days, n= biological replicates n=5 (mock -NAC), n=6 (all others dot plots) one-way ANOVA test ****P<0.0001). l Similar results are obtained also under hypoxic condition (20 µM, 6 days, n= biological replicates n=3 (mock -NAC, mock hypoxia, 09 hypoxia), n=6 (09 normoxia, 011 normoxia and hypoxia) one-way ANOVA test ****P<0.0001). m–n, Hypoxia or co-treatment with NAC does not alter REV-ERBs agonists ability to induce apoptosis in A375 (one-way ANOVA test, n= biological independent samples, n=3 mock, n=5 SR9009, n=11 SR9011 TUNEL normoxia, *P=0.0432, Cl. Caspase 3 ***P=0.0004; n=6 mock, n=13 SR9009, n=14 SR9011 hypoxia TUNEL ***P=0.0005, Cl. Caspase 3 *P=0.0028; n=3 mock, n=4 SR9009, n=3 SR9011 NAC TUNEL *P=0.0104, NAC Cl. Caspase 3 **P=0.0042; All scale bars 50 µm. All panels three biological independent experiments with similar results, except otherwise specified. All the data are plotted as mean ± s.e.m. Norm= Normoxia; Hypo= Hypoxia. For gel source data, see Supplementary Fig. 1.
Extended Data Figure 3. Attenuation of oxidative stress does not affect REV-ERBs agonists’ cytotoxic activity.
a–b, REV-ERBs agonists treatment induce apoptosis also upon co-treatment with NAC and under hypoxic condition as showed by proliferation assay of HCT-116; n= biological replicates n=3 (mock ± NAC), n=6 (09–011 ± NAC), n=9 (09 + NAC), n=11 (011 + NAC) 20 µM, n=3 (mock normoxia), n=6 (09–011 normoxia/hypoxia), n=5 (mock hypoxia) 6 days, one-way ANOVA test ****P<0.0001). c–d HCT116 apoptosis induction remained unchanged under hypoxia or upon co-treatment with NAC; 20 µM 6 days, one-way ANOVA test, n=biological independent samples n=5 (mock), n=6 (SR9009), n=8 (SR9011) normoxia TUNEL ***P=0.0003; normoxia Cl. Caspase 3 **P=0.0021; n=3 (mock), n=5 (SR9009), n=4 (SR9011) hypoxia TUNEL, **P=0.0015; hypoxia Cl. Caspase 3 **P=0.0046; NAC TUNEL, ****P<0.0001; NAC Cl. Caspase 3 ****P<0.0001) e, also in MCF-7 apoptosis triggered by REV-ERBs agonists is oxidative state independent, as showed by proliferation assay (20 µM n= biological replicates n=6 (mock normoxia/hypoxia), n=4 (09–011 normoxia), n=7 (09 hypoxia), n=5 (011 hypoxia) one-way ANOVA test ****P<0.0001; f–g TUNEL assay and immunofluorescence analysis of Cleaved Caspase 3 confirm previous results; n= biological independent samples n=3 (mock normoxia), n=5 (mock hypoxia), n=11 (09 normoxia), n=8 (09 hypoxia), n=10 (011 normoxia/hypoxia), One-way ANOVA test TUNEL normoxia **P=0.0049; Cl. Casp. 3 normoxia **P=0.0054; TUNEL hypoxia ****P<0.0001; Cl. Casp. 3 hypoxia ****P<0.0001; all panels three biological independent experiments with similar results. All the data are plotted as mean ± s.e.m. Norm= Normoxia; Hypo= Hypoxia.
Extended Data Figure 4. REV-ERB agonists inhibit de novo lipogenesis.
a–b, REV-ERBs induces downregulation of FASN and SCD-1 mRNA as assayed by qRT-PCR (A172 glioblastoma cell line 48h, 20µM, FASN and SCD-1 (n= 3 biological independent samples ****P<0.0001); Also, FASN and SCD-1 protein levels (b) are reduced upon treatment. c–i REV-ERB agonists reduce free fatty acid (FFA) concentrations as quantified by LC-MS. c, Relative levels of FFAs that are the primary products of FASN (C16:0, C18:0) and SCD-1 (C16:1, C18:1) are lower in the SR9009 treated samples. d, the unsaturation index, the ratio oleate-to-stearate changes is decreased in the SR9009 treated sample, due to a larger decrease in monounsaturated oleate concentrations; e–f, Analysis of polyunsaturated fatty acids shows a consistent trend with lower levels of these fatty acids; g–i, decreases in FFA levels can affect the concentrations of phospholipids that contain those fatty acids. REV-ERB agonists treatment leads to a reduction of palmitate-containing phosphatidylcholine, arachidonic acid- and oleic acid-containing phosphatidylinositols, mono- and di-unsaturated phosphatidylglycerol, and h–i phosphatidylethanolamines; (A172 glioblastoma cell line 48h, 20µM, *P=0.05. j, Scheme illustrating metabolic products of FASN and SCD-1; k, Supplementation of oleic acid partially ameliorate REV-ERBs agonists’ cytotoxicity (20 µM, A172 4 days); l, Supplementation of palmitic acid does not impair REV-ERBs agonists’ cytotoxicity (20 µM, A172 4 days). All the data are plotted as mean ± s.e.m. P-value is calculated with one-way ANOVA in panel a, and with Mann–Whitney test one-tailed in the remaining panels. d–i n=3 biological independent samples. For gel source data, see Supplementary Fig. 1.
Extended Data Figure 5. REV-ERB agonist SR9011 inhibit autophagy.
a–b, SR90011 treatment reduces the number of autophagosomes both in MCF7 and T47D, n= biological independent samples MCF7 20µM 24h n=9 (mock), n=4 (SR9011) **P=0.0056, T47D 48h 20µM n=5 (mock), n=4 (SR9011) **P=0.0079; c–d, SR9011 induces accumulation of p62 as shown by immunofluorescence both in MCF7 and T47D n= biological independent samples 48h MCF7 p62 n=3 (mock), n=4 (SR9011) *P=0.0286; 48h T47D n=5 (mock, SR9011) **P=0.004; e, Accumulation of p62 is confirmed by immunoblot (48h, 20µM A375); f–g, Inhibition of autophagy precedes apoptosis induction as shown by immunofluorescence of p62, cleaved Caspase 3 and TUNEL assay (n= biological independent samples n=4 mock 48h, n=5 SR9011 p62, n=3 48h SR9011; n=6 (mock, SR9011 72h p62), n=10 (mock 72h), n=8 (SR9011 72h) A375 20µM, Cl. Casp. 3 48h *P=0.0286; Cl. Casp. 3 72h ****P<0.0001; Tunel 48h *P=0.0286; Tunel 72h ****P<0.0001; p62 48h **P=0.0079; p62 72h **P=0.0011). All panels three biological independent experiments with similar results. All the data are plotted as mean ± s.e.m. P-value is calculated with Mann–Whitney test one-tailed in all the panels. For gel source data, see Supplementary Fig. 1.
Extended Data Figure 6. REV-ERB agonists SR9009 and SR9011 block autophagy.
a, REV-ERBs agonists blockage of autophagy results in a reduced autophagic flux; b, Quantification of LC3 puncta; n=biological independent samples n=6 (mock, CQ ± SR9011), n=11 (SR9009) n=5 (SR9011), n=7 (CQ+ SR9009) one-way ANOVA mock vs SR9009/011 **P=0.0049; one-way ANOVA CQ vs CQ+SR9009/011 ****P<0.0001. c, Upon SR9009 and SR9011 treatment autophagy blockage is also observed by electron microscopy and even under starvation. Arrows indicate representative autophagosomes. Nu= nucleus. Scale bars 1uM (n=3 biologically independent samples of two independent experiments with similar results (mock ± SR9009 and SR9011) one experiment (mock, SR9009 and SR9011 ± starvation). d, REV-ERB agonists induce lysosomes accumulation as showed by immunofluorescence assay for lysosome marker LAMP1 (n= biological independent samples, n=11 mock, n=6 SR9009, n= SR9011 T47D, 72h 20µM, one-way ANOVA ****P<0.0001. e, Lysosomes accumulation is also confirmed by lysotracker (MCF-7, 72h 20µM; Scale bars 50 µm. f, Drastic lysosomal turnover defects are also evident on electron microscopy (n=3 biologically independent samples of two independent experiments with similar results). Arrows indicate lysosomes. CQ= chloroquine; Nu= nucleus. Scale bars 1uM. g–h, Starvation synergizes with REV-ERBs agonist SR9009 treatment (MCF-7 48h, 20µM; A375, 3 days 20µM). i–j, Starvation has no effect on REV-ERBs expression as shown by qRT-PCR; Mann–Whitney test two-tailed P=ns; k–l, Overexpression of ULK3, ULK2 and LKB1 impairs SR9011 induction of apoptosis (MCF-7, A375 6 days 20µM); m, WST-1 viability assay shows abrogation of apoptosis in ULK2 overexpressing cells; n= biological replicates, n=12 (E.V. mock, ULK2 mock, ULK2 SR9011), n= 27 (E.V. SR9011) A375, 6 days 20µM; Mann–Whitney test one-tailed E.V. Mock vs E.V. 011 ****P< 0.0001; ULK2 Mock vs ULK2 011 *P=0.0225). n. qRT-PCR shows overexpression of ULK3 (Student's t-test one-tailed **P=0.0031); o–p, immunofluorescence assay confirms overexpression of LKB1 and ULK2. i–j,n n=3 biological independent samples. Scale bars 50 µm. E.V.= empty vector; CQ= chloroquine. BF= bright field. Ns= not significant. All panels three biological independent experiments with similar results, except otherwise specified. All the data are plotted as mean ± s.e.m.
Extended Data Figure 7. Core autophagy genes are novel REV-ERBs targets.
a, Analyses of available ChIP-seq data5 indicate that REV-ERBs peaks are present in ULK3, ULK1, BECN1, and ATG7 (P<1e-05 calculated by MACS using Poisson distribution, FDR≤0.05); b–e, Analysis of REV-ERBs binding motif performed using HOMER indicate the presence of REV-ERBs binding sites in Ulk3, Ulk1, Beclin1 and Atg7 genes; f–i, REV-ERBs agonists’ treatment leads to downregulation of autophagy central regulators (MCF-7 72h 20µM; one-way ANOVA ****P<0.0001); j Autophagy genes are upregulated upon REV-ERBs shRNA (A375, n=6 biological independent samples, Mann–Whitney test one-tailed ULK3 **P=0.0011; ATG7, and BECN1 **P=0.0011, ULK1 **P=0.0043). k, SR9009 and SR9011 repression of autophagy genes is abrogated in A375 shREV-ERBs cells; shCTRL +/− SR9009-SR9011 one-way ANOVA ULK1 *P=0.0162, ATG7 **P=0.0036; shREV-ERBs one-way ANOVA ULK1 and ATG7 P=ns. f–I,k n=3 biological independent samples. All the data are plotted as mean ± s.e.m. shREVs= shREV-ERBα/β.
Extended Data Figure 8. REV-ERBs regulates autophagy core genes and blocks autophagy in slowly proliferating cancer stem cells.
a–b, Immunoblot analyses show reduction of ULK1, ATG7, ULK3 and Beclin1 protein levels upon treatment with REV-ERBs agonists (MCF-7 72h 20µM). c–e, REV-ERBs shRNA results in increased protein levels of autophagy regulators (A375). f, SR9009 and SR9011 reduction of ATG7 is abrogated upon shREV-ERBs cells. g, WST-1 viability assay show that REV-ERB agonists SR9009 and SR9011 treatment is specifically cytotoxic in patient-derived glioblastoma stem cells; mean ± s.e.m., 5 days, one-way ANOVA; n= biological replicates GSC 272 n=4 (mock, SR9009), n=6 (SR9011), ***P=0.0002; GSC 6.27 n=5 (mock), n=10 (SR9009) **P=0.003; GSC 8.11 n=8 (mock), n=5 (SR9009), n=7 (SR9011) ****P<0.0001; GSC 7.11 n=9 (mock, SR9009), n=7 (SR9011)****P<0.0001. b–e, Immunoblot analyses show accumulation of p62 in patient-derived glioblastoma stem cells (one independent experiment). f, Mts assay show that GSC 6.27, 7.11, and 272 are characterized by slow proliferation rate (n=4 biological independent samples, four experiments, mean ± standard deviation). All panels three biological independent experiments with similar results, except otherwise specified. For gel source data, see Supplementary Fig. 1.
Extended Data Figure 9. REV-ERBs agonists do not affect viability of normal proliferating and quiescent cells OIS.
a, Immunofluorescence assay for RAS confirms RAS overexpression in OIS cells. b, SA-β-Gal assay shows induction of senescence (n=3 biological independent samples Student's t-test one-tailed ****P<0.0001). c, Induction of cell cycle inhibitors p15INK4b, p16INK4a is assayed by qRT-PCR; n=5 independent biological samples; Mann–Whitney test one-tailed p15INK4b **P =0.004, p16INK4a **P=0.0079. d–e, REV-ERBs agonists’ do not induce apoptosis in proliferating and quiescent normal diploid fibroblasts BJ (d–g), as shown by proliferation assay (d, 7 days, 20µM) and immunofluorescence for cleaved Caspase 3 (e–f, 7 days 20µM, one-way ANOVA; n=biological independent samples, n=7 (mock) n=5 (SR9009, SR9011) P=ns. Cell viability is also not affected in an additional normal diploid cell line WI38 (g, 10 days 20µM). h–I, SR9009 and SR9011 inhibit autophagy in OIS cells as shown by massive accumulation of lysosomes (lysotracker) and absence of LC3 puncta (3 days 20µM). All scale bars 50 µm. Data in a–i are representative of three independent experiments with similar results unless otherwise specified. All the data are plotted as mean ± s.e.m.
Extended Data Figure 10. SR9009 impair tumor growth and improve survival of glioblastoma patient derived xenografts.
a, Protein levels of autophagy genes are reduced upon SR9009 treatment in NRAS naevi as assayed by immunoblot (n=4 mice, one experiment). b, TUNEL assays shows that apoptosis induction is absent in normal skin upon treatment with SR9009 (n=4 mice, one experiement, 12 days SR9009 20 µM). Scale bar 10 µm. (BF= brightfield) c, TUNEL assays shows that apoptosis induction is absent in normal brain tissues upon treatment with SR9009 (6 days, 200mg/kg b.i.d. n=5 mice, one experiment). d, Treatment with SR9009 (100mg/kg b.i.d) is better tolerated than TMZ administration (82.5 mg/kg q.d. for 5 days) as shown by measurement of % body weight change. Mann–Whitney test one-tailed (day 2, 4 P=ns; day 6,8,10 *P=0.0411, mean ± s.e.m, SR9009 n=5, TMZ n=6 mice. Ns= not significant. e, Glioblstoma cell line A172 are sensitive to SR9009 and SR9011 treatment, (20 µM 6 days, three biologically independent experiments with similar results). f, Analyses of the TCGA data presented in Brennan et al (Cell 2013) show the lack of genetic alteration affecting REV-ERBα (NR1D1) and REV-ERBβ (NR1D2). Furthermore, gene expression analysis shows that no cases are present with REV-ERBs downregulation and only a small fraction with upregulation. n= 574 biological independent samples. NR1D1: upregulation 1,56%; Homozygous deletion (Hom Del) 0.17%; unaltered 98.27%. NR1D2: upregulation 4.54%; unaltered 95.46%. g, In vivo treatment with SR9009 results in decrease of ATG7 protein levels (6 days, 200mg/kg b.i.d., n=5 mice, one experiment). h, SR9009 treatment impairs in vivo growth of glioblastoma patient derived xenografts (6 days, 200mg/kg b.i.d n=5 mice). i, Quantification of tumor size by in vivo luciferase assays (mean ± s.e.m n=10 mice, Mann-Whitney test one tailed **P=0.0057). j, SR9009 improves survival in mice bearing glioblastoma patient-derived xenografts. SR9009 200mg/kg, Vehicle n=11, SR9009 n=11, TMZ (82.5 mg/kg q.d. for 5 days) n=11 mice; log-rank analyses two-tailed performed. For gel source data, see Supplementary Fig. 1.
Supplementary Material
Acknowledgments
We thank Katherine V Ly, Layla Fijany, Yasushi Soda, Mie Soda and Mark Schmitt for technical assistance. Fabrizio d'Adda di Fagagna, Saverio Minucci, Andrea Viale, Gaetano Gargiulo, Jan Karlseder for discussion and feedback. Narita, Gage, Burris, Amati, Shaw, laboratories and Frederick F. Lang, for reagents. We thank the Salk Institute’s Waitt Advanced Biophotonics Center and Gene Targeting and Transfer, Max Shokhirev and the Razavi Newman Integrative Genomics and Bioinformatics Core. G.S. is supported by the AIRC/Marie Curie International Fellowships in Cancer Research (12298), Istituto Superiore di Sanità, TRAIN “Training through Research Application Italian iNitiative”. M.V.P. is supported by the NIH NIAMS grants R01-AR067273, R01-AR069653, and Pew Charitable Trust grant. X.W. is supported by CIHR postdoctoral fellowship (MFE-123724). I.M.V is an American Cancer Society Professor of Molecular Biology. A.R. is supported by NCI T32 grant, Salk Women in Science, Salk Excellerators Award, and the Stavros Niarchos Foundation New Frontiers Salk Research Specialist Award. M.J.K. is supported by F30 DK112604. A.S. is supported by the NCI Cancer Center Support Grant P30 (CA014195 MASS core) and Dr. Frederick Paulsen Chair/Ferring Pharmaceuticals. This work was supported in part by Worldwide Cancer Research (WCR) grant, American Federation of Aging Research mid-career grant M14322 to S.P. Additional support came from Cancer Center Core Grant (P30 CA014195-38), the H.N. and Frances C. Berger Foundation, the Glenn Center for Aging Research, and the Leona M. and Harry B. Helmsley Charitable Trust grant #2012-PG-MED002.
Footnotes
Author Contributions X.W. and M.P. performed experiments related to naevi. A.R. participated in xenograft experiments. F.P. performed experiments in Extended Data Figure 8g-l, 10h-j. M.J.K. performed lipidomic assays. G.S. designed the study, performed experiments, analyzed data and wrote the manuscript. A.S, I.M.V., M.V.P. supervised experiments and edited the manuscript. S.P. supervised, designed the study and reviewed the data and manuscript. All authors discussed the results and commented on the manuscript.
The authors declare no competing financial interests.
References
- 1.Fu L, Lee CC. The circadian clock: pacemaker and tumour suppressor. Nature reviews. Cancer. 2003;3:350–361. doi: 10.1038/nrc1072. [DOI] [PubMed] [Google Scholar]
- 2.Scheiermann C, Kunisaki Y, Frenette PS. Circadian control of the immune system. Nature reviews. Immunology. 2013;13:190–198. doi: 10.1038/nri3386. [DOI] [PMC free article] [PubMed] [Google Scholar]
- 3.Hanahan D, Weinberg RA. Hallmarks of cancer: the next generation. Cell. 2011;144:646–674. doi: 10.1016/j.cell.2011.02.013. [DOI] [PubMed] [Google Scholar]
- 4.Straif K, et al. Carcinogenicity of shift-work, painting, and fire-fighting. The Lancet. Oncology. 2007;8:1065–1066. doi: 10.1016/S1470-2045(07)70373-X. [DOI] [PubMed] [Google Scholar]
- 5.Cho H, et al. Regulation of circadian behaviour and metabolism by REV-ERB-alpha and REV-ERB-beta. Nature. 2012;485:123–127. doi: 10.1038/nature11048. doi:nature11048 [pii]10.1038/nature11048. [DOI] [PMC free article] [PubMed] [Google Scholar]
- 6.Bugge A, et al. Rev-erbalpha and Rev-erbbeta coordinately protect the circadian clock and normal metabolic function. Genes & development. 2012;26:657–667. doi: 10.1101/gad.186858.112. [DOI] [PMC free article] [PubMed] [Google Scholar]
- 7.Yu EA, Weaver DR. Disrupting the circadian clock: gene-specific effects on aging, cancer, and other phenotypes. Aging. 2011;3:479–493. doi: 10.18632/aging.100323. [DOI] [PMC free article] [PubMed] [Google Scholar]
- 8.Plikus MV, et al. Local circadian clock gates cell cycle progression of transient amplifying cells during regenerative hair cycling. Proceedings of the National Academy of Sciences of the United States of America. 2013;110:E2106–2115. doi: 10.1073/pnas.1215935110. [DOI] [PMC free article] [PubMed] [Google Scholar]
- 9.Fu L, Pelicano H, Liu J, Huang P, Lee C. The circadian gene Period2 plays an important role in tumor suppression and DNA damage response in vivo. Cell. 2002;111:41–50. doi: 10.1016/s0092-8674(02)00961-3. [DOI] [PubMed] [Google Scholar]
- 10.Sancar A, et al. Circadian clock control of the cellular response to DNA damage. FEBS letters. 2010;584:2618–2625. doi: 10.1016/j.febslet.2010.03.017. [DOI] [PMC free article] [PubMed] [Google Scholar]
- 11.Bass J. Circadian topology of metabolism. Nature. 2012;491:348–356. doi: 10.1038/nature11704. [DOI] [PubMed] [Google Scholar]
- 12.Preitner N, et al. The orphan nuclear receptor REV-ERBalpha controls circadian transcription within the positive limb of the mammalian circadian oscillator. Cell. 2002;110:251–260. doi: 10.1016/s0092-8674(02)00825-5. [DOI] [PubMed] [Google Scholar]
- 13.Yin L, et al. Rev-erbalpha, a heme sensor that coordinates metabolic and circadian pathways. Science. 2007;318:1786–1789. doi: 10.1126/science.1150179. [DOI] [PubMed] [Google Scholar]
- 14.Solt LA, et al. Regulation of circadian behaviour and metabolism by synthetic REV-ERB agonists. Nature. 2012;485:62–68. doi: 10.1038/nature11030. [DOI] [PMC free article] [PubMed] [Google Scholar]
- 15.Woldt E, et al. Rev-erb-alpha modulates skeletal muscle oxidative capacity by regulating mitochondrial biogenesis and autophagy. Nature medicine. 2013;19:1039–1046. doi: 10.1038/nm.3213. [DOI] [PMC free article] [PubMed] [Google Scholar]
- 16.Vieira E, et al. The clock gene Rev-erbalpha regulates pancreatic beta-cell function: modulation by leptin and high-fat diet. Endocrinology. 2012;153:592–601. doi: 10.1210/en.2011-1595. [DOI] [PubMed] [Google Scholar]
- 17.Gorrini C, Harris IS, Mak TW. Modulation of oxidative stress as an anticancer strategy. Nature reviews. Drug discovery. 2013;12:931–947. doi: 10.1038/nrd4002. [DOI] [PubMed] [Google Scholar]
- 18.Peek CB, et al. Circadian clock NAD+ cycle drives mitochondrial oxidative metabolism in mice. Science. 2013;342:1243417. doi: 10.1126/science.1243417. [DOI] [PMC free article] [PubMed] [Google Scholar]
- 19.Currie E, Schulze A, Zechner R, Walther TC, Farese RV., Jr Cellular fatty acid metabolism and cancer. Cell metabolism. 2013;18:153–161. doi: 10.1016/j.cmet.2013.05.017. [DOI] [PMC free article] [PubMed] [Google Scholar]
- 20.White E. Deconvoluting the context-dependent role for autophagy in cancer. Nature reviews. Cancer. 2012;12:401–410. doi: 10.1038/nrc3262. [DOI] [PMC free article] [PubMed] [Google Scholar]
- 21.Rubinsztein DC, Codogno P, Levine B. Autophagy modulation as a potential therapeutic target for diverse diseases. Nature reviews. Drug discovery. 2012;11:709–730. doi: 10.1038/nrd3802. [DOI] [PMC free article] [PubMed] [Google Scholar]
- 22.Ma D, Panda S, Lin JD. Temporal orchestration of circadian autophagy rhythm by C/EBPbeta. The EMBO journal. 2011;30:4642–4651. doi: 10.1038/emboj.2011.322. [DOI] [PMC free article] [PubMed] [Google Scholar]
- 23.Serrano M, Lin AW, McCurrach ME, Beach D, Lowe SW. Oncogenic ras provokes premature cell senescence associated with accumulation of p53 and p16INK4a. Cell. 1997;88:593–602. doi: 10.1016/s0092-8674(00)81902-9. [DOI] [PubMed] [Google Scholar]
- 24.Campisi J, d'Adda di Fagagna F. Cellular senescence: when bad things happen to good cells. Nat Rev Mol Cell Biol. 2007;8:729–740. doi: 10.1038/nrm2233. [DOI] [PubMed] [Google Scholar]
- 25.Bennett G, Childs MG, Baker Darren J, Laberge Remi-Martin, Marquess Dan, Dananberg Jamie, van Deursen Jan M. Senescent cells: an emerging target for diseases of ageing. NATURE REVIEWS DRUG DISCOVERY. 2017 doi: 10.1038/nrd.2017.116. [DOI] [PMC free article] [PubMed] [Google Scholar]
- 26.Quijano C, et al. Oncogene-induced senescence results in marked metabolic and bioenergetic alterations. Cell cycle. 2012;11:1383–1392. doi: 10.4161/cc.19800. [DOI] [PMC free article] [PubMed] [Google Scholar]
- 27.Young AR, et al. Autophagy mediates the mitotic senescence transition. Genes & development. 2009;23:798–803. doi: 10.1101/gad.519709. [DOI] [PMC free article] [PubMed] [Google Scholar]
- 28.Michaloglou C, et al. BRAFE600-associated senescence-like cell cycle arrest of human naevi. Nature. 2005;436:720–724. doi: 10.1038/nature03890. [DOI] [PubMed] [Google Scholar]
- 29.Chang J, et al. Clearance of senescent cells by ABT263 rejuvenates aged hematopoietic stem cells in mice. Nature medicine. 2016;22:78–83. doi: 10.1038/nm.4010. [DOI] [PMC free article] [PubMed] [Google Scholar]
- 30.Marumoto T, et al. Development of a novel mouse glioma model using lentiviral vectors. Nature medicine. 2009;15:110–116. doi: 10.1038/nm.1863. [DOI] [PMC free article] [PubMed] [Google Scholar]
- 31.Di Micco R, et al. Interplay between oncogene-induced DNA damage response and heterochromatin in senescence and cancer. Nature cell biology. 2011;13:292–302. doi: 10.1038/ncb2170. [DOI] [PMC free article] [PubMed] [Google Scholar]
- 32.Hossain A, et al. Mesenchymal Stem Cells Isolated From Human Gliomas Increase Proliferation and Maintain Stemness of Glioma Stem Cells Through the IL-6/gp130/STAT3 Pathway. Stem cells. 2015;33:2400–2415. doi: 10.1002/stem.2053. [DOI] [PMC free article] [PubMed] [Google Scholar]
- 33.Zhang Y, et al. Model-based analysis of ChIP-Seq (MACS) Genome biology. 2008;9:R137. doi: 10.1186/gb-2008-9-9-r137. [DOI] [PMC free article] [PubMed] [Google Scholar]
- 34.Lam MT, et al. Rev-Erbs repress macrophage gene expression by inhibiting enhancer-directed transcription. Nature. 2013;498:511–515. doi: 10.1038/nature12209. [DOI] [PMC free article] [PubMed] [Google Scholar]
- 35.Bligh EG, Dyer WJ. A rapid method of total lipid extraction and purification. Can J Biochem Physiol. 1959;37:911–917. doi: 10.1139/o59-099. [DOI] [PubMed] [Google Scholar]
- 36.Saghatelian A, et al. Assignment of endogenous substrates to enzymes by global metabolite profiling. Biochemistry. 2004;43:14332–14339. doi: 10.1021/bi0480335. [DOI] [PubMed] [Google Scholar]
- 37.Svensson RU, et al. Inhibition of acetyl-CoA carboxylase suppresses fatty acid synthesis and tumor growth of non-small-cell lung cancer in preclinical models. Nature medicine. 2016;22:1108–1119. doi: 10.1038/nm.4181. [DOI] [PMC free article] [PubMed] [Google Scholar]
- 38.Brennan CW, et al. The somatic genomic landscape of glioblastoma. Cell. 2013;155:462–477. doi: 10.1016/j.cell.2013.09.034. [DOI] [PMC free article] [PubMed] [Google Scholar]
- 39.Cancer Genome Atlas Research, N. Comprehensive genomic characterization defines human glioblastoma genes and core pathways. Nature. 2008;455:1061–1068. doi: 10.1038/nature07385. [DOI] [PMC free article] [PubMed] [Google Scholar]
Associated Data
This section collects any data citations, data availability statements, or supplementary materials included in this article.
Supplementary Materials
Data Availability Statement
All data and reagents are available from the authors upon reasonable request. All gel source data are available in Supplementary Fig. 1. Tumor source data (Figure 4f and Extended Data Figure 9d, I) are available in the source data file, ChIP-seq data are available in5 and TCGA data are available in38, 39.


