Abstract
Background
Repetitive transcranial magnetic stimulation (rTMS) is a new type of physiotherapy technology that has been widely used in the research of depression. Although many clinical trials have found that compared to the placebo interventions, rTMS has a significant effect on the improvement of depressive symptoms, the outcomes remain inconsistent due to differences in rTMS treatment frequency, parameter settings, and site for stimulation.
Aims
This study systematically evaluated the safety and efficacy of rTMS combined with antidepressants for the treatment of depression in Chinese and English randomized, double-blind and sham controlled trials and explored the possible related factors affecting the efficacy and safety.
Methods
We used keywords “depression” and “transcranial magnetic Stimulaton” as filters to search for the Clinical Randomized Controlled Trials (RCTs) of rTMS treatments for depression both in Chinese electronic databases: Wan fang, Wellpresi, and China Knowledge Network and in English electronic databases: PubMed, Web of Science, Embase, PsycINFO, Cochrane Library (total 8 databases) up to January 5, 2017; assessed the quality of the included studies with Cochrane risk of bias assessment tool; and according to the trial groups performed statistical analysis of the efficacy and safety presented in the included studies with RevMan5.3 software.
Results
A total of 9798 articles were retrieved, and finally, 29 studies were included in this study, with a total sample size of 1659, in which the sample size of the study groups was 838, and the control group sample size was 821. After Meta-analysis, we found that treatment combined rTMS with antidepressants improves depressive symptoms in patients with depression (SDM=-0.84, 95%CI=-1.19 ~ -0.48). Based on the Cochrane risk bias Assessment tool, an assessment of the bias of the included studies was conducted, one of which was assessed as having a “high risk of bias” and others as “impossible to judge”. None of the included studies reported significant adverse events, and Meta-analysis showed no statistically significant differences in dropout rate between the two groups (RR=1.27, 95%CI: 0.75~2.12, Z=0.89, p=0.37).
Conclusion
treatment that combined rTMS with antidepressant medication for depressive symptoms has a certain therapeutic advantage versus the placebo controls, demonstrated slight side effects, and attained good acceptability, but the differences between trials remained relatively large. Clinical trials with large sample sizes are required for further exploration of the possible related factors affecting the efficacy.
Key words: repetitive transcranial magnetic stimulation, depression, meta-analysis
Abstract
背景
重复经颅磁刺激(repetitive transcranial magnetic stimulation, rTMS)是一种新型的物理治疗技术,已经被广泛用于抑郁症的研究。尽管大量的临床实验发现相对于伪刺激,rTMS 对抑郁症状有改善作用,但是由于rTMS 治疗的频率、参数、部位等不同,因此研究结论仍不一致。
目的
本研究系统评价中英文研究中rTMS 联合抗抑郁药物在随机、双盲、伪刺激对照试验中对郁抑症状治疗的安全性及有效性,探索其中与疗效和安全性的可能相关因素。
方法
利用关键词“ 抑郁”“ 经颅磁刺激” 查询中文数据库:万方、维普、中国知网,英文电子数据库: Pubmed、Web of Science、Embase、PsycInfo、Cochrane Library 共8 个数据库截止到2017 年1 月5 日收录的 rTMS 治疗抑郁症的临床随机对照研究(randomized controlled trials,RCTs),利用Cochrane 风险偏倚评估工具评估纳入研究的文献质量,利用RevMan5.3 软件,根据研究组别对纳入的研究治疗效果及安全性进行统计分析。
结果
共检索到9798 篇文献,最终29 篇文献纳入本研究,总样本量1659 例,其中研究组样本838 例,对照组样本821 例,进行Meta 分析后发现rTMS 联合抗抑郁药物可改善抑郁症患者的抑郁症状(SMD=-0.84, 95%CI=-1.19 ~ -0.48)。纳入的研究中均无重大不良事件报道,Meta 分析两组间脱落率差异无统计学意义(RR=1.27,95%CI: 0.75 ~ 2.12,Z=0.89,p=0.37)。GRADE 对主要结局指标的证据质量评价为中等水平。
结论
抗抑郁药物联合rTMS 治疗抑郁症状相对于伪刺激有一定的治疗优势,副反应轻微,可接受性好,研究间差异较大,有待大样本临床研究探索影响疗效的相关因素。
关键词: :重复经颅磁刺激, 抑郁症, meta 分析
1. Introduction
Depression is a clinically common form of mental illness characterized by depressive mood and / or loss of interest and accompanied by mental disease with somatic and neurophysiological symptoms.[1] WHO reports that depression is one of the major risk factors for years of disability.[2] It is predicted that by 2020, depression will jump from 4th place to the 2nd leading cause of global burden of disease.[3] The pathogenesis of depression in not yet clear, and the treatment for depression is still mainly pharmaceutical; however, many patients treated with pharmacotherapy do achieve ideal outcomes. There still remains a significant portion of patients (20%-30%) who despite having received sufficient dosage and completed the prescribed course of treatment still do not see a total alleviation of depressive symptoms. Although new antidepressants continue to emerge, the side effects of medication therapy are still not completely avoidable.[5]
With the development of imagining technology, research findings show that patients with depression may have organic brain damage. This phenomenon indicates that the pathology of depression is probably related to organic brain damage. Fortunately, thanks to the introduction of a series new techniques in neural modulation, advancements have been made in the treatment of depression. Among these modulation techniques is repetitive transcranial magnetic stimulation (rTMS). Developed in the mid 1980s, the technique is a bio-stimulation that affects and changes the function of the brain. By making use of the time varying magnetic field to act on the cerebral cortex and creating an induced current in the cerebral cortex that alters the action potential of cortical neurons, rTMS is a biological stimulation that affects brain metabolism and neuronal electrical activity. Based on the mechanism of TMS, the induced pulses of current can depolarize neurons and when applied repetitively (an approach known as rTMS) can modulate cortical excitability through altering the parameters of stimulation[6] to repair white brain matter or neurologic damage, thus attaining therapeutic effects.
Repetitive transcranial magnetic stimulation can be divided into high-frequency stimulation (5-20Hz) and low-frequency stimulation (≤1Hz). Depending on the frequency, the high frequencies can increase cortical excitability, and the low-frequency suppresses excitability.[7] Recently, rTMS and fMRI (functional magnetic resonance image, fMRI) were combined to identify cognitive-related brain areas [8-10] responsible for executing cognitive tasks. And with the development of technology, deep transcranial magnetic stimulation has gradually become an effective treatment for mental illness[11,12] Repetitive transcranial magnetic stimulation has been shown to be effective for the treatment of affective disorders such as depression in many randomized controlled studies,[13] but most of the sample size in these studies was relatively small. As a result, general consistent conclusions cannot be drawn across these studies.[14] Clinicians and patients believe that rTMS is a way to treat depression, but there is still a need for more evidence to support the determination of optimal parameter settings for treating depression. Thus, in this study, we compare the efficacy of antidepressants combined with rTMS treatment versus sham controlled rTMS in treating patients with depression.
2. Methods
2.1 Literature screening and retrieval strategy
In this study, we used the keywords: “抑郁”(depression) and “经颅磁刺激”(TMS) to retrieve articles from the Chinese databases: Chinese National Knowledge infrastructure (CNKI), Wang Fang Data, and China Science and Technology Journal Database (CSTJ); and used the keywords: “depress*”, “transcranial magnetic stimulation”, “TMS”, “rTMS” to retrieve from the following English language databases: Embase, PubMed, the Cochrane Library, Web of Science, PsycInfo. We searched for Randomized Control Trials (RCTS) that study the efficacy and safety of rTMS in the treatment of depression, with the date of publication on or before 5 January 2017.
2.2 Inclusion and exclusion criteria
This study included the randomized sham controlled studies of the efficacy and safety of RTMS in the treatment of depression and evaluated the efficacy and safety of the combination of RTMS and antidepressants in the treatment of depression.
2.2.1 Objective of study
All subjects that participated in the study groups were classified according to one of the following psychiatric diagnostic standards: International Classification of Diseases (ICD) [15], Diagnostic and Statistical Manual of Mental Disorders (DSM) [16], or the third edition of the Chinese Mental Illness Diagnostic Standard (CCMD-3).[17]
2.2.2 Included study types
The included studies were randomized controlled trials in which the study group used rTMS intervention and the control group used rTMS sham coils or flipped stimulation coils at a certain angle to achieve the sham stimulus effect. In the outcome, the extent of improvement and side effects in the patients with depression was measured. The research program design types are as follows: ① left high frequency stimulation VS. left high frequency sham stimulation; ② right low frequency stimulation VS right low frequency sham stimulation; ③ left high frequency stimulation (combined with medication treatment) VS left high frequency pseudo-stimulation (combined with medication treatment); ④ right low-frequency stimulation (combined with medication treatment) VS right low-frequency sham stimulation (combined with medication treatment / psychotherapy).
2.2.3 Exclusion criteria
Studies with the following contents were excluded:
(1) Experimental studies using animals; (2) senile depression, postpartum depression, post-traumatic stress disorder with depression; (3) review and case report studies; (4) repeatedly published studies; (5) improvement of non-depressive symptoms, such as, changes in cortical excitability, change in cerebral hemodynamic characteristics, or cognitive functions etc. at treatment outcome as the primary outcome indicators; (6) using blank control as controlled group or studies involving electroconvulsive therapy; (7) studies with unspecified randomization methods and cross-sectional design were excluded.
2.3 Literature screening and data extraction
Two researchers used the same inclusion and exclusion criteria to screen the literature retrieved from the electronic databases. We used the following screen and extraction process: (1) Check for duplicates from the retrieved articles. (2) Titles and abstracts of the retrieved articles were separately screened by two researchers to exclude those articles unrelated to this study. (3) the full text of remaining articles was read to further screen out articles according to listed inclusion and exclusion criteria. (4) Any disagreements about whether articles shoul be included or excluded were discussed among the two researchers, in the case where no consensus could be reached, a third senior research was consulted to make the final determination (see Figure 1 for study flowchart). The included information extraction form was developed by Wei Yanyan. The two researchers extracted the research data separately, and the extracted information included categories such as study authors, year of publication, sample size, true stimulus frequency, stimulus site, stimulus intensity (% of resting motor threshold), sham stimulation mode, and treatment cycle.
Figure 1.
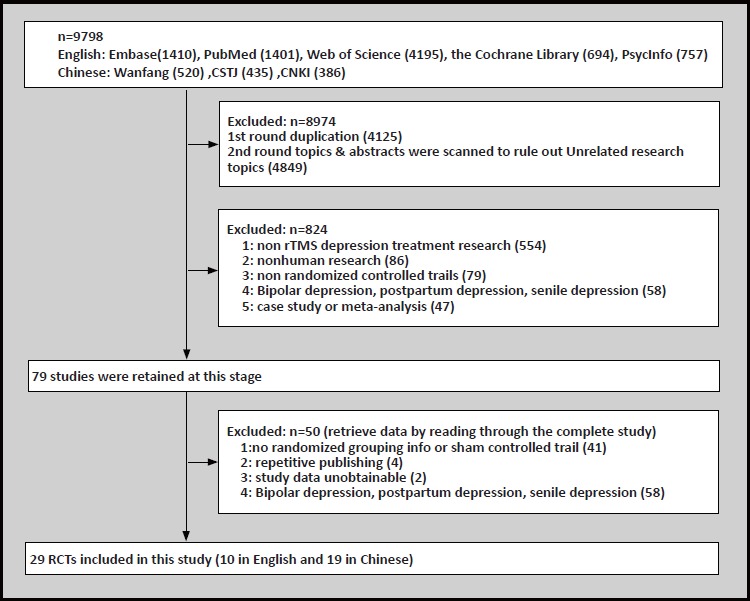
Literatures screening flowchart
2.4 Risk of Bias assessment
A risk of bias assessment was carried out for all RCTs included in this study according to the guidelines put forth by the Cochrane Collaboration Network. The assessment mainly includes the following seven aspects: (1) random sequence generation (selection bias); (2) allocation concealment (selection bias); (3) Blinding of the subjects and the researcher (implementation bias); (4) Blindness of measurement of outcomes (measurement bias); (5) Integrity of the results (attribution bias); (6) Selective reporting of outcomes (reporting bias); (7) Other bias. All risky information included in this study was evaluated separately by two investigators and was discussed and agreed to by a third researcher in cases of disagreement.
2.5 Outcome Measures
Primary outcome measures: Assessment of efficacy of rTMS in treating the depressive symptoms of patients with depression
The outcome measures included in this study were score assigned with 1st priority in the study: Hamilton Depression Rating Scale (HDRS) scores measured before and after the intervention, Montgomery Asberg Depression Rating Scale (MADRS) score before and after the intervention of rTMS as the second priority score, and Beck Depression Inventory (BDI) score change before and after rTMS intervention as the third priority score.
Secondary Outcome Measures: Improvement in overall function, side effects, safety, and tolerability of treatment.
To assess the improvement of overall function of patients with depression after rTMS intervention, we used mainly the scores of Brief Psychiatric Rating Scale (BPRS) and Global Assessment of Functioning (GAF) scores to calibrate the change. Safety was assessed by comparing the differences in adverse reactions between the two groups. The comparison included the general adverse reactions such as headache, nausea, and insomnia and serious adverse reactions such as epilepsy. The acceptability of rTMS treatment was compared by the dropout rate between the two groups during the treatment courses.
2.6 Statistical Analysis
Data were analyzed using the Revman 5.3 statistical software, and heterogeneity was assessed using the χ2 test. When all studies met the statistical homogeneity (p> 0.1, I2 <50%), we used the fixed effects model for Meta-analysis of the treatment effect and side effects; otherwise, we employed the random effects model for Meta-analysis and took the source of heterogeneity into consideration. For the combined effect analysis, we used Standardized Mean Deviation (SMD), Relative Risk (RR) and its 95% CI. The final calculated result was shown in the Forest Plot. Cochrane was used for risk assessment and funnel plot for observing publication bias. At the same time, Stata12.0 linear regression method was designated to detect funnel chart symmetry.
3. Results
3.1 Literature screening process
Using the search strategy specified in above, we retrieved from 5 English databases and 3 Chinese databases a total of 9798 related articles. Endnote Document Management Software was used for exclusion screening, and the following studies were excluded based on the following: duplicate study- 4,125 studies; articles with irrelevant research purposes- 4,849 studies; did not meet inclusion criteria- 824 studies; unknown process in grouping or without randomized sham controlled trials- 45 studies; and repeatedly published- 2 studies[18,19] and duplicate reports from the results of 2 master’s theses.[20,21] In addition, a study was excluded because only the lowest, highest, and median scores for the Hamilton Depression Inventory score for TMS interventions were given, leaving the mean and standard deviation unspecified as well as the side effects and dropout rate unreported.[22] In the end 29 articles were included in this systematic review.[18,23-50]
3.2 Characteristics of included studies
All subjects included in this study were diagnosed with depression with one of the following diagnostic criteria: DSM-IV, CCMD-3, or ICD-10. Three studies were with the subjects that met the diagnostic criteria for refractory depression, and in many cases, the parameters setting in the rTMS treatment were the high-frequency stimulus applied on the left hemisphere. Four of the studies used 1 Hz of low-frequency stimulus over the right hemisphere,[24,28,31,43] and in a 2010 article, the stimulus frequency 5 Hz and 20 Hz were utilized alternately to perform interventions,[26] but to reach equilibrium with the sham controlled group, the subjects included in the sham control were also equally distributed using the frequencies of 5 Hz and 20 Hz. In Xie et al. (2015) 30% resting motor threshold was used, the intensity of the stimulation in all other studies was controlled within the range of 80%-120% of resting motor threshold. In all the included studies, the shortest treatment period was 2 weeks, and the longest was 8 weeks. Twelve studies used sham coil as a means [18,29,31-35,44,46,47,49,50] to setup the sham controlled group; in the remaining studies, the coil was rotated 45, 90, or 180 degrees to achieve the effect of sham therapy, but in George et al., how the sham stimulus control was achieved was not specified.[36] During the entire course of rTMS treatment, all subjects maintained the original type or dose of medication therapy or received a specific dose of medication therapy after a period of evaluation.
3.2.1 Quality of the included studies
In the literature screening process, the studies with unspecified conditions for randomized grouping or with high risk in random grouping were excluded; therefore, in quality assessment of the included studies (see figure 2), all the included studies were presented with conditions depicting the randomized grouping and were rated as “Low risk”. Five studies qualified their randomized allocation concealment,[30, 34-37] and the selection bias was rated as “Low risk.” 11 studies used blind methodology with their experimenters and researchers[18,25,27,29,30,32-34,36,37,43] and performance bias was rated as “Low risk.” One study was selective in reporting their results,[27] the reporting bias was rated as “High risk”. Studies with unclear information were rated as having “Unclear risk”. Figure 3 is a funnel plot that incorporates the trials studying the efficacy of the therapy that uses medication combined with rTMS in the treatment of depression. The existence of an asymmetrical trend may due to publication bias or other causes.
Figure 2.
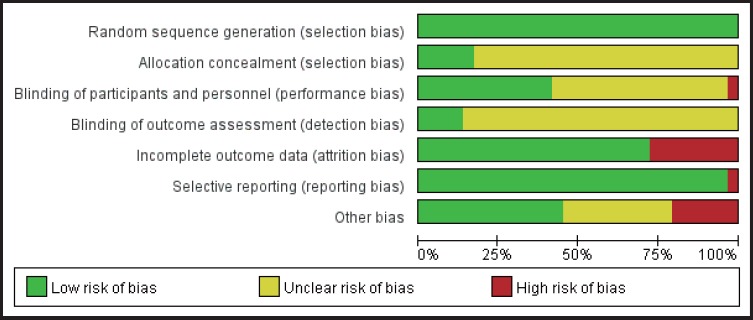
Risk of bias assessment of 29 included studies based on Cochrane Collaboration tool
Figure 3.
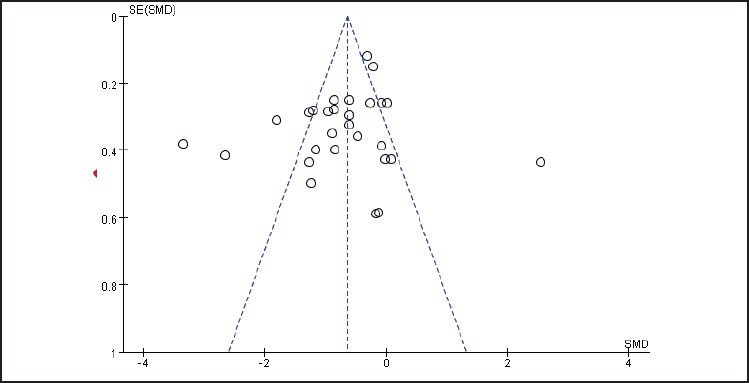
Funnel plot to identify the presence of potential publication bias in 29 included studies on rTMS combined with antidepressant medication in treating depression
3.3 Treatment effect
Of the 29 included studies, the primary outcome measures were the Hamilton Depression Symptom Inventory (HAMD) score before and after the intervention with 6 studies using 21 items on the HAMD scale; 3 studies using 24 items on the HAMD scale; and the remaining studies using 17 items on the HAMD scale. The heterogeneity of the included studies was high (χ2 = 293.24, I2 = 90%); therefore, the random effects model was used for meta-analysis. The results show that efficacy of the rTMS combined with antidepressant therapy in treatment of depression is significantly higher than the sham stimulation group (SMD = -0.84, 95% CI: -1.19 ~ -0.48), and the difference was statistically significant (Z = 4.65, p< 0.01) See Figure 4. According to the GRADE score, as the main outcome measure, i.e. the improvement in symptoms of depression in rTMS interventions, the overall quality level of evidence is “moderate” as shown in Table 2.
Figure 4.
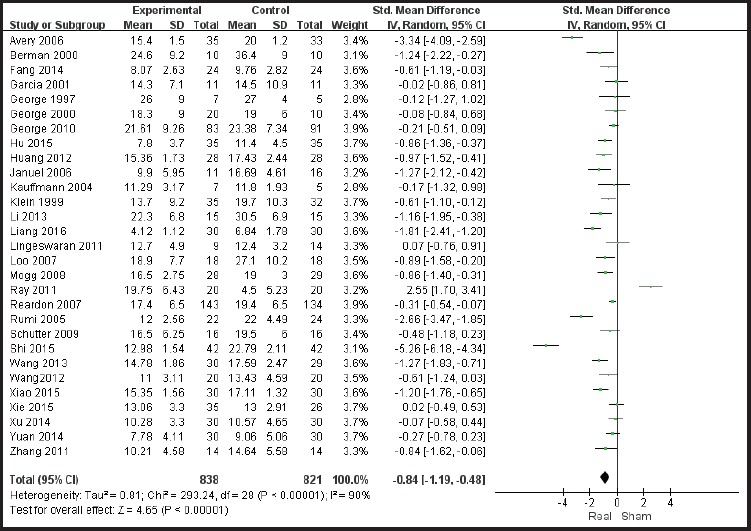
Meta-analysis forest plot showing efficacy of rTMS combined with antidepressant medication treatment versus sham control treatment in treating depression
Table 2.
GRADE quality of evidence assessment of individual outcome indicators for the efficacy of rTMS combined with antidepressant medication therapy in the treatment of depression
| Outcome indicator | No. of sample cases in the included studies | heterogeneity | Model of analysis | Group effect value | Estimated value | 95% Confidence interval | GRADE quality of evidence | ||
|---|---|---|---|---|---|---|---|---|---|
| I2 | p | Z | p | ||||||
| Treatment effect | 1659 | 90% | <0.01 | Random effect model | 4.65 | <0.01 | 0.84(SMD) | -1.19,-0.48 | Moderate |
| Side effect | 1353 | 38% | 0.06 | Fixed effect model | 4.62 | <0.01 | 1.96(RR) | 1.47,2.61 | Moderate |
| Drop-out rate | 882 | 0% | 0.82 | Fixed effect model | 0.89 | 0.37 | 1.27(RR) | 0.75,2.12 | Moderate |
SMD: standardized mean difference; RR: relative risk;
GRADE: The Grading of Recommendations Assessment, Development and Evaluation
3.4 Subgroup analysis
According to the sites of stimulation (the left hemisphere and right hemisphere) the studies are divided into subgroups. The results of subgroup analysis were χ2 = 518.84, I2 = 96% and χ2 = 7.65, I2 = 48%. The heterogeneity results were χ2 = 529.07, I2 = 95%, p<0.01 (see Figure 5), suggesting greater heterogeneity with the left hemisphere stimulation site. According to the administered frequencies of stimulation the studies were divided into two groups: a group with high-frequency stimulation >1 Hz and a group with low-frequency stimulation ≤1Hz, and the sub-group analysis results were χ2 = 489.56, I2 = 95% and χ2 = 7.65, and I2= 61% respectively. The combined heterogeneity results were χ2 = 499.37 and I2= 94%, p<0.01 (see Figure 6). Subgroup analyzes were performed according to the duration of the treatment course (i.e. treatment course ≤4 weeks and> 4 weeks). The subgroup analysis results were χ2 = 471.26, I2= 95% and χ2 = 9.62, I2 = 58% Post hoc heterogeneity resulted in χ2 = 502.28, I2= 94%, p <0.01 (see Figure 7). Subgroup analyzes were performed over the differences between studies published in Chinese-language journals and studies published in English-language journals. The subgroup analyzes showed χ2 = 203.52, I2 = 91%, χ2 = 290.18, and I2= 97%, respectively. The combined heterogeneity was χ2 = 499.37, I2 = 94%, p <0.01 (see Figure 8).
Figure 5.
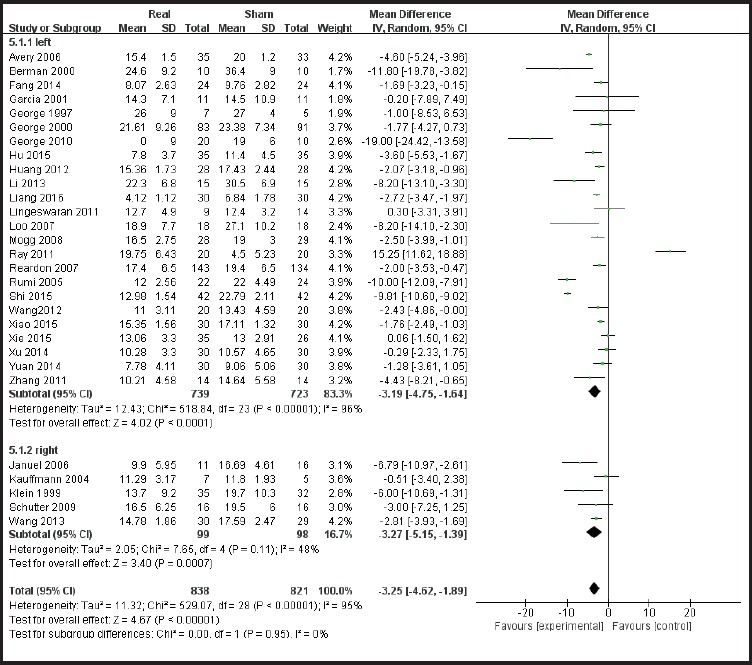
Subgroup analysis forest plot of stimulation on the left hemisphere versus stimulation on the right hemisphere
Figure 6.
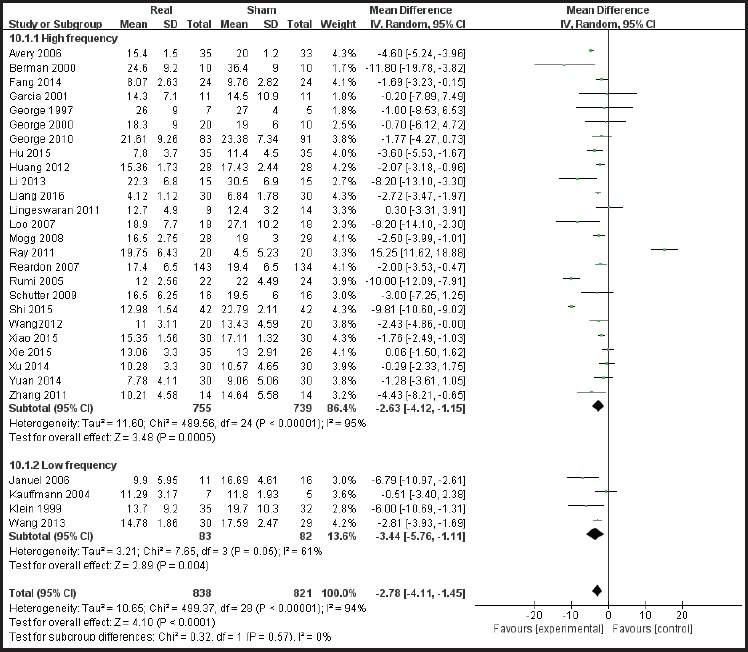
Forest plot of subgroup analysis of high frequency stimulation vs low frequency stimulation
Figure 7.
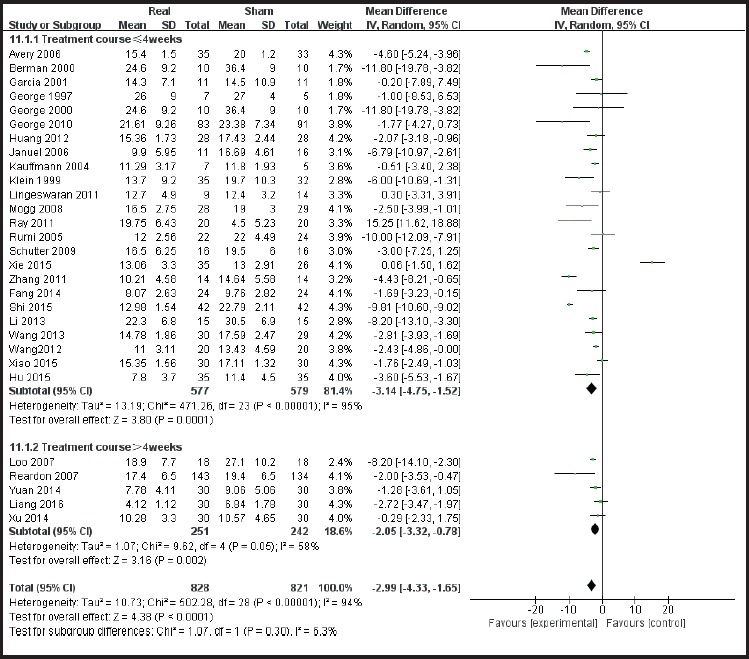
Forest plot showing Subgroup analysis of course of treatment≤4 weeks VS course of treatment>4 weeks
Figure 8.
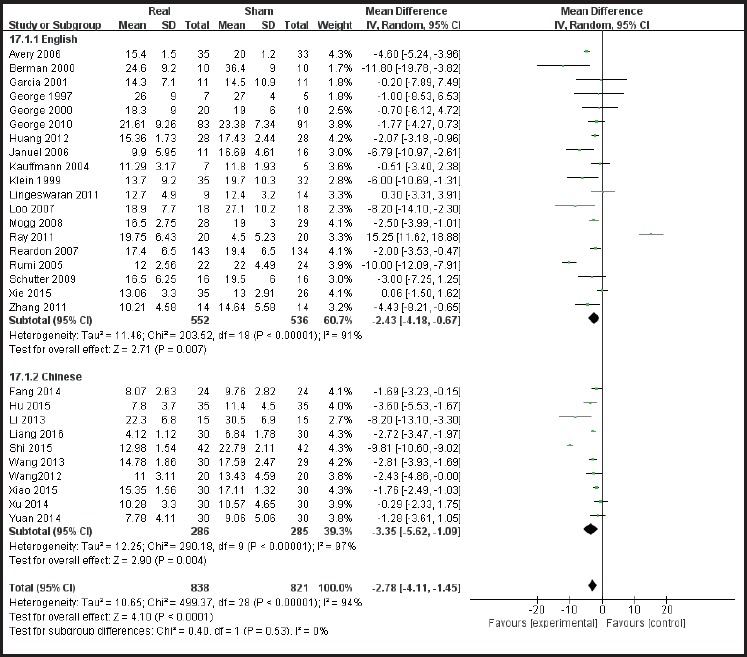
Forest plot showing subgroup analysis of efficacy in English studies vs the efficacy in Chinese Studies
3.5 Heterogeneity Meta-regression
Given that heterogeneity may be due to the differences in the severity, age, and prescript stimulations parameters of the subjects, linear regression was used to assess the relationship between heterogeneity and baseline depression, age of participants, and stimulation parameters. Baseline HAMD scores, intensity of stimulation, frequency of stimulation, and stimulation regimens were included as factors in the regression model to assess the effect on heterogeneity. Baseline HAMD scores and regression analysis of age alone showed P values of 0.993 and 0.142, suggesting that the severity and age of patients with baseline depression were not a contributing factor to heterogeneity. Then the stimulation intensity, stimulation frequency and stimulation treatment course were included in the regression model to get the p value of 0.052, 0.536 and 0.047 respectively. The intensity and stimulation treatment course may be related factors causing heterogeneity. Among the two factors, when the course of treatment was put into the regression model, that explained 12.8% of the variation in heterogeneity.
3.6 Meta-analysis of adverse reactions
None of the included studies reported serious adverse effects. Twenty of the studies reported their subjects experienced slight discomfort including: headache, pain in the stimulation site, muscle tension, dizziness, loss of interest et cetera. Of the 690 subjects in the true stimulation treatment group, 319 reported discomfort, and 108 of 663 subjects in the sham controlled group reported discomfort. The included studies were statistically homogenous (χ2 = 25.60, p= 0.06, I2= 38%), thus a statistical analysis using the fixed effects model was performed. The results showed that rTMS combined with antidepressants in the treatment of depression has a higher incidence rate of side effects, RR = 1.96, 95% CI: 1.47 ~ 2.61. (Figure 9)
Figure 9.
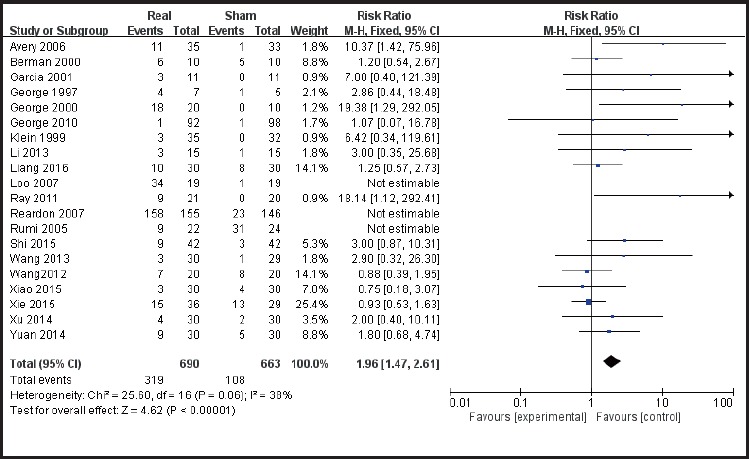
Forest plot showing side effects of rTMS combined with antidepressant medication treatment for depression
3.7 Meta-analysis of dropout rate
Twelve included studies reported participant withdrawal, and meta-analysis of the withdrawal cases data was performed. The results showed good homogeneity among the studies (χ2 = 6.76, p = 0.82, I2= 0), and were analyzed using the fixed effects model. There were no significant differences between the two groups (27 cases in the stimulus group and 22 cases in the sham controlled group), the difference was not statistically significant (RR = 1.27, 95% CI: 0.75-2.12, Z = 0.89).
4. Discussion
4.1 Main findings
Although pharmacotherapy is still the most commonly used treatment for depression, rTMS treatment for patients with refractory depression is an available option. The results of this study show that rTMS treatment of depression has a higher incidence rate of side effects, because the included studies use selfreporting methods to collect data on side effects from the subjects and seldom use scales for quantitative assessment. Also, the side effects disappeared shortly after treatment.
Although there are many meta-analyzes on the efficacy of rTMS in the treatment of depression, most of them are confined to the English literature. The present study focused on the efficacy of rTMS versus the sham control in the treatment of depressive symptoms. Compared with the previous meta-analyses, this study has larger sample size that consists of 29 studies and a total sample size of 1659 subjects and included Chinese literature, of which 10 studies were randomized controlled trials published in Chinese, and the sample size of 571 cases in these Chinese studies accounted for a certain percentage of the total sample size. The quality of evidence of GRADE for the primary outcome measure (treatment effect) was “moderate,” and the study of rTMS in combination with drug therapy for depression requires further improvement in the quality of studies; side effects and dropout rates to show the acceptability of using rTMS to treat patients with depression.
4.2 Limitations
Although all enrolled studies employed randomized grouping and blind methods in evaluation, the study outcomes show that heterogeneity among the included studies was high. Heterogeneity was analyzed by using regression model and subgroup analysis, etc. The stimulus frequency, stimulus intensity and duration of treatment courses were set to the regression model, and the results showed that duration of the treatment course may be one of the factors causing heterogeneity. Similarly, there may be other factors, such as the subjects’ course of disease and number of stimulus train, determining heterogeneity.
4.3 Implications
Treatment combined rTMS with antidepressants pharmacotherapy is an important option for clinicians in treating depression. Especially for some refractory cases of depression, rTMS is a feasible option for consideration. However, affecting the treatment, there are many parameters, such as the intensity of the stimulus, frequency of the stimulus train, the site for stimulation, or even the course of treatment. Testing and optimizing these parameters settings and as much as exploring the maintenance effect of rTMS after treatment still depends on the yet to come representative randomized clinical trials.
Table 1.
Basic information of the included studies
| No | study | Diagnostic criteria | N(M/F) | Age(M±SD) | Site for stimulation | Frequency | Magnitude (%MT) | Course of therapy (week) | Sham stimulation | Combined with medication (Y/N) |
|---|---|---|---|---|---|---|---|---|---|---|
| rTMS group | Sham stimulation group | |||||||||
| 1 | George 1997 | DSM-IV | 7(1/6) 42.4(15.47) | 5(0/5) 41.0(8.28) | Left DLPFC | 20 Hz | 90 | 4 | 45o | Y |
| 2 | Klein 1999 | DSM-IV | 36(7/29) 60.5(15.1) | 34(10/24) 58.9(18.3) | Right prefrontal area | 1 Hz | 110 | 2 | 45o | Y |
| 3 | Berman 2000 | DSM-IV | 10(8/2) 45.2(9.54) | 10(6/4) 39.4(10.81) | Left DLPFC | 20 Hz | 80 | 2 | 45o | Y |
| 4 | George 2000 | 20(7/13) 42.2(10.8) | 10(4/6) 48.5(8) | Left prefrontal cortex | 5/20 Hz | 100 | 2 | 45o | Y | |
| 5 | Garcia 2001 | DSM-IV | 11(5/6) 43.2(13.1) | 11(5/6) 45.0(18.3) | Left DLPFC | 20 Hz | 90 | 2 | 90o | Y |
| 6 | Kauffmann 2004 | DSM-IV | 5(NA) (NA) | 7(NA) (NA) | 5cm anterior to the Right Motor Cortex | 1 Hz | 110 | 2 | 45o | Y |
| 7 | Rumi 2005 | DSM-IV | 22(3/19) 39.3(12.8) | 24(4/20) 38.9(8.8) | Left DLPFC | 5 Hz | 120 | 4 | Sham coil | Y |
| 8 | Avery 2006 | DSM-IV | 35(14/21) 26.2(12.3) | 33(17/16) 25.4(11.7) | Left DLPFC | 10 Hz | 110 | 3 | 90o | Y |
| 9 | Januel 2006 | DSM-IV | 11(2/9) 38.64(11.16) | 16(4/12) 37.19(11.67) | Right DLPFC | 1Hz | 90 | 4 | Sham coil | Y |
| 10 | Loo 2007 | DSM-IV | 19(11/8) 45.7(15.0) | 19(9/10) 49.8(2.5) | Left DLPFC | 10Hz | 110 | 6 | Sham coil | Y |
| 11 | Reardon 2007 | DSM-IV | 155(69/86) 47.9(11.0) | 146(72/74) 48.7(10.6) | Left DLPFC | 10 Hz | 120 | 6 | Sham coil | Y |
| 12 | Mogg 2008 | DSM-IV | 29(13/16) 55(18.0) | 30(9/21) 52(15.5) | Left DLPFC | 10 Hz | 110 | 2 | Sham coil | Y |
| 13 | Schutter 2009 | DSM-IV | 17(7/10) 44.4(11.8) | 17(10/7) 43.8(12.5) | Right parietal cortex | 2 Hz | 90 | 2 | Sham coil | Y |
| 14 | George 2010 | DSM-IV | 92(34/58) 47.7(10.6) | 98(36/62) 46.5(12.3) | Left prefrontal cortex | 10 Hz | 120 | 2 | NA | Y |
| 15 | Lingeswaran 2011 | DSM-IV | 9(3/6) 34(10.5) | 14(6/8) 37.2(11.8) | Left DLPFC | 10 Hz | 100 | 2 | 90o | Y |
| 16 | Ray 2011 | ICD-10 | 20(15/5) 36.75(12.27) | 20(17/3) 31.25(9.28) | Left DLPFC | 10 Hz | 90 | 2 | 45o | Y |
| 17 | Huang 2012 | DSM-IV | 28(9/19) 32.77(7.28) | 28(8/20) 31.35(7.39) | Left DLPFC | 10 Hz | 90 | 2 | 90o | Y |
| 18 | XIE 2015 | ICD-10 | 35(12/23) 65.3(5.1) | 26(8/18) 64.7(4.2) | Left DLPFC | 10Hz | 30 | 4 | Mock-coil | Y |
| 19 | Zhang 2011 | DSM-IV | 14(11/3) 50.8(13.3) | 14(9/5) 43.8(13.9) | Left DLPFC | 10 Hz | 110 | 4 | 180o | Y |
| 20 | Wang 2012 | CCMD-3 | 20(15/5) 34.85(13.71) | 20(14/6) 36.75(16.70) | Left DLPFC | 15 Hz | 110 | 4 | 180o | Y |
| 21 | Li 2013 | CCMD-3 | 15(9/6) NR | 15(8/7) NR | Left DLPFC | 10 Hz | 100 | 4 | 90o | Y |
| 22 | Wang 2013 | DSM-IV | 30(14/16) 37.68(8.13) | 29(13/16) 38.13(7.79) | right DLPFC | 1 Hz | 100 | 4 | 90o | Y |
| 23 | Fang 2014 | DSM-IV | 24(9/15) 41.63(11.02) | 24(10/14) 44.58(12.36) | left DLPFC | 10 Hz | 80 | 2 | Sham coil | Y |
| 24 | Yuan 2014 | DSM-IV | 30(9/21) 34.81±9.74 | 30(11/19) 36.76±17.79 | left DLPFC | 20 Hz | 110 | 6 | Sham coil | Y |
| 25 | Xu 2014 | CCMD-3 | 30(16/14) 35.4(8.6) | 30(15/15) 36.2(8.3) | left DLPFC | 10 Hz | 80 | 6 | 90o | Y |
| 26 | Hu 2015 | CCMD-3 | 35(20/15) 36.0(7.2) | 35(19/16) 35.6(7.5) | left DLPFC | 1-20 Hz | 80-110 | 4 | Sham coil | Y |
| 27 | Shi 2015 | ICD-10 | 42(19/23) NR | 42(21/21) NR | left DLPFC | 10 Hz | 100 | 4 | 90o | Y |
| 28 | Xiao 2015 | ICD-10 | 30(12/18) 31.6(10.2) | 30(11/19) 32.9(14.2) | left DLPFC | 10 Hz | 80 | 4 | Sham coil | Y |
| 29 | Liang 2016 | DSM-IV | 30(15/15) 36.60(5.75) | 30(13/17) 36.45(5.71) | left DLPFC | 10 Hz | NA | 8 | Sham coil | Y |
Remarks: N: number of subjects included in a study; M: Mean; SD:Standard deviation; DLPFC: Dorsolateral Prefrontal Cortex; MT: Motor Threshold; Y: Yes; N: No; NA: Not Applied
Acknowledgement
Thank Jiang Jiangling and Zhu Yikang for their guidance on data analysis of this study.
Biography

Wei Yanyan graduated from Wannan Medical College in 2009 with a bachelor’s degree in management of public health and graduated from the Second Military Medical University in 2016 with a master’s degree in medical psychology. She has been working at the Mental Health Center affiliated to Shanghai Jiaotong University School of Medicine since 2016, and her research interests include early identification and intervention of schizophrenia.
Footnotes
Funding statement
Shanghai Jiao Tong University Medical Crossing Project (YG2016QN42), Shanghai Municipal Health and Family Planning Commission Research Project (20174Y0013,20134282) National Natural Science Foundation of China (81671332), Shanghai Science and Technology Commission Medical guidance topics (16411965000)
Conflicts of interest statement
All authors claim no conflict of interest related to this article.
Authors’ contribution
Wei Yan Yan was responsible for the literature search; Zhu Junjuan, Pan Shengke, Su Hui were responsible the literature screening; Wei Yanyan, Zhu Junjuan, Pan Shengke, Su Hui were responsible for the data retrieval; Wei Yan Yan and Zhu Junjuan were responsible for the bias assessment; Wei Yan Yan and Zhu Junjuan were responsible for the statistical analysis and writing of this paper; Wang Jijun was responsible planning and guidance on this paper.
References
- 1.Doris A, Ebmeier K, Shajahan P. Depressive illness. Lancet. 1999; 354(9187): 1369-1375. doi: http://dx.doi.org/10.1016/S0140-6736(99)03121-9 [DOI] [PubMed] [Google Scholar]
- 2.Lopez AD, Mathers CD, Ezzati M, Jamison DT, Murray CJ. Global and regional burden of disease and risk factors, 2001: systematic analysis of population health data. Lancet. 2006; 367(9524): 1747-1757. doi: http://dx.doi.org/10.1016/S0140-6736(06)68770-9 [DOI] [PubMed] [Google Scholar]
- 3.Brown P. The global burden of disease. A comprehensive assessment of mortality and disability from diseases injuries and risk factors in 1990 and projected to 2020. Summary. Boston Massachusetts Harvard University School of Public Health; 1990; 3(9): 1308-1314 [Google Scholar]
- 4.Rush AJ, Thase ME, Dube S. Research issues in the study of difficult-to-treat depression. Biol Psychiatry. 2003; 53(8): 743-753. doi: http://dx.doi.org/10.1016/S0006-3223(03)00088-X [DOI] [PubMed] [Google Scholar]
- 5.Can OD, Osmaniye D, Demir Ozkay U, Saglik BN, Levent S, Ilgin S, et al. MAO enzymes inhibitory activity of new benzimidazole derivatives including hydrazone and propargyl side chains. Eur J Med Chem. 2017; 131: 92-106. doi: http://dx.doi.org/10.1016/j.ejmech.2017.03.009 [DOI] [PubMed] [Google Scholar]
- 6.Fregni F, Pascual-Leone A. Technology insight: noninvasive brain stimulation in neurology-perspectives on the therapeutic potential of rTMS and tDCS. Nat Clin Pract Neurol. 2007; 3(7): 383-393. doi: http://dx.doi.org/10.1038/ncpneuro0530 [DOI] [PubMed] [Google Scholar]
- 7.Morellini N, Grehl S, Tang A, Rodger J, Mariani J, Lohof AM, Sherrard RM. What does low-inten 10.1002/hbm.22339 sity rTMS do to the cerebellum? Cerebellum. 2015; 14(1): 23-26. doi: http://dx.doi.org/10.1007/s12311-014-0617-9 [DOI] [PubMed] [Google Scholar]
- 8.Julian JB, Ryan J, Hamilton RH, Epstein RA. The Occipital Place Area Is Causally Involved in Representing Environmental Boundaries during Navigation. Curr Biol. 2016; 26(8): 1104-1109. doi: http://dx.doi.org/10.1016/j.cub.2016.02.066 [DOI] [PMC free article] [PubMed] [Google Scholar]
- 9.Ahdab R, Ayache SS, Brugieres P, Farhat WH, Lefaucheur JP. The Hand Motor Hotspot is not Always Located in the Hand Knob: A Neuronavigated Transcranial Magnetic Stimulation Study. Brain Topogr. 2016; 29(4): 590-597. doi: http://dx.doi.org/10.1007/s10548-016-0486-2 [DOI] [PubMed] [Google Scholar]
- 10.Ahdab R, Ayache SS, Farhat WH, Mylius V, Schmidt S, Brugieres P, Lefaucheur JP. Reappraisal of the anatomical landmarks of motor and premotor cortical regions for image-guided brain navigation in TMS practice. Hum Brain Mapp. 2014; 35(5): 2435-47. doi: http://dx.doi.org/10.1002/hbm.22339 [DOI] [PMC free article] [PubMed] [Google Scholar]
- 11.Paz Y, Friedwald K, Levkovitz Y, Zangen A, Alyagon U, Nitzan U, et al. Randomised sham-controlled study of high-frequency bilateral deep transcranial magnetic stimulation (dTMS) to treat adult attention hyperactive disorder (ADHD): Negative results. World J Biol Psychiatry. 2017; 2017: 1-6. doi: http://dx.doi.org/10.1080/15622975.2017.1282170 [DOI] [PubMed] [Google Scholar]
- 12.Levkovitz Y, Isserles M, Padberg F, Lisanby SH, Bystritsky A, Xia G, et al. Efficacy and safety of deep transcranial magnetic stimulation for major depression: a prospective multicenter randomized controlled trial. World Psychiatry. 2015; 14(1): 64-73. doi: http://dx.doi.org/10.1002/wps.20199 [DOI] [PMC free article] [PubMed] [Google Scholar]
- 13.Zhang J, Cui M, Wu Y, Song H, Zhai C, Deng J, et al. [The effect of low frequency repetitive transcranial magnetic stimulation combined with duloxetine in treatment of depression]. Zhongguo Shen Jing Jing Shen Ji Bing Za Zhi. 2015; 41(5): 288-292. Chinese [Google Scholar]
- 14.Aguirre I, Carretero B, Ibarra O, Kuhalainen J, Martinez J, Ferrer A, et al. Age predicts low-frequency transcranial magnetic stimulation efficacy in major depression. J Affect Disord. 2011; 130(3): 466-469. doi: http://dx.doi.org/10.1016/j.jad.2010.10.038 [DOI] [PubMed] [Google Scholar]
- 15.Organization WH. The ICD-10 Classification of Mental and Behavioural Disorders-Diagnostic Criteria for Research. Geneva: World Health Organization; 1993 [Google Scholar]
- 16.Association AP. Diagnostic and Statistical Manual of Mental Disorders. 4th ed. Washington DC: APA; 1994 [Google Scholar]
- 17.Chinese Medical Association Psychiatry Branch. China Classification and Diagnostic Criteria of Mental Disorders, 3rd Edition (Mental Disorders); 2001 [Google Scholar]
- 18.Fang M, Reng YP, Liu H, Zhou F, Wang G. [The treatment of repetitive transcranial magnetic stimulation combined with Pa Rossi Dean on major depressive disorder]. Shou Du Yi Ke Da Xue Xue Bao. 2014; 35(2): 194-199. Chinese. doi: http://dx.chinadoi.cn/10.3969/j.issn.1006-7795.2014.02.011 [Google Scholar]
- 19.Ray S, Nizamie SH, Akhtar S, Praharaj SK, Mishra BR, Zia-Ul-Haq M. Efficacy of adjunctive high frequency repetitive transcranial magnetic stimulation of left prefrontal cortex in depression: A randomized sham controlled study. J Affect Disord. 2014; 156: 247-247. doi: http://dx.doi.org/10.1016/j.jad.2010.06.027 [DOI] [PubMed] [Google Scholar]
- 20.Zhang YM. [The control study of low frequency repetitive transcranial magnetic stimulation in the treatment of depression (thesis)]. Nanchang: Medical College of Nanchang University; 2010. Chinese [Google Scholar]
- 21.Fang M. [A randomized double-blind control study of repetitive transcranial magnetic stimulation combined with Pa Rossi Dean in the treatment of major depressive disorder (thesis)]. Beijing: Capital Medical University; 2008. Chinese [Google Scholar]
- 22.Concerto C, Lanza G, Cantone M, Ferri R, Pennisi G, Bella R, et al. Repetitive transcranial magnetic stimulation in patients with drug-resistant major depression: A six-month clinical follow-up study. Int J Psychiatry Clin Pract. 2015; 19(4): 253-259. doi: http://dx.doi.org/10.3109/13651501.2015.1084329 [DOI] [PubMed] [Google Scholar]
- 23.George MS, Wassermann EM, Kimbrell TA, Little JT, Williams WE, Danielson AL, et al. Mood improvement following daily left prefrontal repetitive transcranial magnetic stimulation in patients with depression: A placebo-controlled crossover trial. Am J Psychiatry. 1997; 154(12): 1752-1756. doi: http://dx.doi.org/10.1176/ajp.154.12.1752 [DOI] [PubMed] [Google Scholar]
- 24.Klein E, Kreinin I, Chistyakov A, Koren D, Mecz L, Marmur S, et al. Therapeutic efficacy of right prefrontal slow repetitive transcranial magnetic stimulation in major depression: a double-blind controlled study. Arch Gen Psychiatry. 1999; 56(4): 315-320. doi: http://dx.doi.org/10.1136/jnnp.71.4.546 [DOI] [PubMed] [Google Scholar]
- 25.Berman RM, Narasimhan M, Sanacora G, Miano AP, Hoffman RE, Hu XS, et al. A randomized clinical trial of repetitive transcranial magnetic stimulation in the treatment of major depression. Biol Psychiatry. 2000; 47(4): 332-337. doi: http://dx.doi.org/10.1016/S0006-3223(99)00243-7 [DOI] [PubMed] [Google Scholar]
- 26.George MS, Nahas Z, Molloy M, Speer AM, Oliver NC, Li XB, et al. A controlled trial of daily left prefrontal cortex TMS for treating depression. Biol Psychiatry. 2000; 48(10): 962-970. doi: http://dx.doi.org/10.1016/S0006-3223(00)01048-9 [DOI] [PubMed] [Google Scholar]
- 27.Garcia-Toro M, Pascual-Leone A, Romera M, González A, Micó J, Ibarra O, et al. Prefrontal repetitive transcranial magnetic stimulation as add on treatment in depression. J Neurol Neurosurg Psychiatry. 2001; 71(4): 546-548. doi: http://dx.doi.org/10.1136/jnnp.71.4.546 [DOI] [PMC free article] [PubMed] [Google Scholar]
- 28.Kauffmann CD, Cheema MA, Miller BE. Slow right prefrontal transcranial magnetic stimulation as a treatment for medication-resistant depression: A double-blind, placebo-controlled study. Depress Anxiety. 2004; 19(1): 59-62. doi: http://dx.doi.org/10.1002/da.10144 [DOI] [PubMed] [Google Scholar]
- 29.Rumi DO, Gattaz WF, Rigonatti SP, Rosa MA, Fregni F, Rosa MO, et al. Transcranial magnetic stimulation accelerates the antidepressant effect of amitriptyline in severe depression: A double-blind placebo-controlled study. Biol Psychiatry. 2005; 57(2): 162-166. doi: http://dx.doi.org/10.1016/j.biopsych.2004.10.029 [DOI] [PubMed] [Google Scholar]
- 30.Avery DH, Holtzheimer PE, Fawaz W, Russo J, Neumaier J, Dunner DL, et al. A controlled study of repetitive transcranial magnetic stimulation in medication-resistant major depression. Biol Psychiatry. 2006; 59(2): 187-194. doi: http://dx.doi.org/10.1016/j.biopsych.2005.07.003 [DOI] [PubMed] [Google Scholar]
- 31.Januel D, Dumortier G, Verdon CM, Stamatiadis L, Saba G, Cabaret W, et al. A double-blind sham controlled study of right prefrontal repetitive transcranial magnetic stimulation (rTMS): Therapeutic and cognitive effect in medication free unipolar depression during 4 weeks. Prog Neuropsychopharmacol Biol Psychiatry. 2006; 30(1): 126-130. doi: http://dx.doi.org/10.1016/j.pnpbp.2005.08.016 [DOI] [PubMed] [Google Scholar]
- 32.Loo C K, Mitchell PB, Mcfarquhar TF, Malhi GS, Sachdev PS. Sham-controlled trial of the efficacy and safety of twice-daily rTMS in major depression. Psychol Med. 2007; 37(3): 341-349. doi: http://dx.doi.org/10.1017/S0033291706009597 [DOI] [PubMed] [Google Scholar]
- 33.O’reardon JP, Solvason HB, Janicak PG, Sampson S, Isenberg KE, Nahas Z, et al. Efficacy and safety of transcranial magnetic stimulation in the acute treatment of major depression: A multisite randomized controlled trial. Biol Psychiatry. 2007; 62(11): 1208-1216. doi: http://dx.doi.org/10.1016/j.biopsych.2007.01.018 [DOI] [PubMed] [Google Scholar]
- 34.Mogg A, Pluck G, Eranti SV, Landau S, Purvis R, Brown RG, et al. A randomized controlled trial with 4-month follow-up of adjunctive repetitive transcranial magnetic stimulation of the left prefrontal cortex for depression. Psychol Med. 2008; 38(3): 323-333. doi: http://dx.doi.org/10.1017/S0033291707001663 [DOI] [PubMed] [Google Scholar]
- 35.Schutter DJ, Laman DM, Van Honk J, Vergouwen AC, Koerselman GF. Partial clinical response to 2 weeks of 2 Hz repetitive transcranial magnetic stimulation to the right parietal cortex in depression. Int J Neuropsychopharmacol. 2009; 12(5): 643-650. doi: http://dx.doi.org/10.1017/S1461145708009553 [DOI] [PubMed] [Google Scholar]
- 36.George MS, Lisanby SH, Avery D, Mcdonald WM, Durkalski V, Pavlicova M, et al. Daily left prefrontal transcranial magnetic stimulation therapy for major depressive disorder: A sham-controlled randomized trial. Arch Gen Psychiatry. 2010; 67(5): 507-516. doi: http://dx.doi.org/10.1001/archgenpsychiatry.2010.46 [DOI] [PubMed] [Google Scholar]
- 37.Lingeswaran A. Repetitive Transcranial Magnetic Stimulation in the Treatment of depression: A Randomized, Double-blind, Placebo-controlled Trial. Indian J Psychol Med. 2011; 33(1): 35-44. doi: http://dx.doi.org/10.4103/0253-7176.85393 [DOI] [PMC free article] [PubMed] [Google Scholar]
- 38.Ray S, Nizamie SH, Akhtar S, Praharaj SK, Mishra BR, Zia-Ul-Haq M, et al. Efficacy of adjunctive high frequency repetitive transcranial magnetic stimulation of left prefrontal cortex in depression: A randomized sham controlled study. J Affect Disord. 2011; 128(12): 153-159. doi: http://dx.doi.org/10.1016/jjad.2010.06.027 [DOI] [PubMed] [Google Scholar]
- 39.Zhang XH, Wang LW, Wang JJ, Liu Q, Fan Y. [Adjunctive treatment with transcranial magnetic stimulation in treatment resistant depressions randomized, double-blind, sham-controlled study]. Shanghai Arch Psychiatry. 2011; 23(1): 17-24. Chinese. doi: http://dx.chinadoi.cn/10.3969/j.issn.1002-0829.2011.01.005 [Google Scholar]
- 40.Huang ML, Luo BY, Hu JB, Wang SS, Zhou WH, Wei N, et al. Repetitive transcranial magnetic stimulation in combination with citalopram in young patients with first-episode major depressive disorder: a double-blind, randomized, sham-controlled trial. Aust N Z J Psychiatry. 2012; 46(3): 257-64. doi: http://dx.doi.org/10.1177/0004867411433216 [DOI] [PubMed] [Google Scholar]
- 41.Wang Z, Wang HN, Chen YC, Wang HH, Zhang YH, Xi M, et al. [High frequency repetitive transcranial magnetic stimulation as adjuvant treatment of venlafaxine in the treatment of depression]. Lin Chuang Jing Shen Yi Xue Za Zhi. 2012; 22(3): 188-190. Chinese [Google Scholar]
- 42.Li J, Lin WC, Liang L, Wang HK. [Clinical Study on rTMS and Mirtazapine in the Treatment of Treatment-Resistant Depression]. Lin Chuang Yi Xue Gong Cheng. 2013; 20(7): 785-786. Chinese. doi: http://dx.chinadoi.cn/10.3969/j.issn.1674-4659.2013.07.0785 [Google Scholar]
- 43.Wang LN, Pan F, Li YF. [Effects of low frequency repetitive transcranial magnetic stimulation on treatment-resistant depression and cognitive function]. Zhongguo Kang Fu Yi Xue Za Zhi. 2013; 28(6): 544-548. Chinese. doi: http://dx.chinadoi.cn/10.3969/j.issn.1001-1242.2013.06.012 [Google Scholar]
- 44.Qi GC. [Efficacy of high frequency rTMS combined with duloxetine in the treatment of depression]. Jing Shen Yi Xue Za Zhi. 2014; 27(6): 455-457. Chinese. doi: http://dx.chinadoi.cn/10.3969/j.issn.1009-7201.2014.06.019 [Google Scholar]
- 45.Xu ZP, Tang LY, Deng LH, Song ZW. [Influences of fluoxetine plus rTMS on efficacy and cognitive function of depression patient]. Lin Chuang Xin Shen Ji Bing Za Zhi. 2014; 20(4): 82-84. Chinese. doi: http://dx.chinadoi.cn/10.3969/j.issn.1672-187X.2014.04.030-0082-04 [Google Scholar]
- 46.Xie M, Jiang W, Yang H. Efficacy and safety of the Chinese herbal medicine shuganjieyu with and without adjunctive repetitive transcranial magnetic stimulation (rTMS) for geriatric depression: a randomized controlled trial. Shanghai Arch Psychiatry. 2015; 27(2): 103-110. doi: http://dx.chinadoi.cn/10.11919/j.issn.1002-0829.214151 [DOI] [PMC free article] [PubMed] [Google Scholar]
- 47.Hu YL, Wu SY. [Influences of escitalopram plus repetitive transcranial magnetic stimulation on the therapeutic effect and cognitive function of first-episode depression patients]. Lin Chuang Xin Shen Ji Bing Za Zhi. 2015; 21(6): 78-80. Chinese. doi: http://dx.chinadoi.cn/10.3969/j.issn.1672-187X.2015.06.026-0078-03 [Google Scholar]
- 48.Shi YM, Xu XM, Sun HJ, Jin HQ, Hao CJ. [Clinical Study on rTMS and duloxetine in the Treatment of Treatment-Resistant Depression]. Xian Dai Yang Sheng. 2015; 9: 57-59. Chinese. doi: http://dx.chinadoi.cn/10.3969/jj.issn.1671-0223.2015.09.044 [Google Scholar]
- 49.Xiao CX, Zhong WW, Nuerbiya MMTM, Chen JY. [Clinical Effect of Repetitive Transcranial Magnetic Stimulation on Mild to Moderate Depressive Disorder]. Shi Yong Xin Nao Fei Xue Guan Bing Za Zhi. 2015; 10: 69-71. Chinese. doi: http://dx.chinadoi.cn/10.3969/j.issn.1008-5971.2015.10.018 [Google Scholar]
- 50.Liang WF, Xiao XM, Mo ZC, Jiang LD. [Effect of rTMS Assisted With Agomelatine on HAMD Score, Quality of Life and Adverse Reactions of Adult Patients With First-episode Depression]. Neimenggu Yi Xue Za Zhi. 2016; 48(8): 897-900. Chinese. doi: http://dx.chinadoi.cn/10.16096/Jxnki.nmgyxzz.2016.48.08.001 [Google Scholar]


