

Abstract
A number of studies have indicated that gay men tend to be shorter, on average, than heterosexual men. Less evidence exists that lesbian women are taller, on average, than heterosexual women. The most popular explanation of the association between sexual orientation and height involves prenatal factors, such that, for example, gay men may have been exposed to lower than typical androgens during fetal development, which impacts their height and sexual orientation as adults. An alternative explanation involves stress, given that stress has been associated with sexual minority identification and with lower height. Another alternative explanation involves nutrition, although its relationship is less clear with sexual minority identification. Using the Add Health data, which is a large, nationally representative and longitudinal sample of American adolescents (n = 14,786), we tested a mediation model, such that sexual orientation → pubertal stress/nutrition → height. Within men, we found that gay men (n = 126) were shorter, on average, than heterosexual men (n = 6412). None of the 24 pubertal stress-related and 15 pubertal nutrition-related variables assessed in the Add Health data mediated the relationship between sexual orientation and height in men. Within women, lesbians (n = 75) did not differ significantly in stature compared to heterosexual women (n = 6267). Thus, prenatal mechanisms (e.g., hormones, maternal immune response) are likely better candidates for explaining the height difference between gay men and heterosexual men.
Keywords: Sexual orientation, Height, Stress, Puberty, Physical development, Add Health
Introduction
Physical characteristics, and the development of them, have been a focus of study within the sexual orientation field. Specifically, this line of research has examined if gay men and lesbian women differ from heterosexual men and heterosexual women on sex-dimorphic physical characteristics. Any differences found between gay men and heterosexual men, and between lesbian women and heterosexual women, on these physical characteristics have been interpreted to suggest that the mechanism(s) responsible for the development of the implicated physical characteristics may be involved in the development of sexual orientation. A number of research programs investigating physical and physiological characteristics have undertaken this line of reasoning, including research conducted on 2D:4D finger ratios (the ratio of the length of the second digit to the length of the fourth digit; e.g., Brown, Finn, Cooke, & Breedlove, 2005; Lippa, 2003a; Manning, Churchill, & Peters, 2007; Manning & Fink, 2008), otoacoustic emissions (e.g., McFadden, 1993, 1998; McFadden & Champlin, 2000), facial structure (Skorska, Geniole, Vrysen, McCormick, & Bogaert, 2015; Valentova, Kleisner, Havlicek, & Neustupa, 2014) and height, which is the focal physical characteristic in the current study (for reviews, see Balthazart, 2011; Bao & Swaab, 2011; Gooren, 2006; Hines, 2011; LeVay, 2010; Ngun, Ghahramani, Sanchez, Bocklandt, & Vilain, 2011).
Several studies have examined an association between sexual orientation and height. Generally, the results of these studies have found that gay men and heterosexual women are shorter, on average, than heterosexual men and lesbian women, respectively (Blanchard & Bogaert, 1996a; Blanchard, Dickey, & Jones, 1995; Bogaert, 1998, 2010; Bogaert & Blanchard, 1996; Bogaert & Liu, 2013; cf. Bogaert & Friesen, 2002; Martin & Nguyen, 2004). The results have been less consistent for studies in women than for studies in men (e.g., Bogaert, 2010; Bogaert & Liu, 2013; Singh, Vidaurri, Zambarano, & Dabbs, 1999). Most recently, Skorska and Bogaert (2016) found an objective height difference between gay men and heterosexual men, such that gay men were shorter than heterosexual men, which is an important finding given that several of the early studies used self-reported height (cf. Blanchard et al., 1995; Martin & Nguyen, 2004). Skorska and Bogaert (2016) did not find an objective height difference between lesbian women and heterosexual women, although means were in the predicted direction (i.e., lesbian women slightly taller than heterosexual women). The effect sizes within men are small, such that gay men were approximately 1–2 cm shorter than heterosexual men, which translates into a Cohen’s d with a range of 0.03–0.27, depending on the study. In women, the effect is smaller or there is no group difference, depending on the study.
A prenatal hormone theory has been the most popular explanation for the height differences found between gay men and heterosexual men and between lesbian women and heterosexual women (when the effects have been found in women). This theory proposes that typical levels of hormones (e.g., testosterone) have been altered in prenatal sexual development (e.g., lowered in male fetuses; raised in female fetuses), and that this atypical exposure to prenatal hormones via action on the brain ultimately predisposes an individual to a same-sex orientation later on in life (Balthazart, 2011; Bao & Swaab, 2011; Becker et al., 2005; Ellis & Ames, 1987; Hines, 2011; Ngun et al., 2011; Skorska & Bogaert, 2016). Given that men are, on average, taller than women (Frayer & Wolpoff, 1985; Gray & Wolfe, 1980; Martin & Nguyen, 2004), and prenatal hormones partly underlie this difference (Chernausek, Backeljauw, Frane, Kuntze, & Underwood, 2007; Clarke & Khosla, 2009; Cutler, 1997; Garnett et al., 2004; Geary, Pringle, Rodeck, Kingdom, & Hindmarsh, 2003; Jansson, Ekberg, Isaksson, Mode, & Gustafsson, 1985; Lichanska & Waters, 2008; Martin & Nguyen, 2004; Walker, Van Wyk, & Underwood, 1992), when height is shifted in the female-like way in gay men (i.e., shorter) and in the male-like way in lesbian women (i.e., taller), this pattern of results suggests that variations in prenatal hormones may partly underlie the development of sexual orientation and its link to height. Variations in prenatal hormones, however, are only one plausible explanation.
An alternative plausible explanation of the height difference between, for example, gay and heterosexual men concerns interactions between the environment and biology. Gay men are more likely, on average, to experience more stress, including psychosocial stressors, than heterosexual men (e.g., Collier, van Beusekom, Bos, & Sandfort, 2013; Fournier et al., 2009; Hatzenbuehler, McLaughlin, & Xuan, 2012; Jabson, Farmer, & Bowen, 2014; Johns, Zimmerman, & Bauermeister, 2013; Lindley, Walsemann, & Carter, 2012; Rosario et al., 2014). For example, gay adolescents may experience some emotional stress because of questioning their sexuality, or heightened alienation from their families or peers due to their sexual minority status (Collier et al., 2013; Johns et al., 2013; Rosario et al., 2014). Greater stress related to social/emotional development has been associated with decreased height (Johnson & Gunnar, 2011; Martorell, 2010; Surkan et al., 2014). Thus, it is also possible that a difference in height between gay and heterosexual men may be explained by biological factors associated with environmental/psychosocial stressors that affect the development of height. If true, a height difference may say less about the development of sexual orientation per se, and more about how stress affects the development of stature.
A second alternative explanation of the height difference between gay and heterosexual men involves nutrition. The nutrition explanation is, arguably, less plausible than a stress effect because, although there is an association between height and nutrition (e.g., de Beer, 2012), the association between sexual orientation and nutritional intake or eating habits has been less extensively studied, and the studies conducted to date do not suggest an association between sexual orientation and nutrition/eating habits (Boehmer & Bowen, 2009; Boehmer, Miao, Linkletter, & Clark, 2012; Deputy & Boehmer, 2010; Neumark-Sztainer, Story, Resnick, & Blum, 1998). Nevertheless, given the association between height and nutrition, and given that the association between sexual orientation and nutrition has been less extensively studied, there is still some rationale to test it as an alternative explanation to the prenatal hormone explanation, although it is more exploratory.
Thus, it is important to test the various competing and plausible explanations of the association between sexual orientation and height, to begin to understand what is occurring. In the current study, the first goal was to test, in a national probability sample of adolescents and young adults, whether there was a difference in adult objective height between gay men and heterosexual men, and between lesbian women and heterosexual women. We predicted that gay men would be shorter, on average, than heterosexual men, and that lesbian women would be taller, on average, than heterosexual women. If there was a height difference, the next goal was to examine whether stress and/or nutrition during adolescence mediate the relationship between sexual orientation and height in accordance with Fig. 1.1 Our prediction was that there might be partial mediation of the sexual orientation and height relationship with stress-related variables, given that sexual orientation has been related to stress, and height has been related to stress. We predicted that nutrition would not mediate the relationship between sexual orientation and height, given the lack of support in the current literature for the association between sexual orientation and nutrition.
Fig. 1.
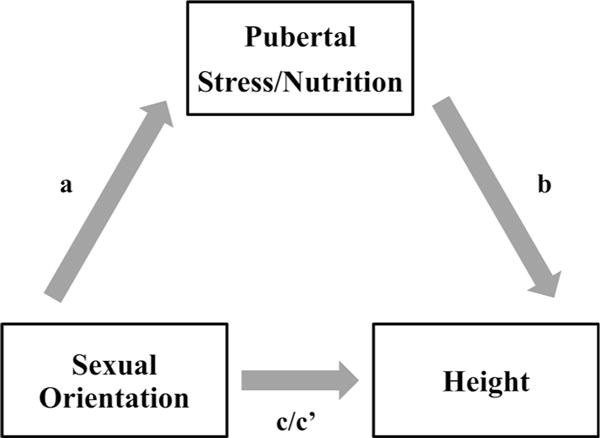
Path diagram for the mediation model tested in the paper
Waves I and IV of the National Longitudinal Study of Adolescent Health (Add Health) were used to test these predictions (Harris, 2009). The aim of the Add Health study was to gather data regarding the health of a cohort of American adolescents in grades seven to twelve (Harris et al., 2009). The sample is a nationally representative sample of adolescents and young adults that has been followed from 1994 until 2008, through four waves of data. Specifically, at Wave I, most participants were between 11 and 18 years of age. At Wave IV, the majority of participants were between 24 and 34 years of age. Thus, at Wave I, a portion of the sample was, on average, either in the early stages of puberty or beginning puberty. Puberty is an important developmental stage to consider because it coincides with hormonal surges known to influence physical development in boys and girls, including height. Thus, to investigate whether stress and/or nutrition explain the relationship between sexual orientation and height, the mediation model shown in Fig. 1 was tested, within each sex.2
Method
Participants
At Wave I, 20,745 adolescents were interviewed at home from a larger sample of 90,118 adolescents who were interviewed at various high schools and feeder schools of some of the high schools (see Procedure section for further details). At Wave IV, 15,701 of the original Wave I respondents were reinterviewed at home. We used a subsample of 14,800 participants who had a Wave IV cross-sectional sample weight (Chen & Chantala, 2014; Savin-Williams & Joyner, 2014a), and further reduced the sample to 14,786 to remove individuals who were marked with an inconsistent sex between Waves I and IV (n = 14). Of the 14,786 participants, 6924 were men and 7862 were women. The mean age of the sample at Wave I was 15.48 years (SE = 0.12, n = 14,778) and at Wave IV was 28.38 years (SE = 0.12, n = 14,786).
Race/ethnicity was self-reported by participants at Wave I, and participants could choose more than one of the following categories: “White” (n = 9433), “Black or African American” (n = 3311), “American Indian or Native American” (n = 500), “Asian or Pacific Islander” (n = 1019), or “Other” (n = 1295). At Wave IV, participants self-reported the highest level of education they had completed to date. Participants chose either “eighth grade or less” (n = 52), “some high school” (n = 1090), “high school graduate” (n = 2393), “some vocational/technical training (after high school)” (n = 523), “completed vocational/technical training (after high school)” (n = 936), “some college”(n = 5056), “completed college (bachelor’s degree)” (n = 2909), “some graduate school” (n = 556), “completed a master’s degree” (n = 738), “some graduate training beyond a master’s degree” (n = 140), “completed a doctoral degree” (n = 109), “some post baccalaureate professional education (e.g., law school, med school, nurse)” (n = 100), “completed post baccalaureate professional education (e.g., law school, med school, nurse)” (n = 180). Codebooks for the Add Health data are available online (“Questionnaire Codebooks for Waves I, II, III and IV,” n.d.).
Measures
Only the measures of interest to the current study are described below. Any responses in which the participant selected “refused,” “don’t know,” “not applicable,” or “legitimate skip” were coded as missing data.
Sex (Waves I and IV)
Biological sex was self-reported by the Add Health interviewers as either male or female. As noted previously, sex that was consistent across Waves I and IV was used. In some cases, only Wave I sex was available and this was taken to be the correct measure of sex.
Race/Ethnicity (Wave I)
The race/ethnicity variable was dichotomized as White (coded 0; n = 8877) compared to non-White (coded 1; n = 5884) ethnicities (as in Skorska & Bogaert, 2016). Participants could choose more than one category for their race/ethnicity. Those who selected only the White category were coded as 0, and those who selected any combination of other ethnicities were coded as 1.
Education (Wave IV)
The education variable was dichotomized to compare those who completed at least some university/college education (coded 1; n = 9788) to those who did not complete any university/college education (coded 0; n = 4994) (as in Skorska & Bogaert, 2016). Specifically, those who indicated they completed “eighth grade or less,” completed “some high school,” were a “high school graduate,” completed “some vocational/technical training (after high school),” or “completed vocational/technical training (after high school)” were coded 0 and all other participants who answered the education question were coded 1.
Sexual Orientation (Wave IV)
At Wave IV, participants were asked about their sexual orientation identity via the following statement, “Please choose the description that best fits how you think about yourself.” The response options were as follows: “100 % heterosexual (straight)” (n = 12,679), “mostly heterosexual (straight), but somewhat attracted to people of your own sex” (n = 1429), “bisexual that is, attracted to men and women equally” (n = 229), “mostly homosexual (gay), but somewhat attracted to people of the opposite sex” (n = 123), “100% homosexual (gay)” (n = 201), and “not sexually attracted to either males or females” (n = 62). Responses to the “not sexually attracted to either males or females” option were coded as missing data for the current study.
Sexual orientation identity at Wave IV was used as the sexual orientation measure in the current study given the potential problems identified by Savin-Williams and Joyner (2014a) with using measures of romantic attraction completed by participants at Wavel. Specifically, there seems to be a proportion of boys who indicated that they were same-sex romantically attracted or both-sex romantically attracted at Waves I and II, but at Waves III or IV many of them reported they were other-sex romantically attracted. Savin-Williams and Joyner (2014a) indicate that this was likely due to a misunderstanding of the romantic attraction question or that these boys were jokesters who dishonestly reported their sexual orientation. Although other interpretations exist (Katz-Wise, Calzo, Li, & Pollitt, 2015; Li, Katz-Wise, & Calzo, 2014; cf. Savin-Williams & Joyner, 2014a, b), given that it is difficult to determine the exact reasons for the change to an other-sex orientation and that a change in that direction seems to be unlikely, Savin-Williams and Joyner (2014a) advise to use Wave III and/or IV sexual orientation identity data only as the measure of sexual orientation. Thus, we are following their recommendation and using Wave IV sexual orientation identity as the measure of sexual orientation.
Based on Skorska and Bogaert (2016), the main groups of interest were the exclusively heterosexual individuals (coded 0; nmen = 6412; nwomen = 6267) compared to the exclusively gay/lesbian individuals (coded 1; nmen = 126; nwomen = 75). Also, as in Skorska and Bogaert (2016), results from three other groupings were of interest: predominant heterosexual (coded 0; nmen = 6640; nwomen = 7468) versus other (coded 1; nmen = 228; nwomen = 325) sexual orientation; predominant gay/lesbian (coded 0; nmen = 182; nwomen = 142) versus bisexual (coded 1; nmen = 46; nwomen = 183); and predominant heterosexual (coded 0) versus bisexual (coded 1). Predominant heterosexuals were those who selected either “100% heterosexual (straight)” or “mostly heterosexual (straight)”; predominant gay/lesbian were those who selected either “100% homosexual (gay)” or “mostly homosexual (gay)”; others were those who selected “bisexual,” “mostly homosexual (gay),” or “100% homosexual (gay)”; and bisexuals were those who selected “bisexual.”
Height (Wave IV)
Wave IV height (cm) was used (M = 170.72, SE = 0.20, n = 14,660). Height was objectively measured at Wave IV by a trained interviewer, to the nearest 0.5 cm, of those participants who were capable of standing on their own. For details about how height was measured, see Entzel et al. (2009).
Nutrition (Wave I)
At Wave I, participants answered several questions related to nutrition, which provided a total of 15 variables. See Appendix 1 for questions and response options for all nutrition variables. See Table 1 for frequencies for each nutrition variable. Participants were asked about what they usually had for breakfast across ten items (e.g., milk, cereal, eggs). For each of the 10 items, a variable was created if they ate the item (coded 1) or did not eat the item (coded 0). Also, participants were asked about the food they ate yesterday across five items (e.g., vegetables, dairy products). For each of the five questions, a dichotomous variable was created to represent whether they ate the item at least once (coded 1) or did not eat the item (coded 0).
Table 1.
Frequencies for nutrition variables in the entire sample
| Variable | n no | n yes | n total |
|---|---|---|---|
| Breakfast: milk | 6480 | 8297 | 14777 |
| Breakfast: coffee, tea | 13874 | 903 | 14777 |
| Breakfast: cereal | 7388 | 7389 | 14777 |
| Breakfast: fruit, juice | 9815 | 4962 | 14777 |
| Breakfast: eggs | 12324 | 2453 | 14777 |
| Breakfast: meat | 13135 | 1642 | 14777 |
| Breakfast: snack food | 13710 | 1067 | 14777 |
| Breakfast: breads | 9480 | 5297 | 14777 |
| Breakfast: other | 12978 | 1799 | 14777 |
| Breakfast: nothing | 11730 | 3047 | 14777 |
| Ate yesterday: dairy | 2527 | 12247 | 14774 |
| Ate yesterday: fruit, juice | 3109 | 11666 | 14775 |
| Ate yesterday: vegetables | 4839 | 9931 | 14770 |
| Ate yesterday: bread, pasta | 1216 | 13559 | 14775 |
| Ate yesterday: pastries | 6722 | 8054 | 14776 |
Stress-Related Variables: Theoretically Relevant Variables (Wave I)
Stress can be defined as “the non-specific mental or somatic result of any demand upon the body” (Selye, 1982, as cited in Poole, Matheson, & Cox, 2008, p. 55); however, stress is difficult to define because it is a multidimensional construct, and because stress is experienced subjectively. Nevertheless, stress is operationalized in many ways in the research literature. Many of the operationalizations focus on the outcomes of stress (i.e., the “mental or somatic result” in the definition), the person’s perceptions of how stressed they feel, or measurements of cortisol, a key hormone involved in the stress response.
In the current study, we wanted to capture stress as broadly as possible because of potential concerns that we may have missed an important stress-related mediator of the relationship between sexual orientation and height. We used operationalizations of stress based on what has been previously used in studies using Wave I of the Add Health data, in studies conducted both on sexual minority youth and in studies not related to sexual orientation. We also attempted to identify stress-related variables that would be relevant to the association between childhood environment and height in children. These variables should be related to an environment that is deficient in psychosocial development and maternal support (Gohlke, Frazer, & Stanhope, 2004; Johnson & Gunnar, 2011; Surkan et al., 2014). Given these ways of measuring stress, 24 variables in 19 categories of variables were identified and computed to represent stress or the outcomes of stress in Wave I of the Add Health data. We have grouped the stress variables based on whether they are theoretically relevant (i.e., social emotional stress-related variables) versus more exploratory stress-related variables. The variables that are of theoretical interest (17 variables, 13 categories) are outlined next. In the following section, the exploratory stress-related variables (seven variables, six categories) are outlined. See Table 2 for descriptive statistics for all continuous stress-related variables. See Appendix 1 for the specific questions and response options for each stress-related variable. Across all variables, all necessary items were reverse coded, and, when an average was computed, it was computed for those who answered approximately 80% of the relevant items. Cronbach’s α values were not computed using Complex Samples (see “Statistical Analyses” section) because this analysis is not available with the Complex Samples function in SPSS. Instead, they were computed on the unweighted data and thus should not be generalized beyond the unweighted sample.
Table 2.
Descriptive statistics for each of the continuous stress-related variables in the entire sample
| Variable | M | SE | 95 % CI | Rangea | n |
|---|---|---|---|---|---|
| Exploratory stress-related variables | |||||
| Self-rated health | 2.13 | 0.01 | 2.10–2.16 | 1–5 | 14776 |
| Health stress | 0.79 | 0.01 | 0.78–0.81 | 0–4 | 14776 |
| Parental control | 0.27 | 0.01 | 0.25–0.28 | 0–1 | 14507 |
| Theoretically relevant stress-related variables | |||||
| Depressive symptoms | 0.58 | 0.01 | 0.56–0.59 | 0–3 | 14756 |
| SN: In degree | 4.58 | 0.12 | 4.35–4.82 | 0–32 | 10667 |
| SN: Reach | 60.52 | 2.69 | 55.19–65.86 | 0–270 | 10667 |
| SN: Out degree | 4.60 | 0.10 | 4.41–4.80 | 0–10 | 10667 |
| SN: Bonacich centrality | 0.82 | 0.01 | 0.80–0.84 | 0–4.29 | 10667 |
| Perceived social support | 1.97 | 0.01 | 1.94–1.99 | 1–5 | 14697 |
| School belonging | 2.44 | 0.02 | 2.40–2.48 | 1–5 | 14503 |
| School stress | 1.06 | 0.01 | 1.04–1.09 | 0–4 | 14511 |
| Self-esteem | 1.89 | 0.01 | 1.86–1.91 | 1–5 | 14749 |
| Parent rejection | 1.91 | 0.01 | 1.90–1.93 | 1–5 | 12816 |
| Want to run away | 2.16 | 0.03 | 2.10–2.23 | 1–5 | 14564 |
| Child–mother connectedness | 1.66 | 0.01 | 1.64–1.68 | 1–5 | 13946 |
| Child–father connectedness | 1.76 | 0.02 | 1.73–1.79 | 1–5 | 10495 |
M mean, SE standard error, 95 % CI 95 % confidence interval of the mean, SN social network
Ranges are theoretical ranges, with the exception of the social network variables. The ranges for the social network variables are response specific ranges based on friendship nominations
Depressive Symptoms
A 19-item scale (e.g., “You were bothered by things that usually don’t bother you”) similar to the Center for Epidemiologic Studies Depression Scale was used (e.g., Adkins, Daw, McClay, & Oord, 2012; Galliher, Rostosky, & Hughes, 2004; Georgiades, Boyle, & Fife, 2013; Hatzenbuehler et al., 2012; Heard, Gorman, & Kapinus, 2008; Jager & Davis-Kean, 2011; Nooney, 2005; Schreck, Burek, Stewart, & Miller, 2007; Wight, Botticello, & Aneshensel, 2006). An average was computed such that higher scores represent greater reporting of depressive symptoms (Cronbach’s α = 0.86).
Social Network Variables
Hatzenbuehler et al. (2012) utilized four variables, which tap into social network composition, that were constructed by Add Health statisticians and are available within the Add Health data. Participants were asked to name their five best male and five best female friends from both inside and outside their school. The in-degree variable represents the number of students in the school who nominated a participant as their friend. The out-degree variable represents the number of students in the school that were nominated by a participant as their friend. The reach variable is a measure of the degree of connectedness within the social network of the participant, and represents the total number of students the participant can reach in three steps within the participant’s friendship network. Bonacich’s centrality (β parameter) is a measure of social status and represents a participant’s centrality in their peer network. For all four measures of social networks, higher scores indicate a greater social network (e.g., greater social status). See the “Network Variables” codebook available online for more details about the computation of these variables (“Questionnaire Codebooks for Waves I, II, III and IV,” n.d.).
Violent Victimization
Based on Schreck et al. (2007) and Hatzenbuehler et al. (2012), four items were used to create a dichotomous measure of whether the participant was violently victimized (coded 1; n = 2923) or not (coded 0; n = 11,781). If participants answered that they had been in at least one of these four experiences (e.g., they were jumped), they were coded as 1; otherwise, they were coded 0.
School Belonging
The degree with which the participant felt they belonged at school was assessed using six items (e.g., Galliher et al., 2004; Georgiades et al., 2013; Wickrama, Noh, & Elder, 2009). An average was computed such that higher scores represent less school belonging (Cronbach’s α = 0.72).
School Stress
The frequency with which participants engaged in behaviors related to being stressed at school was assessed using four items (e.g., Heard et al., 2008; Nooney, 2005). An average was computed such that higher scores represent more school stress (Cronbach’s α = 0.69).
Perceived Social Support
Seven items were used to assess the degree to which participants felt they received support from those around them (e.g., Adkins et al., 2012; Heard et al., 2008; Nooney, 2005; Wight et al., 2006). An average was computed such that higher scores represent less perceived social support (Cronbach’s α = 0.78).
Running Away From Home
Two variables were used as measures of running away from home. The first variable is the participant’s response to one item about the degree to which a participant felt that they wanted to leave home. Higher numbers represent a greater want to leave home (Table 2). The second variable is a dichotomous variable that indicates whether the participant had ever ran away from home in the past 12 months (e.g., “1 or 2 times”; n = 1209; coded 1) or “never” ran away from home in the past 12 months (n = 13,485; coded 0).
Self-Esteem
Six items were used to assess self-esteem (e.g., “You like yourself just the way you are”; Galliher et al., 2004; Heard et al., 2008; Nooney, 2005). An average was computed such that higher scores represent less self-esteem (Cronbach’s α = 0.85).
Child-Mother Connectedness
Seven items were used to represent the degree to which participants felt connected to their mother (e.g., Heard et al., 2008; Wickrama et al., 2009; Williams & Chapman, 2012). An average was computed such that higher scores represent less connectedness to their mother (Cronbach’s α = 0.86).
Child-Father Connectedness
Five items were used to represent the degree to which participants felt connected to their father (e.g., Williams & Chapman, 2012). An average was computed such that higher scores represent less connectedness to their father (Cronbach’s α = 0.89).
Suicidal Thoughts
Participants were asked a question about whether they thought about committing suicide (e.g., Nooney, 2005). The response options were either a yes (coded 1; n = 1998) or a no (coded 0; n = 12,660).
Physical Abuse
At Wave IV, participants answered a retrospective question about whether they had been physically abused (e.g., Slopen, McLaughlin, Dunn, & Koenen, 2013). A dichotomous measure of physical abuse was computed representing ever been physically abused (coded 1; n = 2712) and never been physically abused (coded 0; n = 11,901).
Parental Rejection
At Wave I, a parent of the participant (most of the time it was the mother) answered five questions (among others) about their relationship with the participant (e.g., “You just do not understand him/her”; Wickrama, O’Neal, & Oshri, 2014). An average was computed such that higher scores represent more rejection from the parent (Cronbach’s α = 0.64).
Stress-Related Variables: Exploratory Variables (Wave I)
Self-Rated Health
This variable is the participant’s response to one item about how good they perceived their health to be (Heard et al., 2008). Higher numbers represent poorer health.
Health Stress
Participants answered 20 (boys) or 21 (girls) items about the frequency with which they experienced certain symptoms or conditions (e.g., “a headache,” “chest pains”) in the past 12 months (e.g., Nooney, 2005). A “cramps during your menstrual period” item was the extra item asked for girls. An average was computed such that higher scores represent more health stress (Cronbach’s α = 0.84 for 20 items; Cronbach’s α = 0.85 for 21 items).
Parental Control
Participants answered seven items related to whether or not parents controlled the participant (e.g., Heard et al., 2008). An average was computed such that higher scores represent more parental control (Cronbach’s α = 0.63).
Parent Disability
Participants answered two questions about the physical disability (i.e., mental or physical handicap) of their parents who currently live with them (i.e., could be biological, adoptive parents) (e.g., Williams & Chapman, 2012). Responses were “yes” (coded 1; nmother = 642; nfather = 654) or “no” (coded 0; nmother = 13,305; nfather = 9846).
Physical Disability of the Participant
Participants who answered “no” to all four questions regarding physical disability were coded as not having a physical disability (coded 0; n = 14,080). Participants who answered that they had at least one of the conditions were coded as having a physical disability (coded 1; n = 691).
Sexual Abuse
At Wave IV, participants answered a retrospective question about whether they had been sexually abused (e.g., Slopen et al., 2013). A dichotomous measure of sexual abuse was computed representing ever been sexually abused (coded 1; n = 751) and never been sexually abused (coded 0; n = 13,886).
Procedure
The Add Health study used a school-based sampling design (see Harris, 2013 for more details). Briefly, 80 high schools were selected to take part in the study, stratified by region, urban or rural location, school type (e.g., public), ethnic diversity, and size of the school. For each high school, a feeder school (e.g., a middle school) was identified and recruited. The final sample included 132 schools, with each school associated with one of 80 communities. In 1994 and 1995 (Wave I), 90,118 students at these schools completed a short 45-to 60-min in-school questionnaire. A subsample of students from these schools was chosen to complete a more in-depth 1.5-h in-home interview. In the core sample of 12,105 of the in-home students, students in each school were stratified by grade and sex, and 17 were randomly chosen from each stratum for the in-home interviews for a total of about 200 students from each pair of schools. Thus, the Wave I in-home sample is a representative sample of US adolescents in grades seven to 12. The total sample size with special supplemental subsamples of students (e.g., students with certain ethnicities) is 20,745 adolescents. School administrators and 17,670 parents of the students (mostly mothers) were also interviewed. Follow-up interviews at Waves II, III, and IV were based on the Wave I in-home sample of adolescents.
At the in-home interviews at Wave I, responses were recorded on laptops (Harris, 2013). For less sensitive topics, the interviewer read the question out loud and entered the participant’s answers, known as the computer-assisted personal interview (or CAPI). For more sensitive topics, the participant listened through earphones to prerecorded questions and entered responses directly by themself, known as audio-CASI (audiocomputer-assisted self-interview).
At Wave IV, 15,701 of the original Wave I in-home participants were reinterviewed (Harris, 2013). A 90-min in-home interview was conducted using CAPI and CASI. Then, interviewers took physical measurements (e.g., height), collected biological specimens (e.g., blood), and took a medications log. In terms of the response rate, Harris (2013) notes that non-response bias is trivial. It is advised to use final sampling weights to compute population estimates, in order for the sample at Wave IV to represent the population recruited at Wave I.
Statistical Analyses
All analyses were conducted using SPSS (version 22) Complex Samples. Complex Samples allows for the sampling strategy to be taken into account. The appropriate Wave IV cross-sectional weight, stratum variable, and cluster variable were utilized to provide correct estimates of totals, ratios, regression parameters, means, variances, standard errors, and confidence intervals (Chen & Chantala, 2014). A “with replacement” design type was specified and subpopulation variables were created and utilized for analyses in which only a subset of the sample was to be analyzed (Chen & Chantala, 2014). A common subpopulation variable that was used was sex, because all height-related analyses were conducted within each sex. All analyses were run with the General Linear Model (GLM) analysis in Complex Samples. The GLM analysis provides results for a simultaneous linear regression analysis, and includes the Bs, standard errors, and t test associated with each variable that is included in each analysis. In all analyses, education and race/ethnicity were entered simultaneously in order to statistically control for these variables because of their relationship to height, and to be consistent with Skorska and Bogaert (2016). For example, Black men and women tend to be shorter than White men and women (Komlos, 2010), and Skorska and Bogaert found that White participants were taller than non-White participants. Further support for the inclusion of education and race/ethnicity is also demonstrated in Table 3, which indicates a significant association of education with sexual orientation and height, and a significant association of race/ethnicity with height within men (similar results were obtained in women but are not shown). Age at Wave IV was unrelated to sexual orientation and to height (see bottom of Table 3), and thus it was not entered in any analyses.
Table 3.
Summary of the results of separate simultaneous linear regression analyses for the a-path (sexual orientation → stress/nutrition) and b-path (stress/nutrition → height) of the mediation model within men, as well as descriptive statistics by sexual orientation group
| Variable | A-path: sexual orientation ➔ stress/nutrition | B-path: stress/nutrition ➔ height | ||||||||||
|---|---|---|---|---|---|---|---|---|---|---|---|---|
|
| ||||||||||||
| Regression Results | Descriptive Statistics by Sexual Orientation Group | |||||||||||
|
|
||||||||||||
| Heterosexual Men | Gay Men | |||||||||||
|
|
||||||||||||
| B | SE | t | M (SE) or n noa | SD or n yesb | 95% CI or Weighted % yesc | M (SE) or n noa | SD or n yesb | 95% CI or Weighted % yesc | B | SE | t | |
| Exploratory Stress-Related Variables | ||||||||||||
|
| ||||||||||||
| Self-rated healthd | 0.08 | 0.10 | 0.80 | 2.04 (0.02) | 0.89 | 2.01–2.08 | 2.05 (0.10) | 0.90 | 1.86–2.24 | −0.05 | 0.16 | −0.33 |
| Health stressd | 0.09 | 0.04 | 1.95* | 0.70 (0.01) | 0.36 | 0.69–0.72 | 0.79 (0.04) | 0.37 | 0.70–0.87 | 0.08 | 0.36 | 0.23 |
| Parental controld | −0.01 | 0.03 | −0.52 | 0.27 (0.01) | 0.23 | 0.25–0.28 | 0.25 (0.03) | 0.24 | 0.19–0.30 | −1.32 | 0.80 | −1.66 |
| Disabled motherf | 0.01 | 0.02 | 0.50 | 5788 | 240 | 4.3 | 110 | 8 | 5.0 | −0.18 | 0.60 | −0.30 |
| Disabled fatherf | 0.06 | 0.05 | 1.05 | 4449 | 280 | 6.5 | 81 | 5 | 10.7 | 0.62 | 0.62 | 1.01 |
| Physical disability of participantf | −0.03 | 0.01 | 2.89** | 6100 | 306 | 4.1 | 124 | 2 | 1.0 | 1.48 | 0.66 | 2.23** |
| Sexual abusef | 0.03 | 0.03 | 0.85 | 6216 | 134 | 2.3 | 116 | 7 | 4.7 | 0.54 | 0.97 | 0.55 |
|
| ||||||||||||
| Theoretically Relevant Stress-Related Variables | ||||||||||||
|
| ||||||||||||
| Depressive symptomsd | 0.07 | 0.05 | 1.48 | 0.52 (0.01) | 0.34 | 0.51–0.54 | 0.57 (0.05) | 0.37 | 0.47–0.66 | −0.30 | 0.36 | −0.83 |
| SN: In degreee | 1.13 | 0.78 | 1.45 | 4.35 (0.12) | 3.71 | 4.11–4.60 | 5.62 (0.84) | 4.76 | 3.97–7.28 | −0.04 | 0.05 | −0.84 |
| SN: Reache | 18.10 | 6.87 | 2.63** | 57.09 (2.85) | 49.41 | 51.45–62.74 | 77.36 (7.88) | 44.53 | 61.75–92.97 | 0.00 | 0.004 | 0.72 |
| SN: Out degreee | 0.58 | 0.27 | 2.18** | 4.33 (0.12) | 3.17 | 4.10–4.57 | 5.07 (0.30) | 2.81 | 4.47–5.66 | 0.02 | 0.05 | 0.34 |
| SN: Bonacich centralitye | 0.17 | 0.06 | 2.77** | 0.78 (0.02) | 0.66 | 0.75–0.82 | 1.00 (0.07) | 0.68 | 0.87–1.13 | −0.03 | 0.28 | −0.09 |
| Perceived social supportd | −0.03 | 0.07 | −0.41 | 1.98 (0.02) | 0.58 | 1.95–2.01 | 1.93 (0.07) | 0.53 | 1.79–2.07 | 0.48 | 0.22 | 2.20** |
| Violent victimizationf | −0.22 | 0.02 | −9.27** | 4493 | 1879 | 28.6 | 112 | 14 | 5.0 | 0.14 | 0.28 | 0.49 |
| School belongingd | 0.09 | 0.08 | 1.09 | 2.41 (0.02) | 0.68 | 2.37–2.45 | 2.47 (0.08) | 0.71 | 2.30–2.64 | 0.29 | 0.19 | 1.57 |
| School stressd | −0.00 | 0.09 | −0.01 | 1.15 (0.02) | 0.74 | 1.12–1.18 | 1.10 (0.09) | 0.72 | 0.93–1.27 | 0.37 | 0.18 | 2.11** |
| Self-esteemd | 0.10 | 0.08 | 1.23 | 1.79 (0.01) | 0.55 | 1.76–1.81 | 1.86 (0.08) | 0.60 | 1.70–2.02 | −0.07 | 0.22 | −0.31 |
| Parental rejectiond | −0.02 | 0.10 | −0.22 | 1.91 (0.01) | 0.55 | 1.88–1.93 | 1.85 (0.10) | 0.65 | 1.66–2.05 | 0.68 | 0.27 | 2.54** |
| Suicidal thoughtsf | 0.09 | 0.04 | 1.93* | 5728 | 619 | 10.1 | 97 | 28 | 18.1 | −0.13 | 0.45 | −0.29 |
| Want to run awayd | 0.03 | 0.15 | 0.23 | 2.11 (0.04) | 1.21 | 2.05–2.18 | 2.17 (0.14) | 1.33 | 1.89–2.44 | 0.20 | 0.11 | 1.84* |
| Ever ran awayf | 0.00 | 0.03 | 0.03 | 5936 | 428 | 7.2 | 116 | 10 | 6.3 | 1.06 | 0.54 | 1.96* |
| Child-mother connectednessd | −0.03 | 0.08 | −0.42 | 1.61 (0.01) | 0.55 | 1.58–1.63 | 1.56 (0.08) | 0.65 | 1.41–1.72 | −0.04 | 0.27 | −0.16 |
| Child-father connectednessd | 0.21 | 0.14 | 1.48 | 1.68 (0.02) | 0.69 | 1.64–1.72 | 1.87 (0.14) | 0.82 | 1.60–2.15 | 0.21 | 0.18 | 1.15 |
| Physical abusef | 0.02 | 0.05 | 0.34 | 5144 | 1182 | 17.4 | 99 | 26 | 18.9 | 0.43 | 0.28 | 1.54 |
|
| ||||||||||||
| Nutrition Variables | ||||||||||||
|
| ||||||||||||
| Br.: Milkf | −0.08 | 0.06 | −1.42 | 2347 | 4062 | 64.3 | 51 | 74 | 57.1 | −0.07 | 0.28 | −0.25 |
| Br.: Coffee, teaf | 0.01 | 0.03 | 0.34 | 5997 | 412 | 6.6 | 118 | 7 | 7.1 | −0.45 | 0.57 | −0.79 |
| Br.: Cerealf | −0.06 | 0.06 | −0.94 | 2822 | 3587 | 57.1 | 63 | 62 | 52.9 | 0.03 | 0.30 | 0.10 |
| Br.: Fruit, juicef | 0.06 | 0.06 | 1.04 | 4222 | 2187 | 34.0 | 82 | 43 | 42.7 | −0.34 | 0.26 | −1.30 |
| Br.: Eggsf | −0.09 | 0.04 | −2.56** | 5044 | 1365 | 21.0 | 106 | 19 | 11.0 | −0.22 | 0.33 | −0.67 |
| Br.: Meatf | −0.02 | 0.05 | −0.41 | 5541 | 868 | 13.5 | 113 | 12 | 11.5 | 0.89 | 0.38 | 2.38** |
| Br.: Snack foodf | 0.00 | 0.03 | 0.02 | 5940 | 469 | 7.0 | 120 | 5 | 6.9 | 0.47 | 0.43 | 1.09 |
| Br.: Breadsf | −0.06 | 0.06 | −1.11 | 4008 | 2401 | 36.5 | 85 | 40 | 31.7 | −0.04 | 0.25 | −0.18 |
| Br.: Otherf | 0.04 | 0.05 | 0.94 | 5603 | 806 | 12.6 | 108 | 17 | 17.0 | −0.26 | 0.45 | −0.58 |
| Br.: Nothingf | 0.00 | 0.06 | 0.01 | 5342 | 1067 | 16.2 | 102 | 23 | 15.8 | 0.11 | 0.31 | 0.34 |
| AY: Dairyf | −0.30 | 0.04 | −0.69 | 853 | 5554 | 87.8 | 16 | 110 | 85.8 | 0.19 | 0.46 | 0.42 |
| AY: Fruit, juicef | −0.02 | 0.05 | −0.31 | 1322 | 5086 | 77.6 | 28 | 98 | 78.9 | 0.51 | 0.29 | 1.78* |
| AY: Vegetablesf | −0.07 | 0.07 | −0.95 | 2028 | 4379 | 68.8 | 35 | 90 | 64.5 | 0.30 | 0.31 | 0.95 |
| AY: Bread, pastaf | −0.05 | 0.05 | −1.01 | 458 | 5949 | 93.4 | 6 | 120 | 89.2 | 0.56 | 0.45 | 1.26 |
| AY: Pastriesf | −0.07 | 0.08 | −0.89 | 2697 | 3711 | 58.3 | 54 | 72 | 52.2 | 0.33 | 0.29 | 1.16 |
|
| ||||||||||||
| Control Variables | ||||||||||||
|
| ||||||||||||
| Race/Ethnicity | 0.06 | 0.06 | 1.05 | 3897 | 2507 | 29.7 | 73 | 52 | 35.8 | −2.29 | 0.38 | −6.09** |
| Education | 0.23 | 0.05 | 4.48** | 3897 | 2514 | 42.2 | 101 | 25 | 18.8 | 1.45 | 0.32 | 4.57** |
| Age | 0.14 | 0.22 | 0.66 | 28.47 (0.12) | 1.77 | 28.23–28.72 | 28.62 (0.23) | 1.61 | 28.16–29.08 | −0.03 | 0.09 | −0.40 |
Shaded columns include a-path-related analyses and descriptive statistics. Right-most non-shaded columns include b-path-related analyses. Analyses with the stress-related and nutrition variables statistically controlled for education and race/ethnicity. Lines in bold represent results where both the a-path and b-path are significant or marginally significant
SN social network, Br. breakfast, AY ate yesterday
p<0.05,
p<0.08, otherwise p>0.09 (i.e., not significant)
This column shows means and standard errors for continuous variables or the number of participants who responded “no” to a dichotomous variable. For race/ethnicity, it is the number of participants who were categorized as having a White race/ethnicity; for education, it is the number who were categorized as having a university education
This column shows the sample standard deviation for continuous variables or the number of participants who responded “yes” to a dichotomous variable. For race/ethnicity, it is the number of participants who were categorized as having a non-White race/ethnicity; for education, it is the number of participants who were categorized as having a non-university education. The sample standard deviation was calculated for the sample of n=14,786 participants who have a Wave IV sample weight, but without taking into account the sampling design of the data. Thus, the sample standard deviation cannot be generalized to the population
This column shows the 95% confidence interval (CI) around the mean for continuous variables or the % of yes respondents after calculation of the population estimates for the no and yes responses for dichotomous variables. Thus, the weighted % yes will not always reflect the unweighted counts in n no and n yes
Higher scores indicate more stress. For example, higher scores on the child–mother and child–father connectedness variables indicate less connectedness
Higher scores indicate less stress. For example, higher scores indicate more friendship nominations
Coded as either a 0 (“no”) or 1 (“yes”)
In the mediation model shown in Fig. 1, there are three paths in the model that need to be tested in order to determine whether mediation occurs (Baron & Kenny, 1986). First, it must be established that a c-path exists between the two main variables of interest, sexual orientation and height (i.e., dependent variable [DV] = height, independent variable [IV] = sexual orientation). Then, the a-path from sexual orientation to stress/nutrition must be demonstrated to exist (i.e., DV = stress/nutrition, IV = sexual orientation). Next, the b-path from stress/nutrition to height must be demonstrated to exist (i.e., DV = height, IV = stress/nutrition). Finally, any stress/nutrition variables in which both an a-path and a b-path exist can be tested to determine whether their inclusion in the model with both sexual orientation and height eliminates or reduces the association between sexual orientation and height. To do this, the potential stress/nutrition mediator variable is included in the model simultaneously with sexual orientation (DV = height). If the association between sexual orientation and height is eliminated, there is some evidence of mediation. If the association between sexual orientation and height is reduced, there may be some evidence of partial mediation. The Sobel test can be used to indicate whether mediation exists or not (i.e., whether the reduction in the c-path is significant after inclusion of the mediator in the model). This was the general analysis strategy utilized in the current paper.
Each stress and nutrition variable was tested in a separate simultaneous linear regression analysis in order to establish whether the a-path and the b-path existed. Separate analyses were conducted in order to reduce likely multicollinearity issues with the stress and nutrition variables. We did not have specific predictions for which stress and nutrition variables would be involved, and thus, the results should be interpreted with caution given the number of tests conducted. Then, any stress/nutrition variables that showed a significant or marginally significant difference between gay/lesbian and heterosexual individuals (i.e., a-path) and showed a significant or marginally significant association with height (i.e., b-path) were tested for mediation.
In addition to the mediation analyses, we were interested in examining the association between sexual orientation and height, statistically controlling for any stress/nutrition variables that were associated with height (i.e., significant or marginally significant b-path only). We conducted a linear regression analysis with sexual orientation and the relevant stress/nutrition variables as IVs and height as DV to determine whether the sexual orientation and height association holds over and above the association of the stress/nutrition variables and height.
Results
C-Path Analyses
Within the subpopulation of women, sexual orientation, race/ethnicity, and education accounted for 2.5% of the variance in height. Race/ethnicity and education were significant predictors, such that White women and women with some university/college education were taller than non-White women and women with no university/college education. Sexual orientation was not a significant predictor, B = 1.65, SE = 1.08, 95% confidence interval (CI) = −0.49 to +3.78, t(128) = 1.52, p = 0.131. Thus, exclusively lesbian women (M = 165.32, SE = 1.07) were slightly taller than exclusively heterosexual women (M = 163.67, SE = 0.15), but the difference was not statistically significant (Fig. 2). Results were similar when examining predominantly heterosexual women compared to bisexual/predominantly lesbian women, B = 0.86, SE = 0.55, 95% CI =−0.23 to +1.94, t(128) = 1.57, p = 0.120. Although none of the height differences were statistically significant, bisexual women (M = 164.30, SE = 0.75) seemed to be more similar in average height to predominantly lesbian women (M = 164.57, SE = 0.71; B = −0.27, SE = 1.06, 95% CI =−2.38 to 1.84, t(119) = −0.25, p = 0.800) than to predominantly heterosexual women (M = 163.73, SE = 0.14; B = 0.78, SE = 0.76, 95% CI =−0.73 to +2.28, t(128) = 1.02, p = 0.311). Thus, some very small differences were found within women, but overall, there were no statistically significant differences in height between women with a same-sex orientation identity and women with an other-sex orientation identity.
Fig. 2.
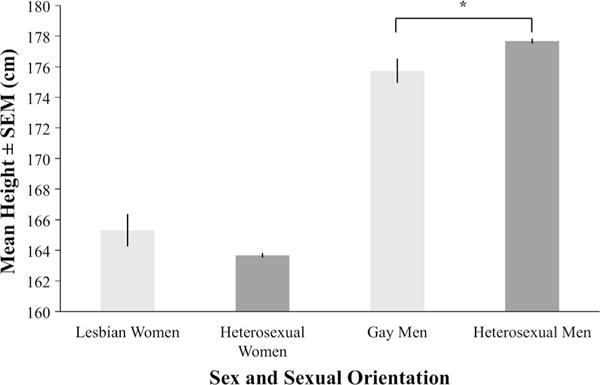
Approximate average height (cm), by sex and exclusive sexual orientation identity, statistically controlling for education and race/ethnicity. Asterisks indicates the difference was significant at p < 0.05
Within the subpopulation of men, sexual orientation, race/ethnicity, and education accounted for 2.5% of the variance in height. Race/ethnicity and education were significant predictors, such that White men and men with some university/college education were taller than non-White men, and men with no university/college education. Most importantly, sexual orientation was a significant predictor, B = −1.94, SE = 0.79, 95% CI =−3.51 to −0.37, t(128) = −2.44, p = 0.016. Thus, exclusively gay men (M = 175.73, SE = 0.80) were significantly shorter than exclusively heterosexual men (M = 177.67, SE = 0.17) (Fig. 2). Results were similar when examining predominantly heterosexual men compared to bisexual/predominantly gay men, B = −1.39, SE = 0.63, 95% CI =−2.64 to −0.14, t(128) = −2.20, p = 0.030. Bisexual men (M = 176.39, SE = 0.96) seemed to be more similar in average height to predominantly gay men (M = 176.45, SE = 0.77; B = −0.06, SE = 1.26, 95% CI =−2.56 to +2.43, t(119) = −0.05, p = 0.961) than to predominantly heterosexual men (M = 177.66, SE = 0.18; B = −1.39, SE = 0.85, 95% CI = −3.06 to +0.28, t(128) = −1.64, p = 0.103), although none of these height differences were statistically significant. Thus, men with a large degree of same-sex orientation identity were shorter, on average, than men with a predominantly other-sex orientation identity.
A-Path Analyses
A-path and b-path analyses were only conducted in men since a statistically significant association between sexual orientation and height (i.e., c-path) was found only within men. The results of both a-path and b-path analyses are summarized in Table 3, with a-path results in the shaded columns. An exclusively gay sexual orientation was associated with greater health stress, not having a physical disability, more nominations by friends within the participant’s school, more total number of students they could reach in three steps within their peer network, a greater centrality in their peer network, no violent victimization, presence of suicidal thoughts, and not eating eggs for breakfast, compared with exclusively heterosexual men. The predicted negative association (i.e., stress is greater in gay men) only occurred with the health stress and suicidal thoughts variables, whereas gay men experienced less stress compared with heterosexual men on physical disability, social network, and violent victimization variables.3
B-Path Analyses
Within men, taller height was associated with the presence of a physical disability in the participant, less perceived social support, more school stress, more parental rejection, a greater want to run away from home, actually running away from home, eating meat for breakfast, and eating fruit or juice (Table 3). Again, the predicted negative association (i.e., greater stress is associated with being shorter) was not found with any of these variables. Indeed, the opposite positive association occurred, such that greater stress was associated with being taller.
Mediation Analyses
The only stress or nutrition variable that was a candidate for mediation analyses (i.e., there was a difference between gay men and heterosexual men and was associated with height) was physical disability of the participant. We first note that the results are not in the expected direction. That is, a gay sexual orientation was associated with not having a physical disability, and a shorter height was associated with not having a physical disability. If physical disability of the participant mediates the relationship between sexual orientation and height in a theoretically meaningful way, then it would be expected that a gay sexual orientation should be associated with having a physical disability, and a shorter height should be associated with having a physical disability. Convergent with this logic, within men, sexual orientation was still significant (B = − 1.89, SE = 0.80, 95% CI =−3.47 to −0.32, t(128) = −2.38, p = 0.019) after entering physical disability of the participant in the model (B = 1.55, SE = 0.68, 95% CI = 0.21 to 2.88, t(128) = 2.29, p = 0.024). Race/ethnicity and education were significant as well. The reduction in the c-path after including physical disability of the participant in the model (a =− 0.03, SEa = 0.01, b = 1.55, SEb = 0.68; Preacher & Leonardelli, 2001) trended toward significance (Sobel test statistic = −1.81, SE = 0.03, p = 0.07). Given that physical disability of the participant was not a variable of theoretical interest, the a-path and b-path results were not in the expected directions, sexual orientation was still significant in the model with the mediator variable simultaneously entered into the model, and the reduction in the c-path trended toward significance, it is unlikely that physical disability of the participant mediates the relationship between sexual orientation and height within men, even partially.
Accounting for Stress/Nutrition-Height Association Analyses
We also examined the sexual orientation and height relationship in men controlling for significant or marginally significant b-path variables; that is, after entering any potentially confounding variables related to height (see Table 3 in the non-shaded right-most columns). Within men, sexual orientation was still significant (B = −1.83, SE = 0.79, 95% CI =−3.40 to −0.26, t(128) = −2.31, p = 0.023) after simultaneously entering in the following variables that were associated with height (i.e., b-path variables): wanting to run away from home, actually ran away from home, school stress, perceived social support, physical disability of participant, eating meat at breakfast, and eating fruit and juice the day before (see Table 4 for results of the simultaneous linear regression analysis). Sexual orientation was also significant when these variables were entered within their own, separate linear regression analyses. Thus, statistically controlling for stress variables that were associated with height, exclusively gay men were still significantly shorter than exclusively heterosexual men.4
Table 4.
Results of a simultaneous linear regression analysis predicting height within men, using all b-path variables that were significant or marginally significant in Table 3
| Variable |
Height
|
||||
|---|---|---|---|---|---|
| B | SE | 95% CI | t(df) | p | |
| Race/ethnicity | −2.36 | 0.36 | −3.08 to −1.64 | −6.47(128) | <.001 |
| Education | 1.25 | 0.32 | 0.61 to 1.89 | 3.88(128) | <.001 |
| Sexual orientation | −1.83 | 0.79 | −3.40 to −0.26 | −2.31(128) | 0.023 |
| Physical disability of the participant | 1.41 | 0.70 | 0.02 to 2.79 | 2.01(128) | 0.046 |
| Want to run away | 0.09 | 0.12 | −0.15 to +0.32 | 0.72(128) | 0.474 |
| Actually ran away | 0.42 | 0.56 | −0.68 to +1.52 | 0.76(128) | 0.448 |
| School stress | 0.20 | 0.21 | −0.22 to +0.63 | 0.95(128) | 0.345 |
| Perceived social support | 0.35 | 0.28 | −0.21 to +0.91 | 1.24(128) | 0.218 |
| Breakfast: meat | 1.05 | 0.37 | 0.32 to 1.79 | 2.83(128) | 0.005 |
| Ate yesterday: fruit, juice | 0.54 | 0.31 | −0.07 to +1.16 | 1.75(128) | 0.082 |
SE standard error, 95 % CI 95 % confidence interval of B, df degrees of freedom
Discussion
In the current study, it was found, as predicted, that in a nationally representative sample of American adolescents and young adults, exclusively gay men were shorter, on average, than exclusively heterosexual men as adults. In women, there was no statistically significant height difference between exclusively lesbian women and exclusively heterosexual women, which is not what was predicted (although means were in the predicted direction). There were no predicted (i.e., theoretically relevant) variables that emerged as mediator candidates. One unpredicted variable— physical disability of the participant—was a candidate variable for mediation, but was shown to likely not mediate the relationship between sexual orientation and height. Moreover, within men, the sexual orientation and height association was still significant after statistically controlling for stress and nutrition variables that were related to height. Thus, we have found additional support for an objective height difference between gay men and heterosexual men. We did not find evidence that the height difference between gay men and heterosexual men was mediated by stress or nutrition at puberty—a novel result. We found that there was no significant height difference between lesbian and heterosexual women.
Within both men and women, race/ethnicity and education were significant predictors of objective height, such that White individuals and individuals who have had some university/college education were taller than non-White individuals and individuals who have not had any university/college education. The finding of a significant association between height and race/ethnicity is convergent with other studies that have examined the association between race/ethnicity and height (Komlos, 2010; Komlos & Brabec, 2011; Komlos & Breitfelder, 2008; Skorska & Bogaert, 2016). Also, the finding that greater education is associated with being taller has been found in previous studies (Huang, van Poppel, & Lumey, 2015; Meyer & Selmer, 1999; Palta, Prineas, Berman, & Hannan, 1982).
The finding in the current study that gay men were shorter, on average, than heterosexual men supports other studies that have examined the relationship between sexual orientation and height within men (Blanchard & Bogaert, 1996a; Blanchard et al., 1995; Bogaert, 2010; Bogaert & Blanchard, 1996; Bogaert & Liu, 2013; Skorska & Bogaert, 2016). The height/sexual orientation relationship in the present study is also notable because it is only the second time that an objective height difference was found between gay men and heterosexual men (Skorska & Bogaert, 2016; cf. Blanchard et al., 1995 in which a height difference was found between homosexual and heterosexual men with gender dysphoria). The height/sexual orientation relationship within men is not consistent with the findings of Bogaert and Friesen (2002) or Martin and Nguyen (2004), who did not find a height difference between gay men and heterosexual men. Martin and Nguyen did, however, find that gay men had shorter long bones of the body (in the arms, legs, and hands) than heterosexual men.
The finding that the height difference between gay men and heterosexual men is likely not mediated by stress or nutrition at puberty lends further support to a more (prenatal) biological interpretation of the association between sexual orientation and height. Thus, we can likely discount an interpretation of the association that involves a pubertal psychosocial stress or nutrition explanation for the association, although this finding needs to be replicated. For recent evidence that biological markers of stress at puberty (i.e., diurnal cortisol) are not elevated in gay adolescents, see Austin et al. (2016).
One potential mechanism of the height/sexual orientation relationship in men is the prenatal hormone explanation mentioned in Introduction. Support for this explanation stems from research demonstrating that height has a biological basis (e.g., Dubois et al., 2012) which has been associated with prenatal hormones. Testosterone stimulates bone growth at the fetal level and throughout an individual’s life either directly or indirectly through aromatization to estrogen or through growth hormone and insulin-like growth factors (Clarke & Khosla, 2009). Moreover, longer fetuses are associated with being taller as adults, although the exact mechanism linking fetal length and adult height is not known (Eide et al., 2005; Sorensen et al., 1999). The prenatal hormone explanation received some indirect support with the findings of Martin and Nguyen (2004), given that long bones of the arms and legs grow before puberty. Also, gay men and heterosexual men did not differ in trunk length and shoulder width, which are sexually dimorphic parts of the body that develop post puberty, again providing indirect support for a mechanism that occurs prepuberty, although the authors could not address specifically at what time prior to puberty the mechanism operates. On the other hand, a prenatal androgen interpretation for the sexual orientation and height association in men is complicated by some research showing that men with Klinefelter’s syndrome, who have an extra X chromosome (i.e., 47,XXY), are generally tall, but are associated with decreased exposure to prenatal or postnatal androgens (Manning, Kilduff, & Trivers, 2013).
Another potential mechanism involves the fraternal birth order (FBO) effect (i.e., the number of older brothers a man has heightens his chance of being gay), which is hypothesized to be caused by a maternal immune response (e.g., Blanchard & Bogaert, 1996b; Blanchard & VanderLaan, 2015; Bogaert & Skorska, 2011). FBO has been associated with body size (e.g., Blanchard & Ellis, 2001; Bogaert, 2003), including height (Bogaert, 2003). Thus, some mothers may produce an immune response to a male-specific protein that affects both growth and sexual orientation development in later-born boys (e.g., Blanchard, 2004; Blanchard & Klassen, 1997; Blanchard & Bogaert, 1996b; Bogaert & Skorska, 2011).
An additional mechanism may be developmental instability, which can be defined as the degree of genetic or environmental stress that can be experienced by an organism during development (Lalumiere, Blanchard, & Zucker, 2000). A developmental instability explanation has been utilized to explain the finding of increased non-right-handedness in lesbian women and gay men compared to their heterosexual counterparts (Lalumiere et al., 2000). Also, there is some mixed support for the association of increased fluctuating asymmetry (i.e., deviations from perfect symmetry of bodily features) with same-sex sexual orientation (e.g., Lippa, 2003b; Martin, Puts, & Breedlove, 2008; Miller, Hoffman, & Mustanski, 2008; Mustanski, Bailey, & Kaspar, 2002; Schwartz, Kim, Kolundzija, Rieger, & Sanders, 2010), suggesting that developmental instability is linked somewhat to body size. Thus, it is possible that developmental instability may affect both body growth, including height, and sexual orientation in men.
In sum, a number of prenatal factors may account for the height difference between gay and heterosexual men. Future research will be required to determine the exact mechanism, or combination of mechanisms, implicated in this association.
We found that there was no statistically significant height difference between lesbian women and heterosexual women. Although this finding was not what was predicted, it is convergent with other studies that have not found a significant difference in height between lesbian women and heterosexual women (Bogaert, 2010; Bogaert & Friesen, 2002; Bogaert & Liu, 2013; Martin & Nguyen, 2004; Singh et al., 1999; Skorska & Bogaert, 2016). It does not lend support to the height difference found in Bogaert (1998), in which lesbian women were found to be taller, on average, than heterosexual women (see also Martin & Nguyen [2004], who found that lesbian women had significantly longer long bones in the arms and legs than heterosexual women). As was indicated in Skorska and Bogaert (2016), the finding in Bogaert (1998) may be a Type I error, or the lack of other findings in women may be attributed to a lack of power, especially given that the means in, for example, Skorska and Bogaert were in the expected direction. Here it was also found that means were in the expected direction, although the sample size utilized was comparable to that in Bogaert (1998). Perhaps the effect is so small within women that a larger sample of lesbian women would be required to find it. Future research using larger samples of women might clarify whether studies that have not found the height effect within women are due to a power issue.
Nevertheless, the lack of relationship between sexual orientation and height within women (assuming it is reliable) does not discount the body of research that does suggest a biological basis for the development of sexual orientation in women (e.g., 2D:4D finger length ratios: Brown et al., 2005; Grimbos, Dawood, Burriss, Zucker, & Puts, 2010; McFadden & Shubel, 2002; Rahman, 2005; genetics: Burri, Cherkas, Spector, & Rahman, 2011; Langstrom, Rahman, Carlstrom, & Lichtenstein, 2010; otoacoustic emissions: McFadden & Champlin, 2000; McFadden & Pasanen, 1998, 1999; hormones: Pearcey, Docherty, & Dabbs, 1996; Singh et al., 1999; for reviews see Balthazart, 2011; Bao & Swaab, 2011; Hines, 2011; LeVay, 2010; Ngun et al., 2011). Thus, the finding that one biological correlate is unrelated to sexual orientation in women does not rule out the importance of other biological correlates associated with sexual orientation in women.
There were no significant differences between bisexual individuals and heterosexual individuals, or between bisexual individuals and gay/lesbian individuals in height. Bisexual individuals were more similar in height to gay/lesbian individuals than to heterosexual individuals, based on the pattern of results, which is similar to what was found in Skorska and Bogaert (2016). Perhaps, as in women, the association between bisexuality and height may be very small and thus a larger sample of bisexual individuals may be needed to fully explore the association between bisexuality and height. Future studies could explore this possibility, but could also include different measures of bisexuality that do not assume equal attraction to men and to women within bisexual individuals (e.g., Rieger et al., 2013).
We found support for associations between stressors measured at around the time of puberty and sexual orientation within men. An exclusively gay sexual orientation was associated with greater health stress and the presence of suicidal thoughts compared to exclusively heterosexual men. This finding provides additional support for the findings of other studies in which it has been found that same-sex orientation within both men and women is associated with some poorer health outcomes, greater depression, and more suicide than an other-sex orientation (e.g., Boehmer et al., 2012; Collier et al., 2013; Fredriken-Goldsen et al., 2013; Hatzenbuehler et al., 2012; Petterson, VanderLaan, & Vasey, 2016; Ploderl et al., 2013; Rosario et al., 2014; Wichstrom & Hegna, 2003). However, the fact that some stressors were not elevated in gay male adolescents—and even, on some measures, seemed to reflect better adjustment—relative to heterosexual male adolescents also suggests complexity of adjustment, with some sexual minorities having a very good adjustment and a high degree of psychological resilience (e.g., Busseri, Willoughby, Chalmers, & Bogaert, 2006; Rieger & Savin-Williams, 2012; Savin-Williams, 2001).
The finding that a number of measures of stress were associated with being taller within men was unexpected. Perhaps extreme stress would need to occur in order for the negative association to appear, or the negative association only appears in certain subpopulations of male individuals (e.g., those who live in group homes; Johnson & Gunnar, 2011). Moreover, the stress/height relationships were generally modest and only one—physical disability—remained significant in a multivariate context (see Table 4). In addition, one methodological detail is of note: participants who could not stand on their own did not have their height measured (Entzel et al., 2009). This methodological detail may have influenced the height and stress association particularly for the physical disability variable, as it seems likely that the people who could not stand might be more severely disabled and likely shorter. Thus, including a full range of people with disabilities may change the height/disability association. Future research will need to be conducted to further explore the relationship between height and stress in men.
Limitations
One of the limitations of the current study is that the causal directions of the relationships cannot be completely inferred. The longitudinal design of the data collection affords some causal interpretations (e.g., stressors at Wave I, height at Wave IV), but causal interpretations are still limited because the Add Health data are not longitudinal and experimental in design. From an ethical perspective, however, studies incorporating both longitudinal and experimental designs involving sexual orientation research of this nature are unlikely to be conducted. Second, although a number of variables related to stress and nutrition were measured, there may be some variables related to stress and nutrition that were not measured in the Add Health data, and thus not included in the current study, that could play a role in the sexual orientation and height association. Also, some of the stress variables did not achieve high Cronbach’s α levels, which could diminish their relationship with sexual orientation and with height. Further, it is possible that stressors at a time earlier than when Wave I data were collected might explain the sexual orientation and height relationship. For example, stressors in childhood may explain the sexual orientation and height relationship (e.g., maltreatment by parents or peers due to any gender non-conformity present in childhood; Petterson et al., 2016; Rieger, Linsenmeier, Gygax, & Bailey, 2008). On the other hand, one might expect stressors in childhood (e.g., due to gender non-conformity) to persist and thus be related to stressors at adolescence, and yet we found little evidence that stressors at adolescence mediate the height/sexual orientation relation in men. Also, although our study suggests a model of the height/sexual orientation relationship where prenatal factors (e.g., prenatal hormones, a maternal immune response) are implicated in this relationship, such factors—or markers of them—were not included in the current study. Thus, further elucidation of the possible role of prenatal factors in this relationship waits new research. Finally, the sexual orientation and nutrition relationship found in the current study should be interpreted with caution given the limited scope with which nutrition was measured in the Add Health data, and given that the analyses were more exploratory.
Conclusion
Using a nationally representative sample of American adolescents, additional support was found that gay men are shorter, on average, than heterosexual men. It does not appear that pubertal stress or pubertal nutrition, as assessed by variables computed from the Add Health data, mediate the relationship between sexual orientation and height within men. Thus, other mechanisms (e.g., prenatal hormones, maternal immune response) seem to be better candidates for explaining the height difference between gay men and heterosexual men. Within women, height does not seem to be a reliable physical correlate of sexual orientation and thus cannot be added to the list of biological variables associated with their sexual orientation.
Acknowledgments
This research uses data from Add Health, a program project directed by Kathleen Mullan Harris and designed by J. Richard Udry, Peter S. Bearman, and Kathleen Mullan Harris at the University of North Carolina at Chapel Hill, and funded by grant P01-HD31921 from the Eunice Kennedy Shriver National Institute of Child Health and Human Development, with cooperative funding from 23 other federal agencies and foundations. Special acknowledgment is due to Ronald R. Rindfuss and Barbara Entwisle for assistance in the original design. Information on how to obtain the Add Health data files is available on the Add Health website (http://www.cpc.unc.edu/addhealth). No direct support was received from grant P01-HD31921 for this analysis. Thank you to M. Ashton and C. M. McCormick for helpful comments on early drafts of this paper. Thank you to D. Molnar for help with statistical analyses. A version of this paper was included in the Ph.D. dissertation for M. N. Skorska. Data acquisition was supported by a Social Sciences and Humanities Research Council grant to A. F. Bogaert [335-737-042].
Appendix
See Table 5.
Table 5.
Questions and response options from the Add Health data for each nutrition and stress-related variable utilized in the current study
| Variable | Question | Response options |
|---|---|---|
| Nutrition variables | ||
| Breakfast: milk | “What do you usually have for breakfast on a weekday morning?” “milk” | Participants either marked or did not mark each breakfast food option |
| Breakfast: coffee, tea | “coffee or tea” | |
| Breakfast: cereal | “cereal” | |
| Breakfast: fruit, juice | “fruit, juice” | |
| Breakfast: eggs | “eggs” | |
| Breakfast: meat | “meat” | |
| Breakfast: snack food | “snack foods” | |
| Breakfast: breads | “bread, toast, or rolls” | |
| Breakfast: other | “other items” | |
| Breakfast: nothing | “nothing” | |
| Ate yesterday: dairy | “Think about all the food you ate yesterday, including meals and snacks at home, at school, at restaurants, and anywhere else.” “How often did you drink milk, or eat yogurt, or cheese yesterday?” | “didn’t eat,” “ate once,” “ate twice or more” |
| Ate yesterday: fruit, juice | “How often did you eat fruit or drink fruit juice yesterday?” | |
| Ate yesterday: vegetables | “How often did you eat vegetables yesterday?” | |
| Ate yesterday: bread, pasta | “How often did you eat bread, cereal, pretzels, rice, or pasta yesterday?” | |
| Ate yesterday: pastries | “How often did you eat cookies, doughnuts, pie, or cake yesterday?” | |
| Exploratory stress-related variables | ||
| Self-rated health | “In general, how is your health? Would you say…” | “excellent,” “very good,” “good,” “fair,” “poor” |
| Health stress | “Please tell me how often you have had each of the following conditions in the past 12 months.” ”a headache,” “feeling hot all over suddenly, for no reason,” “a stomach ache or an upset stomach,” “cold sweats,” “feeling physically weak, for no reason,” “a sore throat or a cough,” “feeling very tired, for no reason,” “painful or very frequent urination(or peeing),” “feeling really sick,” “waking up feeling tired,” “skin problems, such as itching or pimples,” “dizziness,” “chest pains,” “aches, pains, or soreness in your muscles or joints,” “poor appetite,” “trouble falling asleep or staying asleep,” “trouble relaxing,” “moodiness,” “frequent crying,” “fearfulness,” “cramps during your menstrual period”(for girls) |
“never,” “just a few times,” “about once a week,” “almost every day,” “every day” |
| Parental control | “Do your parents let you make your own decisions about the time you must be home on weekend nights?,” “Do your parents let you make your own decisions about the people you hang around with?,” “Do your parents let you make your own decisions about what you wear?,” “Do your parents let you make your own decisions about how much television you watch?,” “Do your parents let you make your own decisions about which television programs you watch?,” “Do your parents let you make your own decisions about what time you goto bed on week nights?,” “Do your parents let you make your own decisions about what you eat?” | “no,” “yes” |
| Disabled mother | “Is she disabled—that is, mentally or physically handicapped?” | “no,” “yes” |
| Disabled father | “Is he disabled—that is, mentally or physically handicapped?” | “no,” “yes” |
| Physical disability of participant | “Do you have difficulty using your hands, arms, legs, or feet because of a permanent physical condition?,” “Do you use a cane, crutches, walker, medically prescribed shoes, wheelchair, or scooter to get around because of a permanent physical condition?,” “Do you use a brace for your hand, arm, leg, or foot because of a permanent physical condition?,” “Do you use an artificial hand, arm, leg, or foot?” | “no,” “yes” |
| Sexual abuse | “How often did a parent or other adult caregiver touch you in a sexual way, force you to touch him or her in a sexual way, or force you to have sexual relations?” | “one time,” “two times,” “three to five times,” “six to ten times,” “more than ten times,” “this has never happened” |
| Theoretically relevant stress-related variables | ||
| Depressive symptoms | “These questions will ask about how you feel emotionally and about how you feel in general. How often was each of the following things true during the past week?” ”You were bothered by things that usually don’t bother you,” “You didn’t feel like eating, your appetite was poor,” “You felt that you could not shake off the blues, even with help from your family and your friends,” “You felt that you were just as good as other people,” “You had trouble keeping your mind on what you were doing,” “You felt depressed,” “You felt that you were too tired to do things,” “You felt hopeful about the future,” “You thought your life had been a failure,” “You felt fearful,” “You were happy,” “You talked less than usual,” “You felt lonely,” “People were unfriendly to you,” “You enjoyed life,” “You felt sad,” “You felt that peopled is liked you,” “It was hard to get started doing things,” “You felt life was not worth living” |
“never or rarely,” “sometimes,” “a lot of the time,” “most of the time or all of the time” |
| Social network (SN): in degree, reach, out degree, Bonacich centrality | “List your closest male friends. List your best male friend first, then your next best friend, and so on. Girls may include boys who are friends and boyfriends.” “List your closest female friends. List your best female friend first, then your next best friend, and so on. Boys may include girls who are friends and girlfriends.” |
|
| Perceived social support | “How much do you feel that adults care about you?,” “How much do you feel that your teachers care about you?,” “How much do you feel that your parents care about you?,” “How much do you feel that your friends care about you?,” “How much do you feel that people in your family understand you?,” “How much do you feel that you and your family have fun together?,” “How much do you feel that your family pays attention to you?” | “not at all,” “very little,” “somewhat,” “quite a bit,” “very much” |
| Violent victimization | “During the past 12 months, how often did each of the following things happen?” “Someone pulled a knife or gun on you,” “Someone shot you,” “Someone cut or stabbed you,” “You were jumped” | “never,” “once,” “more than once” |
| School belonging | “You feel close to people at your school,” “You feel like you are a part of your school,” “Students at your school are prejudiced,” “You are happy to be at your school,” “The teachers at your school treat students fairly,” “You feel safe in your school” | “strongly agree,” “agree,” “neither agree nor disagree,” “disagree,” “strongly disagree” |
| School stress | “Since school started this year, how often have you had trouble:” “getting along with your teachers,” “getting along with other students,” “paying attention in school,” “getting your homework done” | “never,” “just a few times,” “about once a week,” “almost everyday,” “everyday” |
| Self-esteem | “You have a lot of good qualities,” “You have a lot to be proud of,” “You like yourself just the way you are,” “You feel like you are doing everything just about right,” “You feel socially accepted,” “You feel loved and wanted” | “strongly agree,” “agree,” “neither agree nor disagree,” “disagree,” “strongly disagree” |
| Parental rejection | “How often would it be true for you to make each of the following statements about the participant?” “You get along well with him/her,” “He/she and you make decisions about his/her life together,” “You just do not understand him/her,” “You feel you can really trust him/her,” “He/She interferes with your activities” | “always,” “often,” “sometimes,” “seldom,” “never” |
| Suicidal thoughts | “During the past 12 months, did you ever seriously think aboutcommitting suicide?” | “no,” “yes” |
| Want to run away | “How much do you feel that you want to leave home?” | “not at all,” “very little,” “somewhat,” “quite a bit,” “very much” |
| Ever ran away | “How often did you run away from home?” | “never,” “1 or 2 times,” “3 or 4 times,” “5 or more times” |
| Child–mother connectedness | “Most of the time, your mother is warm and loving toward you,” “Your mother encourages you to be independent,” “When you do something wrong that is important, your mother talks about it with you and helps you understand why it is wrong,” “You are satisfied with the way your mother and you communicate with each other,” “Overall, you are satisfied with your relationship with your mother,” “How close do you feel to your mother?,” “How much do you think she cares about you?” | For the first five items: “strongly agree,” “agree,” “neither agree nor disagree,” “disagree,” “strongly disagree” For the last two items: “not at all,” “very little,” “somewhat,” “quite a bit,” or “very much” |
| Child–father connectedness | “Most of the time, your father is warm and loving toward you,” “You are satisfied with the way your father and you communicate with each other,” “Overall, you are satisfied with your relationship with your father,” “How close do you feel to your father?,” “How much do you think he cares about you?” | For the first three items: “strongly agree,” “agree,” “neither agree nor disagree,” “disagree,” “strongly disagree” For the last two items: “not at all,” “very little,” “somewhat,” “quite a bit,” or “very much” |
| Physical abuse | “Before your 18th birthday, how often did a parent or adult caregiver hit you with a fist, kick you, or throw you down on the floor, into a wall, or down stairs?” | “one time,” “two times,” “three to five times,” “six to ten times,” “more than ten times,” “this has never happened” |
Participants could also indicate “refused,” “don’t know,” “not applicable,” and/or “legitimate skip” to each question, but this was not included in the response option column to save space in the table. See Questionnaire Codebooks for Waves I, II, III and IV (n.d.) for details
Footnotes
Our primary goal with respect to mediation was to examine stress as a mediator. Nutrition was included because variables measuring some aspects of nutrition were available in the dataset used here and there was, as mentioned, some (weak) rationale for examining it as a mediator.
The data in this study could be tested using a moderation model (e.g., stress moderating the relationship between sexual orientation and height); however, moderation is not the focus of this study, and asks a different question (of “when”) than what we are interested in answering in the current study, which is “why.”
For all categorical stress and nutrition variables, logistic regression analyses were also run. Results were the same with the following exceptions: physical disability of the participant was not significant, suicidal thoughts was significant, and eating eggs at breakfast was now marginally significant. We chose to keep the GLM analyses within the paper so that a-path, b-path, c-path, and mediation analyses all used GLM.
Parental rejection was not included in this analysis, although parental rejection was associated with height, in the unpredicted direction (Table 3). We defined a subpopulation of individuals that included male participants with non-missing data on the parental rejection variable. When we conducted the linear regression analysis of sexual orientation predicting height within this subpopulation of participants, the sexual orientation and height association was not significant. This subpopulation of individuals includes a significantly smaller sample size (n = 5655) than for the original analyses within males of the sexual orientation and height association (n = 6475) (with a reduction from n = 126 to n = 105 of gay men). Thus, the association was no longer there in this subsample likely because of a power issue due to loss of sample size needed to detect the small sexual orientation and height effect.
Compliance With Ethical Standards
Conflict of Interest The authors declare no conflict of interest.
Ethical Approval All procedures performed in studies involving human participants were in accordance with the ethical standards of the institutional and/or national research committee and with the 1964 Helsinki declaration and its later amendments or comparable ethical standards.
Informed Consent Informed consent was obtained from all individual participants included in the study by the Add Health researchers. Ethics approval for secondary data analysis was received from the Brock University Research Ethics Board.
References
- Adkins DE, Daw JK, McClay JL, Van Den Oord EJCG. The influence of five monoamine genes on trajectories of depressive symptoms across adolescence and young adulthood. Development and Psychopathology. 2012;24:267–285. doi: 10.1017/S0954579411000824. [DOI] [PMC free article] [PubMed] [Google Scholar]
- Austin SB, Rosario M, McLaughlin KA, Roberts AL, Gordon AR, Sarda V, Scherer EA. Sexual orientation and diurnal cortisol patterns in a cohort of U.S. young adults. Psychoneuroendocrinology. 2016;69:197–208. doi: 10.1016/j.psyneuen.2016.04.012. [DOI] [PMC free article] [PubMed] [Google Scholar]
- Balthazart J. Minireview: Hormones and human sexual orientation. Endocrinology. 2011;152:2937–2947. doi: 10.1210/en.2011-0277. [DOI] [PMC free article] [PubMed] [Google Scholar]
- Bao A, Swaab DF. Sexual differentiation of the human brain: Relation to gender identity, sexual orientation and neuropsychiatric disorder. Frontiers in Neuroendocrinology. 2011;32:214–226. doi: 10.1016/j.yfrne.2011.02.007. [DOI] [PubMed] [Google Scholar]
- Baron RM, Kenny DA. The moderator-mediator variable distinction in social psychological research: Conceptual, strategic, and statistical considerations. Journal of Personality and Social Psychology. 1986;51:1173–1182. doi: 10.1037/0022-3514.51.6.1173. [DOI] [PubMed] [Google Scholar]
- Becker JB, Arnold AP, Berkley KJ, Blaustein JD, Eckel LA, Hampson E, Young E. Strategies and methods for research on sex differences in brain and behavior. Endocrinology. 2005;146:1650–1673. doi: 10.1210/en.2004-1142. [DOI] [PubMed] [Google Scholar]
- Blanchard R. Quantitative and theoretical analyses of the relation between older brothers and homosexuality in men. Journal of Theoretical Biology. 2004;230:173–187. doi: 10.1016/j.jtbi.2004.04.021. [DOI] [PubMed] [Google Scholar]
- Blanchard R, Bogaert AF. Biodemographic comparisons of homosexual and heterosexual men in the Kinsey interview data. Archives of Sexual Behavior. 1996a;25:551–579. doi: 10.1007/BF02437839. [DOI] [PubMed] [Google Scholar]
- Blanchard R, Bogaert AF. Homosexuality in men and number of older brothers. American Journal of Psychiatry. 1996b;153:27–31. doi: 10.1176/ajp.153.1.27. [DOI] [PubMed] [Google Scholar]
- Blanchard R, Dickey R, Jones CL. Comparison of height and weight in homosexual versus nonhomosexual male gender dysphorics. Archives of Sexual Behavior. 1995;24:543–554. doi: 10.1007/BF01541833. [DOI] [PubMed] [Google Scholar]
- Blanchard R, Ellis L. Birth weight, sexual orientation and the sex of preceding siblings. Journal of Biosocial Science. 2001;33:451–467. doi: 10.1017/S0021932001004515. [DOI] [PubMed] [Google Scholar]
- Blanchard R, Klassen P. H-Y antigen and homosexuality in men. Journal of Theoretical Biology. 1997;185:373–378. doi: 10.1006/jtbi.1996.0315. [DOI] [PubMed] [Google Scholar]
- Blanchard R, VanderLaan DP. Commentary on Kishida and Rahman (2015), including a meta-analysis of relevant studies on fraternal birth order and sexual orientation in men. Archives of Sexual Behavior. 2015;44:1503–1509. doi: 10.1007/s10508-015-0555-8. [DOI] [PubMed] [Google Scholar]
- Boehmer U, Bowen DJ. Examining factors linked to overweight and obesity in women of different sexual orientations. Preventive Medicine. 2009;48:357–361. doi: 10.1016/j.ypmed.2009.02.003. [DOI] [PubMed] [Google Scholar]
- Boehmer U, Miao X, Linkletter C, Clark MA. Adult health behaviors over the life course by sexual orientation. American Journal of Public Health. 2012;102:292–300. doi: 10.2105/AJPH.2011.300334. [DOI] [PMC free article] [PubMed] [Google Scholar]
- Bogaert AF. Physical development and sexual orientation in women: Height, weight, and age of puberty comparisons. Personality and Individual Differences. 1998;24:115–121. doi: 10.1016/S0191-8869(97)00111-6. [DOI] [Google Scholar]
- Bogaert AF. The interaction of fraternal birth order and body size in male sexual orientation. Behavioral Neuroscience. 2003;117:381–384. doi: 10.1037/0735-7044.117.2.381. [DOI] [PubMed] [Google Scholar]
- Bogaert AF. Physical development and sexual orientation in men and women: An analysis of NATSAL-2000. Archives of Sexual Behavior. 2010;39:110–116. doi: 10.1007/s10508-008-9398-x. [DOI] [PubMed] [Google Scholar]
- Bogaert AF, Blanchard R. Physical development and sexual orientation in men: Height, weight and age of puberty differences. Personality and Individual Differences. 1996;21:77–84. doi: 10.1016/0191-8869(96)00045-1. [DOI] [Google Scholar]
- Bogaert AF, Friesen C. Sexual orientation and height, weight, and age of puberty: New tests from a British national probability sample. Biological Psychology. 2002;59:135–145. doi: 10.1016/S0301-0511(01)00131-4. [DOI] [PubMed] [Google Scholar]
- Bogaert AF, Liu J. Physical size and sexual orientation: Analysis of the Chinese Health and Family Life Survey. Archives of Sexual Behavior. 2013;42:1555–1559. doi: 10.1007/s10508-013-0110-4. [DOI] [PubMed] [Google Scholar]
- Bogaert AF, Skorska M. Sexual orientation, fraternal birth order, and the maternal immune hypothesis: A review. Frontiers in Neuroendocrinology. 2011;32:247–254. doi: 10.1016/j.yfrne.2011.02.004. [DOI] [PubMed] [Google Scholar]
- Brown WM, Finn CJ, Cooke BM, Breedlove SM. Differences in finger length ratios between self-identified “butch” and “femme”lesbians. Archives of Sexual Behavior. 2005;31:123–127. doi: 10.1023/A:1014091420590. [DOI] [PubMed] [Google Scholar]
- Burri A, Cherkas L, Spector T, Rahman Q. Genetic and environmental influences on female sexual orientation, childhood gender typicality and adult gender identity. PLoS One. 2011;6:1–8. doi: 10.1371/journal.pone.0021982. [DOI] [PMC free article] [PubMed] [Google Scholar]
- Busseri MA, Willoughby T, Chalmers H, Bogaert AF. Same-sex attraction and successful adolescent development. Journal of Youth and Adolescence. 2006;35:563–575. doi: 10.1007/s10964-006-9071-4. [DOI] [Google Scholar]
- Chen P, Chantala K. Guidelines for analyzing Add Health data. 2014 Mar; Retrieved from http://www.cpc.unc.edu/projects/addhealth/data/guides/wt-guidelines.pdf.
- Chernausek SD, Backeljauw PF, Frane J, Kuntze J, Underwood LE. Long-term treatment with recombinant insulin-like growth factor (IGF)-I in children with severe IGF-I deficiency due to growth hormone insensitivity. Journal of Clinical Endocrinology & Metabolism. 2007;92:902–910. doi: 10.1210/jc.2006-1610. [DOI] [PubMed] [Google Scholar]
- Clarke BL, Khosla S. Androgens and bone. Steroids. 2009;74:296–305. doi: 10.1016/j.steroids.2008.10.003. [DOI] [PMC free article] [PubMed] [Google Scholar]
- Collier KL, van Beusekom G, Bos HMW, Sandfort TGM. Sexual orientation and gender identity/expression related peer victimization in adolescence: A systematic review of associated psychosocial and health outcomes. Journal of Sex Research. 2013;50:299–317. doi: 10.1080/00224499.2012.750639. [DOI] [PMC free article] [PubMed] [Google Scholar]
- Cutler GB. The role of estrogen in bone growth and maturation during childhood and adolescence. Journal of Steroid Biochemistry and Molecular Biology. 1997;61:141–144. doi: 10.1016/S0960-0760(97)80005-2. [DOI] [PubMed] [Google Scholar]
- de Beer H. Dairy products and physical stature: A systematic review and meta-analysis of controlled trials. Economics and Human Biology. 2012;10:299–309. doi: 10.1016/j.ehb.2011.08.003. [DOI] [PubMed] [Google Scholar]
- Deputy NP, Boehmer U. Determinants of body weight among men of different sexual orientation. Preventive Medicine. 2010;51:129–131. doi: 10.1016/j.ypmed.2010.05.010. [DOI] [PubMed] [Google Scholar]
- Dubois L, Kyvik KO, Girard M, Tatone-Tokuda F, Perusse D, Hjelmborg J, Martin NG. Genetic and environmental contributions to weight, height, and BMI from birth to 19 years of age: An international study of over 12,000t win pairs. PLoS One. 2012;7:1–12. doi: 10.1371/journal.pone.0030153. [DOI] [PMC free article] [PubMed] [Google Scholar]
- Eide MG, Oyen N, Skjoerven R, Nilsen ST, Bjerkedal T, Tell GS. Size at birth and gestational age as predictors of adult height and weight. Epidemiology. 2005;16:175–181. doi: 10.1097/01.ede.0000152524.89074.bf. [DOI] [PubMed] [Google Scholar]
- Ellis L, Ames MA. Neurohormonal functioning and sexual orientation: A theory of homosexuality-heterosexuality. Psychological Bulletin. 1987;101:233–258. doi: 10.1037/0033-2909.101.2.233. [DOI] [PubMed] [Google Scholar]
- Entzel P, Whitsel EA, Richardson A, Tabor J, Hallquist S, Hussey J, Harris KM. Add Health Wave IV documentation: Cardiovascular and anthropometric measures. 2009 Retrieved from http://www.cpc.unc.edu/projects/addhealth/data/guides/Wave%20IV%20cardiovascular%20and%20anthropometric%20documentation%20110209.pdf.
- Fournier ME, Austin SB, Samples CL, Goodenow CS, Wylie SA, Corliss HL. A comparison of weight-related behaviors among high school students who are homeless and non-homeless. Journal of School Health. 2009;79:466–473. doi: 10.1111/j.1746-1561.2009.00436.x. [DOI] [PubMed] [Google Scholar]
- Frayer DW, Wolpoff MH. Sexual dimorphism. Annual Review of Anthropology. 1985;14:429–473. [Google Scholar]
- Fredriksen-Goldsen KI, Kim H, Barkan SE, Muraco A, Hoy-Ellis CP. Health disparities among lesbian, gay, and bisexual older adults: Results from a population-based study. American Journal of Public Health. 2013;103:1802–1809. doi: 10.2105/AJPH.2012.301110. [DOI] [PMC free article] [PubMed] [Google Scholar]
- Galliher RV, Rostosky SS, Hughes HK. School belonging, self-esteem, and depressive symptoms in adolescents: An examination of sex, sexual attraction status, and urbanicity. Journal of Youth and Adolescence. 2004;33:235–245. doi: 10.1023/B:JOYO.0000025322.11510.9d. [DOI] [Google Scholar]
- Garnett SP, Hogler W, Blades B, Baur LA, Peat J, Lee J, Cowell CT. Relation between hormones and body composition, including bone, in prepubertal children. American Journal of Clinical Nutrition. 2004;80:966–972. doi: 10.1093/ajcn/80.4.966. [DOI] [PubMed] [Google Scholar]
- Geary MPP, Pringle PJ, Rodeck CH, Kingdom JCP, Hindmarsh PC. Sexual dimorphism in the growth hormone and insulin-like growth factor axis at birth. Journal of Clinical Endocrinology & Metabolism. 2003;88:3708–3714. doi: 10.1210/jc.2002-022006. [DOI] [PubMed] [Google Scholar]
- Georgiades K, Boyle MH, Fife KA. Emotional and behavioural problems among adolescent students: The role of immigrant, racial/ethnic congruence and belongingness in schools. Journal of Youth and Adolescence. 2013;42:1473–1492. doi: 10.1007/s10964-012-9868-2. [DOI] [PubMed] [Google Scholar]
- Gohlke BC, Frazer FL, Stanhope R. Growth hormone secretion and long-term growth data in children with psychosocial short stature treated by different changes in environment. Journal of Pediatric Endocrinology and Metabolism. 2004;17:637–643. doi: 10.1515/jpem.2004.17.4.637. [DOI] [PubMed] [Google Scholar]
- Gooren L. The biology of human psychosexual differentiation. Hormones and Behavior. 2006;50:589–601. doi: 10.1016/j.yhbeh.2006.06.011. [DOI] [PubMed] [Google Scholar]
- Gray JP, Wolfe LD. Height and sexual dimorphism of stature among human societies. American Journal of Physical Anthropology. 1980;53:441–456. doi: 10.1002/ajpa.1330530314. [DOI] [PubMed] [Google Scholar]
- Grimbos T, Dawood K, Burriss RP, Zucker KJ, Puts DA. Sexual orientation and the second to fourth finger length ratio: A meta-analysis in men and women. Behavioral Neuroscience. 2010;124:278–287. doi: 10.1037/a0018764. [DOI] [PubMed] [Google Scholar]
- Harris KM. The National Longitudinal Study of Adolescent to Adult Health (Add Health), Waves I & II, 1994–1996; Wave III, 2001–2002; Wave IV, 2007–2009 [Machine-readable data file and documentation] Chapel Hill, NC: Carolina Population Center, University of North Carolina at Chapel Hill; 2009. [DOI] [Google Scholar]
- Harris KM. The Add Health Study: Design and accomplishments. 2013 Retrieved from http://www.cpc.unc.edu/projects/addhealth/data/guides/DesignPaperWIIV.pdf.
- Harris KM, Halpern CT, Whitsel E, Hussey J, Tabor J, Entzel P, Udry JR. The National Longitudinal Study of Adolescent to Adult Health: Research design. 2009 Retrieved from http://www.cpc.unc.edu/projects/addhealth/design.
- Hatzenbuehler ML, McLaughlin KA, Xuan Z. Social networks and risk for depressive symptoms in a national sample of sexual minority youths. Social Science and Medicine. 2012;75:1184–1191. doi: 10.1016/j.socscimed.2012.05.030. [DOI] [PMC free article] [PubMed] [Google Scholar]
- Heard HE, Gorman BK, Kapinus CA. Family structure and self-rated health in adolescence and young adulthood. Population Research and Policy Review. 2008;27:773–797. doi: 10.1007/s11113-008-9090-9. [DOI] [Google Scholar]
- Hines M. Prenatal endocrine influences on sexual orientation and on sexually differentiated childhood behavior. Frontiers in Neuroendocrinology. 2011;32:170–182. doi: 10.1016/j.yfrne.2011.02.006. [DOI] [PMC free article] [PubMed] [Google Scholar]
- Huang Y, van Poppel F, Lumey LH. Differences in height by education among 371, 105 Dutch military conscripts. Economics and Human Biology. 2015;17:202–207. doi: 10.1016/j.ehb.2014.11.002. [DOI] [PMC free article] [PubMed] [Google Scholar]
- Jabson JM, Farmer GW, Bowen DJ. Stress mediates the relationship between sexual orientation and behavioral risk disparities. BMC Public Health. 2014;14:401. doi: 10.1186/1471-2458-14-401. [DOI] [PMC free article] [PubMed] [Google Scholar]
- Jager J, Davis-Kean PE. Same-sex sexuality and adolescent psychological well-being: The influence of sexual orientation, early reports of same-sex attraction, and gender. Self and Identity. 2011;10:417–444. doi: 10.1080/15298861003771155. [DOI] [PMC free article] [PubMed] [Google Scholar]
- Jansson JO, Ekberg S, Isaksson O, Mode A, Gustafsson JA. Imprinting of growth hormone secretion, body growth, and hepatic steroid metabolism by neonatal testosterone. Endocrinology. 1985;117:1881–1889. doi: 10.1210/endo-117-5-1881. [DOI] [PubMed] [Google Scholar]
- Johns MM, Zimmerman M, Bauermeister JA. Sexual attraction, sexual identity, and psychosocial wellbeing in a national sample of young women during emerging adulthood. Journal of Youth and Adolescence. 2013;42:82–95. doi: 10.1007/s10964-012-9795-2. [DOI] [PMC free article] [PubMed] [Google Scholar]
- Johnson DE, Gunnar MR. Growth failure in institutionalized children. Monographs of the Society for Research in Child Development. 2011;76:92–126. doi: 10.1111/j.1540-5834.2011.00629.x. [DOI] [PMC free article] [PubMed] [Google Scholar]
- Katz-Wise SL, Calzo JP, Li G, Pollitt A. Same data different perspectives: What is at stake? Response to Savin-Williams Joyner (2014a) [Letter to the Editor] Archives of Sexual Behavior. 2015;44:15–19. doi: 10.1007/s10508-014-0434-8. [DOI] [PubMed] [Google Scholar]
- Komlos J. The recent decline in the height of African-American women. Economics and Human Biology. 2010;8:58–66. doi: 10.1016/j.ehb.2009.12.004. [DOI] [PubMed] [Google Scholar]
- Komlos J, Brabec M. The trend of BMI values of US adults by deciles, birth cohorts 1882–1986 stratified by gender and ethnicity. Economics and Human Biology. 2011;9:234–250. doi: 10.1016/j.ehb.2011.03.005. [DOI] [PubMed] [Google Scholar]
- Komlos J, Breitfelder A. Differences in the physical growth of US-born black and white children and adolescents ages 2–19, born 1942–2002. Annals of Human Biology. 2008;35:11–21. doi: 10.1080/03014460701747176. [DOI] [PubMed] [Google Scholar]
- Lalumiere ML, Blanchard R, Zucker KJ. Sexual orientation and handedness in men and women: A meta-analysis. Psychological Bulletin. 2000;126:575–592. doi: 10.1037//0033-2909.126.4.575. [DOI] [PubMed] [Google Scholar]
- Langstrom N, Rahman Q, Carlstrom E, Lichtenstein P. Genetic and environmental effects on same-sex sexual behavior: A population study of twins in Sweden. Archives of Sexual Behavior. 2010;39:75–80. doi: 10.1007/s10508-008-9386-1. [DOI] [PubMed] [Google Scholar]
- LeVay S. Gay, straight, and the reason why: The science of sexual orientation. New York: Oxford University Press Inc; 2010. [Google Scholar]
- Li G, Katz-Wise SL, Calzo JP. The unjustified doubt of Add Health studies on the health disparities of non-heterosexual adolescents: Comment on Savin-Williams and Joyner (2014) [Letter to the Editor] Archives of Sexual Behavior. 2014;43:1023–1026. doi: 10.1007/s10508-014-0313-3. [DOI] [PubMed] [Google Scholar]
- Lichanska AM, Waters MJ. How growth hormone controls growth, obesity and sexual dimorphism. Trends in Genetics. 2008;24:41–47. doi: 10.1016/j.tig.2007.10.006. [DOI] [PubMed] [Google Scholar]
- Lindley LL, Walsemann KM, Carter JW., Jr The association of sexual orientation measures with young adults’ health-related outcomes. American Journal of Public Health. 2012;102:1177–1185. doi: 10.2105/AJPH.2011.300262. [DOI] [PMC free article] [PubMed] [Google Scholar]
- Lippa RA. Are 2D:4D finger-length ratios related to sexual orientation? Yes for men, no for women. Journal of Personality and Social Psychology. 2003a;85:179–188. doi: 10.1037/0022-3514.85.1.179. [DOI] [PubMed] [Google Scholar]
- Lippa RA. Handedness, sexual orientation, and gender-related personality traits in men and women. Archives of Sexual Behavior. 2003b;32:103–114. doi: 10.1023/A:1022444223812. [DOI] [PubMed] [Google Scholar]
- Manning JT, Churchill AJG, Peters M. The effects of sex, ethnicity, and sexual orientation on self-measured digit ratio (2D:4D) Archives of Sexual Behavior. 2007;36:223–233. doi: 10.1007/s10508-007-9171-6. [DOI] [PubMed] [Google Scholar]
- Manning JT, Fink B. Digit ratio (2D:4D), dominance, reproductive success, asymmetry, and sociosexuality in the BBC internet study. American Journal of Human Biology. 2008;20:451–461. doi: 10.1002/ajhb.20767. [DOI] [PubMed] [Google Scholar]
- Manning JT, Kilduff LP, Trivers R. Digit ratio (2D:4D) in Klinefelter’s syndrome. Andrology. 2013;1:94–99. doi: 10.1111/j.2047-2927.2012.00013.x. [DOI] [PubMed] [Google Scholar]
- Martin JT, Nguyen DH. Anthropometric analysis of homosexuals and heterosexuals: Implications for early hormone exposure. Hormones and Behavior. 2004;45:31–39. doi: 10.1016/j.yhbeh.2003.07.003. [DOI] [PubMed] [Google Scholar]
- Martin JT, Puts DA, Breedlove SM. Hand asymmetry in heterosexual and homosexual men and women: Relationship to 2D:4D digit ratios and other sexually dimorphic anatomical traits. Archives of Sexual Behavior. 2008;37:119–132. doi: 10.1007/s10508-007-9279-8. [DOI] [PubMed] [Google Scholar]
- Martorell R. Physical growth and development of the malnourished child: Contributions from 50 years of research at INCAP. Food and Nutrition Bulletin. 2010;31:68–82. doi: 10.1177/156482651003100108. [DOI] [PubMed] [Google Scholar]
- McFadden D. A masculinizing effect on the auditory systems of human females having male co-twins. Proceedings of the National Academy of Sciences of the United States of America. 1993;90:11900–11904. doi: 10.1073/pnas.90.24.11900. [DOI] [PMC free article] [PubMed] [Google Scholar]
- McFadden D. Sex differences in the auditory system. Developmental Neuropsychology. 1998;14:261–298. doi: 10.1080/87565649809540712. [DOI] [Google Scholar]
- McFadden D, Champlin CA. Comparison of auditory evoked potentials in heterosexual, homosexual, and bisexual males and females. Journal of Auditory Research in Ontycology. 2000;1:89–99. doi: 10.1007/s101620010008. [DOI] [PMC free article] [PubMed] [Google Scholar]
- McFadden D, Pasanen EG. Comparison of the auditory systems of heterosexuals and homosexuals: Click-evoked otoacoustic emissions. Proceedings of the National Academy of Sciences of the United States of America. 1998;95:2709–2713. doi: 10.1073/pnas.95.5.2709. [DOI] [PMC free article] [PubMed] [Google Scholar]
- McFadden D, Pasanen EG. Spontaneous otoacoustic emission in heterosexuals, homosexuals, and bisexuals. Journal of the Acoustical Society of America. 1999;105:2403–2413. doi: 10.1121/1.426845. [DOI] [PubMed] [Google Scholar]
- McFadden D, Shubel E. Relative lengths of fingers and toes in human males and females. Hormones and Behavior. 2002;42:492–500. doi: 10.1006/hbeh.2002.1833. [DOI] [PubMed] [Google Scholar]
- Meyer HE, Selmer R. Income, educational level and body height. Annals of Human Biology. 1999;26:219–227. doi: 10.1080/030144699282723. [DOI] [PubMed] [Google Scholar]
- Miller SS, Hoffman HL, Mustanski BS. Fluctuating asymmetry and sexual orientation in men and women. Archives of Sexual Behavior. 2008;37:150–157. doi: 10.1007/s10508-007-9256-2. [DOI] [PubMed] [Google Scholar]
- Mustanski BS, Bailey JM, Kaspar S. Dermatoglyphics, handedness, sex, and sexual orientation. Archives of Sexual Behavior. 2002;31:113–122. doi: 10.1023/A:1014039403752. [DOI] [PubMed] [Google Scholar]
- Neumark-Sztainer D, Story M, Resnick MD, Blum RW. Lessons learned about adolescent nutrition from the Minnesota Adolescent Health Survey. Journal of the American Dietetic Association. 1998;98:1449–1456. doi: 10.1016/S0002-8223(98)00329-0. [DOI] [PubMed] [Google Scholar]
- Ngun TC, Ghahramani N, Sanchez FJ, Bocklandt S, Vilain E. The genetics of sex differences in brain and behavior. Frontiers in Neuroendocrinology. 2011;32:227–246. doi: 10.1016/j.yfrne.2010.10.001. [DOI] [PMC free article] [PubMed] [Google Scholar]
- Nooney JG. Religion, stress, and mental health in adolescence. Findings from Add Health. Review of Religious Research. 2005;46:341–354. doi: 10.2307/3512165. [DOI] [Google Scholar]
- Palta M, Prineas RJ, Berman R, Hannan P. Comparison of self-reported and measured height and weight. American Journal of Epidemiology. 1982;115:223–230. doi: 10.1093/oxfordjournals.aje.a113294. [DOI] [PubMed] [Google Scholar]
- Pearcey SM, Docherty KJ, Dabbs JM. Testosterone and sex role identification in lesbian couples. Physiology & Behavior. 1996;60:1033–1035. doi: 10.1016/0031-9384(96)00132-1. [DOI] [PubMed] [Google Scholar]
- Petterson LJ, VanderLaan DP, Vasey PL. Sex, sexual orientation, gender atypicality, and traits of depression and anxiety in childhood and adulthood. Archives of Sexual Behavior. 2016 doi: 10.1007/s10508-016-0690-x. [DOI] [PubMed] [Google Scholar]
- Ploderl M, Wagenmakers E, Tremblay P, Ramsay R, Kralovec K, Fartacek C, Fartacek R. Suicide risk and sexual orientation: A critical review. Archives of Sexual Behavior. 2013;42:715–727. doi: 10.1007/s10508-012-0056-y. [DOI] [PubMed] [Google Scholar]
- Poole GD, Matheson DH, Cox D. The psychology of health and health care: A Canadian perspective. 3rd. Toronto: Prentice Hall; 2008. [Google Scholar]
- Preacher KJ, Leonardelli GJ. Calculation for the Sobel test: An interactive calculation tool for mediation tests. 2001 Mar; Retrieved January 31, 2016 from http://quantpsy.org/sobel/sobel.htm.
- Questionnaire Codebooks for Waves I, II, III and IV. (n.d.). Retrieved January 20, 2016, from http://www.cpc.unc.edu/projects/addhealth/codebooks.
- Rahman Q. Fluctuating asymmetry, second to fourth finger length ratios and human sexual orientation. Psychoneuroendocrinology. 2005;30:382–391. doi: 10.1016/j.psyneuen.2004.10.006. [DOI] [PubMed] [Google Scholar]
- Rieger G, Linsenmeier JAW, Gygax L, Bailey JM. Sexual orientation and childhood gender nonconformity: Evidence from home videos. Developmental Psychology. 2008;44:46–58. doi: 10.1037/0012-1649.44.1.46. [DOI] [PubMed] [Google Scholar]
- Rieger G, Rosenthal AM, Cash BM, Linsenmeier JAW, Bailey JM, Savin-Williams RC. Male bisexual a rousal: A matter of curiosity? Biological Psychology. 2013;94:479–489. doi: 10.1016/j.biopsycho.2013.09.007. [DOI] [PubMed] [Google Scholar]
- Rieger G, Savin-Williams RC. Gender nonconformity, sexual orientation, and psychological well-being. Archives of Sexual Behavior. 2012;41:611–621. doi: 10.1007/s10508-011-9738-0. [DOI] [PubMed] [Google Scholar]
- Rosario M, Reisner SL, Corliss HL, Wypij D, Frazier AL, Austin SB. Disparities in depressive distress by sexual orientation in emerging adults: The roles of attachment and stress paradigms. Archives of Sexual Behavior. 2014;43:901–916. doi: 10.1007/s10508-013-0129-6. [DOI] [PMC free article] [PubMed] [Google Scholar]
- Savin-Williams RC. A critique of research on sexual-minority youths. Journal of Adolescence. 2001;24:5–13. doi: 10.1006/jado.2000.0369. [DOI] [PubMed] [Google Scholar]
- Savin-Williams RC, Joyner K. The dubious assessment of gay, lesbian, and bisexual adolescents of Add Health. Archives of Sexual Behavior. 2014a;43:413–422. doi: 10.1007/s10508-013-0219-5. [DOI] [PubMed] [Google Scholar]
- Savin-Williams RC, Joyner K. The politicization of gay youth health: Response to Li, Katz-Wise, and Calzo (2014) [Letter to the Editor] Archives of Sexual Behavior. 2014b;43:1027–1030. doi: 10.1007/s10508-014-0359-2. [DOI] [PubMed] [Google Scholar]
- Schreck CJ, Burek MW, Stewart EA, Miller JM. Distress and violent victimization among young adolescents: Early puberty and the social interactionist explanation. Journal of Research in Crime and Delinquency. 2007;44:381–405. doi: 10.1177/0022427807305851. [DOI] [Google Scholar]
- Schwartz G, Kim RM, Kolundzija AB, Rieger G, Sanders AR. Biodemographic and physical correlates of sexual orientation in men. Archives of Sexual Behavior. 2010;39:93–109. doi: 10.1007/s10508-009-9499-1. [DOI] [PubMed] [Google Scholar]
- Singh D, Vidaurri M, Zambarano RJ, Dabbs JM. Lesbian erotic role identification: Behavioral, morphological, and hormonal correlates. Journal of Personality and Social Psychology. 1999;76:1035–1049. doi: 10.1037/0022-3514.76.6.1035. [DOI] [PubMed] [Google Scholar]
- Skorska MN, Bogaert AF. Sexual orientation, objective height, and self-reported height. Journal of Sex Research. 2016 doi: 10.1080/00224499.2015.1124831. [DOI] [PubMed] [Google Scholar]
- Skorska MN, Geniole SN, Vrysen BM, McCormick CM, Bogaert AF. Facial structure predicts sexual orientation in both men and women. Archives of Sexual Behavior. 2015;44:1377–1394. doi: 10.1007/s10508-014-0454-4. [DOI] [PubMed] [Google Scholar]
- Slopen N, McLaughlin KA, Dunn EC, Koenen KC. Childhood adversity and cell-mediated immunity in young adulthood: Does type and timing matter? Brain, Behavior, and Immunity. 2013;28:63–71. doi: 10.1016/j.bbi.2012.10.018. [DOI] [PMC free article] [PubMed] [Google Scholar]
- Sorensen HT, Sabroe S, Rothman KJ, Gillman M, Steffensen FH, Fischer P, Sorensen TIA. Birth weight and length as predictors for adult height. American Journal of Epidemiology. 1999;149:726–729. doi: 10.1093/oxfordjournals.aje.a009881. [DOI] [PubMed] [Google Scholar]
- Surkan PJ, Ettinger AK, Hock RS, Ahmed S, Strobino DM, Minkovitz CS. Early maternal depressive symptoms and child growth trajectories: A longitudinal analysis of a nationally representative US birth cohort. BMC Pediatrics. 2014;14:185. doi: 10.1186/1471-2431-14-185. [DOI] [PMC free article] [PubMed] [Google Scholar]
- Valentova JV, Kleisner K, Havlicek J, Neustupa J. Shape differences between the faces of homosexual and heterosexual men. Archives of Sexual Behavior. 2014;43:353–361. doi: 10.1007/s10508-013-0194-x. [DOI] [PubMed] [Google Scholar]
- Walker JL, Van Wyk JJ, Underwood LE. Stimulation of statural growth by recombinant insulin-like growth factor-I in a child with growth-hormone insensitivity syndrome (laron type) Journal of Pediatrics. 1992;121:641–646. doi: 10.1016/S0022-3476(05)81163-1. [DOI] [PubMed] [Google Scholar]
- Wichstrom L, Hegna K. Sexual orientation and suicide attempt: A longitudinal study of the general Norwegian adolescent population. Journal of Abnormal Psychology. 2003;112:144–151. doi: 10.1037/0021-843X.112.1.144. [DOI] [PubMed] [Google Scholar]
- Wickrama KAS, Noh S, Elder GH. An investigation of family SES-based inequalities in depressive symptoms from early adolescence to emerging adulthood. Advances in Life Course Research. 2009;14:147–161. doi: 10.1016/j.alcr.2010.04.001. [DOI] [PMC free article] [PubMed] [Google Scholar]
- Wickrama KAS, O’ Neal CW, Oshri A. Are stressful developmental processes of youths leading to health problems amplified by genetic polymorphisms? The case of body mass index. Journal of Youth and Adolescence. 2014;43:1096–1109. doi: 10.1007/s10964-014-0109-8. [DOI] [PubMed] [Google Scholar]
- Wight RG, Botticello AL, Aneshensel CS. Socioeconomic context, social support, and adolescent mental health: A multilevel investigation. Journal of Youth and Adolescence. 2006;35:115–126. doi: 10.1007/s10964-005-9009-2. [DOI] [Google Scholar]
- Williams KA, Chapman MV. Unmet health and mental health need among adolescents: The roles of sexual minority status and child–parent connectedness. American Journal of Orthopsychiatry. 2012;82:473–481. doi: 10.1111/j.1939-0025.2012.01182.x. [DOI] [PubMed] [Google Scholar]