

Abstract
Motivation
Computational methods for the prediction of peptide-MHC binding have become an integral and essential component for candidate selection in experimental T cell epitope discovery studies. The sheer amount of published prediction methods—and often discordant reports on their performance—poses a considerable quandary to the experimentalist who needs to choose the best tool for their research.
Results
With the goal to provide an unbiased, transparent evaluation of the state-of-the-art in the field, we created an automated platform to benchmark peptide-MHC class II binding prediction tools. The platform evaluates the absolute and relative predictive performance of all participating tools on data newly entered into the Immune Epitope Database (IEDB) before they are made public, thereby providing a frequent, unbiased assessment of available prediction tools. The benchmark runs on a weekly basis, is fully automated, and displays up-to-date results on a publicly accessible website. The initial benchmark described here included six commonly used prediction servers, but other tools are encouraged to join with a simple sign-up procedure. Performance evaluation on 59 data sets composed of over 10 000 binding affinity measurements suggested that NetMHCIIpan is currently the most accurate tool, followed by NN-align and the IEDB consensus method.
Availability and implementation
Weekly reports on the participating methods can be found online at: http://tools.iedb.org/auto_bench/mhcii/weekly/.
Supplementary information
Supplementary data are available at Bioinformatics online.
1 Introduction
Antigen presentation to helper T cells typically begins with the uptake of antigenic material from extracellular proteins, which are processed by proteases into short peptides typically 10–25 amino acids long. Peptides can then be loaded onto Major Histocompatibility Complex (MHC) class II molecules and transported to the surface of the cell, where they are scrutinized by helper (CD4+) T cells (Blum et al., 2013). The various steps in the pathway leading to peptide presentation should ensure that the immune system has the ability to distinguish between self and non-self material, and mounts an immune response if foreign antigens are detected. Failure to differentiate self and non-self can result in autoimmunity and other serious health complications.
Peptide binding to MHC class II molecules is probably the most studied and well-understood step in antigen presentation to CD4+ T cells. Although significant progress has been made toward developing cost-effective experimental methods for screening peptide binding to MHC class II (Justesen et al., 2009), the effort involved in performing an exhaustive characterization of the binding specificity of all prevalent MHC class II molecules remains prohibitive. Several computational methods for the prediction of MHC class II binding have been developed, offering an attractive alternative to costly experimental methods. These include ARB (Bui et al., 2005), SVRMHC (Wan et al., 2006), MHCpred (Doytchinova and Flower, 2003), NN-align (Nielsen and Lund, 2009), TEPITOPE (Sturniolo et al., 1999a), and several others (Dhanda et al., 2016). Pan-specific methods such as TEPITOPEpan (Zhang et al., 2012) and NetMHCIIpan (Nielsen et al., 2008) can infer the binding specificities of molecules with scarce or no measured binding data by inferring binding specificity from other well-characterized molecules, and are therefore applicable to a larger library of MHC molecules; in the case of NetMHCIIpan that extends to all molecules with known MHC protein sequence. With variable degrees of accuracy, all these methods allow the identification of peptides that are likely binders of MHC class II molecules. However, the large number of available methods may be daunting for the user when it comes to selecting the best method for a given problem.
Several studies have performed systematic evaluations of the performance of peptide-MHC II binding predictors (Lin et al., 2008; Wang et al., 2008, 2010). The general conclusion of these studies is that, despite encouraging improvements, the performance of peptide-MHC II binding algorithms remains considerably inferior to that of MHC class I binding predictors. While informative and useful, these benchmark studies are all based on a static dataset, often from a single lab, and may not accurately represent the global performance of the different methods. Additionally, there is often a considerable lag between the time a benchmarking study is carried out and the publication of the results in a manuscript. As prediction methods are rapidly improved and updated, the results of these evaluations are often outdated by the time they become public. Finally, as users gravitate around older and well-established methods, novel algorithms from research groups that are new in the field may not receive the attention they deserve in the absence of an open, transparent benchmarking scheme.
In a recent study, Trolle et al. (2015) described a platform that automatically runs weekly benchmarks of peptide-MHC class I binding predictions on data newly deposited into the Immune Epitope Database (IEDB) (Vita et al., 2015), and reports the results online in real time. Because the data are drawn from different sources and studies, and the results are immediately available to the public, this strategy provides an up-to-date and unbiased assessment of the different prediction methods. The benchmark started with four participating methods in 2014 and has later seen its number of competitors increase to nine, attracting interest and participation also from externally developed tools.
Here, we describe a strategy for the automated benchmarking of MHC II binding prediction methods, in analogy to the approach developed by Trolle et al. (2015) for MHC class I predictors. The benchmarking platform sends data newly entered in the IEDB to each of the participating methods, which are hosted externally as RESTful web services, and retrieves their prediction scores. The performance of the participating methods is then displayed in real time on a public webpage, providing a timely and up-to-date evaluation of the prediction methods. The effort required from tool developers to participate is minimal—they are only required to provide a minimal functioning RESTful web service with the ability to accept input sequences and return prediction scores.
2 Materials and methods
2.1 Participating methods
The initial panel of participants consisted of 6 methods: NN-align (version 2.2), NetMHCIIpan (version 3.1), Comblib, SMM-align (version 1.1), TEPITOPE and IEDB consensus. The first two methods are based on artificial neural networks (ANN), the following three are based on scoring matrices, and the IEDB consensus is a combination of several prediction methods. NetMHCIIpan-3.1 is the only pan-specific predictor in the panel, and can therefore be applied to a much larger number of MHC molecules than the other predictors (Table 1). NetMHCIIpan is hosted at DTU Bioinformatics, Technical University of Denmark, to demonstrate the ability to support external servers; while all other methods in the initial benchmark are hosted at the La Jolla Institute, USA.
Table 1.
Prediction methods participating in the initial benchmark
| Method | Type | MHCa | Short description | References |
|---|---|---|---|---|
| NN-align-2.2 | ANN | 27 | A neural network training procedure that simultaneously estimates the optimal peptide binding register and network weight configuration. | (Nielsen and Lund, 2009) |
| NetMHCIIpan-3.1 | ANN | 5625 | Pan-specific method that includes sequence information of the MHC molecule as training input. | (Nielsen et al., 2008; Andreatta et al., 2015) |
| Comblib | Matrix | 16 | Scoring matrices generated with positional scanning combinatorial libraries. | (Sidney et al., 2008) |
| SMM-align-1.1 | Matrix | 29 | Stabilized-matrix method optimized with a Monte Carlo heuristic. | (Nielsen et al., 2007) |
| TEPITOPE | Matrix | 51 | Profiles of binding preferences determined for the main HLA-DR binding pockets. | (Sturniolo et al., 1999) |
| IEDB consensus | Mixture | 67 | A combination of the predicted rank of several methods. | (Wang et al., 2008, 2010) |
Number of MHC molecules in the library of each method.
After the initial benchmark, other servers will be encouraged to enroll in the panel of participants. Data are sent to the participating servers with simple cURL requests, using either the GET or the POST request methods. The default format for a GET request is: curl‘<1>? peptide = <2>&allele = <3>’, where the three variable fields will be substituted with (i) the complete server URL; (ii) a comma-separated list of peptides; (iii) the MHC allele associated to the peptides. The benchmarking platform expects the servers to return predictions in a three-column format: MHC allele; peptide sequence; prediction value. Detailed instructions to join the benchmark, including templates to set up RESTful web services, are available at: http://tools.iedb.org/auto_bench/mhcii/join.
2.2 Criteria for inclusion of a data set
The platform checks during the weekly updates of the IEDB whether new references (RefID) that contain data suitable for the benchmark were added to the database. A single reference may contain several individual data sets. A data set consists of a number of data points from the same reference, restricted to the same MHC molecule and measured with the same assay type. Supported assay types are; IC50 (inhibitory concentration to displace 50% of a high affinity ligand), t1/2 (half-life of the binding interaction) and binary (positive or negative annotation from manually curated references). The IEDB captures data from publications accepted in peer-reviewed journal indexed in PubMed. Beyond that, it does not directly impose any additional quality filter. By breaking down the data submitted to the IEDB into individual data sets, we make the evaluation transparent so that researchers can disregard certain studies or assay types if they believe they are not reliable.
For a given allele and measurement type, a data set is benchmarked if there are at least 10 valid data points, of which at least 2 are positive and 2 are negative. The threshold to define positives was set to 500 nM for the IC50 data type and 120 min for half-lives. Valid peptides contain only standard amino acids and have lengths between 15 and 25 residues. The lower threshold on 15mers is due to several of the methods participating in the initial benchmark being limited to this hard-coded length, but we are planning to allow for shorter lengths down to 11 residues. New participants will be allowed to elect whether to evaluate queries in terms of overlapping 15mers, or directly on the full-length peptides. Because the main goal of the benchmark is to be able to compare multiple methods on the same evaluation data, it is performed only for MHC molecules that are included in the list of supported alleles of at least two methods.
2.3 Evaluation and performance measures
The predictive performance of the participating servers is evaluated in terms of Spearman rank correlation coefficient (SRCC) and area under the receiver-operating curve (AUC). The SRCC should satisfactorily represent the rank correlation between target and predicted values for quantitative measurements (IC50 and t1/2), whereas the AUC is probably more adequate to describe the categorical separation of binary data. Therefore, we opted to represent performance using both of these metrics.
Servers are assigned a relative rank score for each evaluated data set using the scheme previously described by Trolle et al. (2015). The best performing server receives a rank of one, the worst performing server a rank of zero, and all remaining servers are assigned scores evenly spaced between zero and one. For example, on a data set where six servers could generate predictions, they are assigned the ranks of 1, 0.8, 0.6, 0.4, 0.2 and 0. If only three methods could be applied to a data set, they will receive the ranks 1, 0.5 and 0. In case of ties, all methods with equal performance receive the highest rank score. Each server is assigned a rank score based on SRCC and a rank score based on AUC. Note that with this schema there is no penalty for servers with a limited library of MHC alleles; they will receive rank scores only for datasets where they can generate predictions.
An aggregate score, tracking the performance of the different methods through time, is calculated on the latest references added to the benchmark, and is updated every time new data are benchmarked. If five or more references are added in a given week, all of them are used to calculate the latest aggregate score. If less than five references are added to the weekly evaluation, the most recently evaluated references are also included to ensure that at least five references are comprised in the aggregate score.
3 Results
In summary, we have established an automated platform that (i) periodically queries the IEDB for new references, and examines if they contain suitable data for the MHC class II benchmark (see Materials and Methods); the identified datasets are then (ii) used to evaluate the prediction performance of the participating methods; the results of the evaluation are (iii) shown on a public webpage as soon as they become available. Figure 1 shows the basic workflow of the benchmarking procedure, and each of these steps is explained in more detail below.
Fig. 1.

Workflow of the automatic benchmarking platform. The program checks on a weekly basis whether new references were added in the Immune Epitope Database (IEDB); when a new reference is detected, it is split into homogenous data sets consisting of unique combinations of MHC allele and measurement type; sufficiently large data sets (at least 10 data points, of which at least two are positive and at least two are negative) are sent to the participating servers, independently of where they are hosted, through a standardized RESTful protocol; the predictions are retrieved from the servers; performance values in terms of SRCC and AUC are calculated for each participant; the servers are ranked from best to worst according to their performance values; the results of the evaluation, including aggregated scores over historical evaluations, are displayed on a web page publicly accessible online
3.1 Suitable references and data sets for the automated benchmark
The number of individual references and datasets (a single reference may contain multiple data sets) in the IEDB that pass the suitability criteria for the automated benchmark by year of publication are shown in Figure 2. With the exception of 2016, there have been consistently at least 20 data sets that satisfy the requirement for inclusion in the benchmark every year since 2005. As experimental methods become increasingly high-throughput with time, we observed that the cumulative number of data points in suitable references increased from about 10 000 in 2008 to over 70 000 in 2016 (Fig. 2B).
Fig. 2.

Amount of public data available for the benchmark. (A) Number of references and data sets that pass the criteria for inclusion in the benchmark by year of submission. (B) Cumulative number of MHC II binding data points in suitable data sets by year of submission
3.2 A benchmark on recent references (2014–2016)
The initial benchmark was performed on data submitted to the IEDB in the period 2014–2016. In this period of time, a total of 296 references containing MHC ligand assays were added to the IEDB. Filtering these references for supported MHC molecules, peptide lengths and measurement types identified 74 references with at least one data point. Out of these, 33 references contained 76 individual data sets with sufficient data for evaluation, covering 32 different MHC II molecules. However, only 17 of these MHCs were present in the library of at least two participating methods, reducing further the number of suitable datasets to 59, from 19 different references. The methods participating in the initial benchmark were evaluated on these 59 data sets, comprised of a total of 10 323 affinity measurements and ranging in size from 14 to 889 data points.
The results of the benchmark in terms of Spearman’s rank coefficient (SRCC) and Area under the ROC curve (AUC) are shown in Figure 3. The performance values are expected to be fair estimates of the participating methods performance as they were trained on data from 2013 or earlier. NetMHCIIpan appears to be the best performing method, with average SRCC = 0.566 and AUC = 0.835. NN-align also has respectable performance (SRCC = 0.519, AUC = 0.807), but can applied to a smaller subset of alleles than NetMHCIIpan. The IEDB consensus method, which combines predictions from several methods including Comblib, comes in third (SRCC = 0.454, AUC = 0.753), probably driven down by the very low performance of the combinatorial libraries (Comblib). SMM-align has comparable performance to the IEDB consensus method. TEPITOPE seems to perform well on some alleles but worse than random for several others. Complete performance values for all data sets and methods are listed in Supplementary Table S1.
Fig. 3.

Predictive performance of the methods participating in the 2014–2016 benchmark in terms of SRCC (A) and AUC (B). Each dot represents one data set, and the width of the silhouettes is proportional to the density of points at different values. Solid horizontal bars show the mean performance of each method (Color version of this figure is available at Bioinformatics online.)
As an alternative scheme of comparing the performance of the methods, they were ranked from best to worst in each of the 59 data sets included in the initial benchmark. The best performing server in terms of SRCC receives a rank of one, the worst performing server a rank of zero, and all remaining servers are assigned scores evenly spaced between zero and one (see Materials and methods). Ranks are only calculated for methods that contain the MHC molecule of the data set in their library; in this way, predictors are not penalized for not providing predictions for certain MHC molecules. NetMHCIIpan again outperforms the other participants according to this metric, reporting a rank R ≥ 0.8 for 38 out of 59 data sets, and R ≥ 0.6 for 46 data sets (Fig. 4A). The second-best method in terms of ranks is NNAlign, with R ≥ 0.8 for 19, and R ≥ 0.6 for 35 of the 53 data sets it was evaluated on. In contrast, SMM-align, TEPITOPE and Consensus IEDB reported R ≥ 0.8 for, respectively, seven, four and ten data sets; Comblib could produce predictions only for 24 MHC datasets, with R < 0.4 for 21 of them. Similar results were observed when the ranking was based on AUC scores (Fig. 4B), and when methods were compared pairwise on the subset of MHC molecules supported by each pair of predictors (Fig. 4C).
Fig. 4.

Relative ranks of the methods participating in the 2014–2016 benchmark. For each dataset, all methods are ranked based on SRCC (A) and AUC (B). The best performing server in terms of SRCC receives a rank of one, the worst performing server a rank of zero, and all remaining servers are assigned scores evenly spaced between zero and one. Ranks are binned in five intervals of equal size for the barplots. Servers are sorted from left to right based on the size of their top quintile. (C) Pairwise performance comparison of the methods on the subset of datasets shared by each pair. For each element M[x][y] in the heatmap, the cell is colored by the fraction of data sets for which method x outperforms method y (top of the diagonal in terms of SRCC, bottom of the diagonal in terms of AUC); ties are counted as 0.5. Values on the diagonal represent the total number of datasets in the 2014–2016 benchmark that can be evaluated by each method
For the best performing method NetMHCIIpan, we aimed to quantify the overlap between the data used to train the method and the data evaluated by the benchmark. For each benchmarked peptide, we calculated the edit distance to its nearest neighbor in the NetMHCpan training set. The edit distance here is the minimal number of substitutions or terminal extensions required to mutate a peptide in the evaluation set into the most similar peptide in the training set, restricted to the same MHC molecule. Of the 76 data sets with sufficient data for evaluation in the period 2014–2016, 21 covered MHC molecules not included in the NetMHCIIpan training sets, and accounted for 54% of the evaluation data. In the remaining 55 data sets, only a negligible fraction of peptides consisted of exact hits to training points (0.15%), while the majority of evaluated peptides had an edit distance ≥ 10 (Fig. 5). The average edit distance per evaluated data set did correlate poorly with the SRCC performance of NetMHCIIpan (PCC = −0.11, SRCC = −0.12). These results show a very limited overlap between training data and the benchmarked data sets, and confirm the general unbiasedness of the benchmark.
Fig. 5.
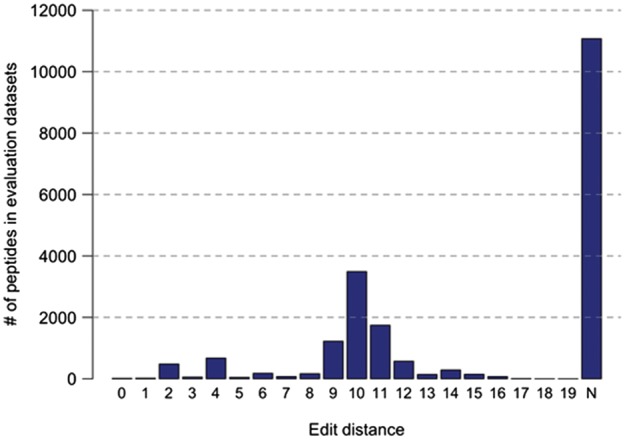
Edit distance between peptides evaluated by the benchmark and the data used to train NetMHCIIpan. The edit distance is the minimal number of substitutions or terminal extensions required to mutate a peptide in the evaluation set into the most similar peptide in the training set, restricted to the same MHC molecule. The bar labeled with N identifies benchmarked peptides restricted to MHC molecules not present in the training data
3.3 Weekly IEDB benchmark and live results
Server rankings are updated each time a sufficiently large set of data is submitted to the IEDB and benchmarked by the automated pipeline. Live, up-to-date performance evaluations of the participating methods can be found on the IEDB Analysis Resource at: http://tools.iedb.org/auto_bench/mhcii/weekly/.
The page reports weekly ranking scores (listing ranking scores for all weeks with new references), and an aggregate score that tracks performance of the servers through time (Fig. 6). Clicking on individual weekly entries reveals detailed information on the references and data set that were evaluated, as well as performance values in AUC and SRCC. The user can access the complete data sets evaluated through the weeks of the benchmark and inspect the prediction scores assigned by each server to individual peptide-MHCs in a given data set. Since the release of the benchmarking platform on January 1, 2017, three sufficiently large references (grouped in two weeks) were identified by the platform and benchmarked. They are displayed as two new entries in the weekly ranking tables, and triggered updated aggregate scores for each participating server.
Fig. 6.

The online webpage of the automated MHC class II prediction benchmark. Clicking on individual weekly entries shows detailed information on the data sets evaluated in that time period
4 Discussion
It is generally accepted that peptide-MHC II binding is more difficult to predict compared to binding to MHC class I. This is due at least in part to the structure of the MHC class II binding groove, open at both ends and allowing binding of long peptides extending out of the ends of the groove. While MHC I ligands have a very limited range of length (typically 9mers), MHC II ligands can have a large spectrum of length and need to be correctly aligned before the basic binding motif can be identified (Nielsen et al., 2010). Several computational methods have been developed to predict peptide-MHC binding in silico, but it is not always clear how accurate these algorithms are, and which one is optimal for a given problem.
In this work, we set out to design a platform for the automatic, transparent and timely benchmark of prediction methods for peptide-MHC II binding. Because the participating methods are evaluated on data newly entered into the IEDB before it is made publicly available, the comparison between the methods should be fair and unbiased. The benchmark runs continuously, querying the database for new references on a weekly basis. Whenever a new data set is encountered, the methods are evaluated and their performance is displayed publicly on a website, both in terms of performance on individual data sets as well as a cumulative score over historical submissions. In this way, any potential user can track the performance of the different methods through time and MHC molecules, and make an informed decision as to which tool is more appropriate for a given task.
In the initial benchmark, we chose to start with six widely used prediction methods included in the IEDB Analysis Resource (Fleri et al., 2017). Many other methods exist, and they will be invited to join the benchmark as participants. The conditions for enrollment are minimal, and require from the participants only to host a simple RESTful web service, for which we also provide templates and examples. On a benchmarking period spanning 3 years (2014–2016), NetMHCIIpan appeared to be the best-performing method in the initial panel of predictors according to several metrics, followed by NNAlign, and thirdly by the IEDB Consensus and SMM-align with comparable performance. In light of these results, we have decided to switch the method recommended by the IEDB from ‘Consensus’ to NetMHCIIpan.
It is evident that even for the best methods the predictive performance may vary substantially between different data sets (Fig. 3). Some data sets may be more difficult to predict, either because they contain subtler differences between positives and negatives (Kim et al., 2014), or because a given molecule is not well characterized, or simply because the data are more noisy. In this sense, rank scores offer a complementary metric for method evaluation, as performances are compared in relative as opposed to absolute terms. For example, an AUC of 0.7 may put a method on the top of the list in terms of relative ranks for a difficult data set where all other methods have inferior performance, while the same AUC may inflict a rank of zero for an ‘easy’ data set where all other methods have higher performance. Ranks are very useful to compare different methods relative to each other, but they should always be interpreted in terms of absolute performance to evaluate their utility.
A possible limitation of the initial benchmark was that it required that a data set could be evaluated by at least two methods in the panel. With the exception of NetMHCIIpan, which covers several thousand alleles, all the other methods have relatively small libraries of MHC II alleles (Table 1). Therefore, 17 out of 76 sufficiently large data sets had to be excluded from the benchmark because they could only be evaluated by a single method, typically NetMHCIIpan. This filter effectively removed nearly all molecules outside HLA-DR, with only one HLA-DQ data set that could be evaluated by at least two methods. We expect that as more servers are added to the benchmark, in particular pan-specific algorithms with large allele libraries, we will be able to evaluate a larger and more diverse set of data.
Another practical issue concerns the way peptides are presented to the participating methods for prediction. In the initial benchmark we chose to set a minimum peptide length of 15 amino acids, and represent longer peptides in the form of overlapping 15mers. The prediction score for a given sequence was then taken as the score of its highest overlapping 15mer. This design was imposed by the limitation that several participating methods only made predictions for 15mer peptides, and we wanted to apply the same approach to all methods in order to make the benchmark as uniform as possible. To test whether this could be a limitation, we applied NetMHCIIpan to the same data sets in the benchmark but omitting the digestion into overlapping 15mers; the AUC of the method presented with full-length sequences was not significantly different from the AUC of the method fed with overlapping 15mers (p = 0.37, binomial test excluding ties), suggesting that this aspect may not be critical. However, when new servers apply for enrollment in the benchmark, they will be given the option to choose whether they should receive full-length peptides or overlapping 15mers for evaluation, and we plan to evaluate the ability to directly predict peptides of any length in the future.
Ultimately, the goal of peptide-MHC binding prediction is to identify peptides with immunogenic potential. However, binding affinity alone cannot fully explain MHC presentation and T cell activation, and the performance of algorithms trained solely on binding affinity remains limited for the prediction of T cell epitopes (Mazor et al., 2015). Recent advances in proteomics and mass-spectrometry hold great promise for overcoming these limitations. These techniques provide a large and relatively unbiased sampling of the population of peptides available for T cell recognition, accounting not only for binding to the MHC II but also for processing and presentation to the cell surface (Caron et al., 2015; Mommen et al., 2016). As these techniques mature and become more accurate, they provide a tantalizing opportunity to improve T cell epitope prediction methods by integrating naturally presented ligands in their training pipelines.
The benchmarking platform for peptide binding prediction to MHC class II described here extends our previous work for MHC class I binding predictions. In future work, we plan to extend this automated benchmarking approach to other important problems in immunoinformatics, including prediction of naturally eluted ligands and T cell epitopes, as well as the evaluation of prediction methods for B cell epitopes.
Funding
This study was supported with Federal funds from the National Institutes of Allergy and Infectious Diseases, National Institutes of Health, Department of Health and Human Services, under Contract No. HHSN272201200010C. M.N. is a researcher at the Argentinean national research council (CONICET).
Conflict of Interest: none declared.
Supplementary Material
References
- Andreatta M. et al. (2015) Accurate pan-specific prediction of peptide-MHC class II binding affinity with improved binding core identification. Immunogenetics, 67, 641–650.26416257 [Google Scholar]
- Blum J.S. et al. (2013) Pathways of antigen processing. Annu. Rev. Immunol., 31, 443–473. [DOI] [PMC free article] [PubMed] [Google Scholar]
- Bui H.-H. et al. (2005) Automated generation and evaluation of specific MHC binding predictive tools: ARB matrix applications. Immunogenetics, 57, 304–314. [DOI] [PubMed] [Google Scholar]
- Caron E. et al. (2015) Analysis of MHC immunopeptidomes using mass spectrometry. Mol. Cell. Proteomics, 14, 3105–3117. [DOI] [PMC free article] [PubMed]
- Dhanda S.K. et al. (2016) Novel in silico tools for designing peptide-based subunit vaccines and immunotherapeutics. Brief. Bioinform., 18, 467–478. [DOI] [PubMed]
- Doytchinova I.A., Flower D.R. (2003) Towards the in silico identification of class II restricted T-cell epitopes: a partial least squares iterative self-consistent algorithm for affinity prediction. Bioinformatics, 19, 2263–2270. [DOI] [PubMed] [Google Scholar]
- Fleri W. et al. (2017) The immune epitope database and analysis resource in epitope discovery and synthetic vaccine design. Front. Immunol., 8, 278. [DOI] [PMC free article] [PubMed] [Google Scholar]
- Justesen S. et al. (2009) Functional recombinant MHC class II molecules and high-throughput peptide-binding assays. Immunome Res., 5, 2. [DOI] [PMC free article] [PubMed] [Google Scholar]
- Kim Y. et al. (2014) Dataset size and composition impact the reliability of performance benchmarks for peptide-MHC binding predictions. BMC Bioinformatics, 15, 241. [DOI] [PMC free article] [PubMed] [Google Scholar]
- Lin H.H. et al. (2008) Evaluation of MHC-II peptide binding prediction servers: applications for vaccine research. BMC Bioinformatics, 9, S22.. [DOI] [PMC free article] [PubMed] [Google Scholar]
- Mazor R. et al. (2015) Poor correlation between T-cell activation assays and HLA-DR binding prediction algorithms in an immunogenic fragment of Pseudomonas exotoxin A. J. Immunol. Methods, 425, 10–20. [DOI] [PMC free article] [PubMed] [Google Scholar]
- Mommen G.P.M. et al. (2016) Sampling from the proteome to the human leukocyte antigen-DR (HLA-DR) ligandome proceeds via high specificity. Mol. Cell. Proteomics, 15, 1412–1423. [DOI] [PMC free article] [PubMed] [Google Scholar]
- Nielsen M. et al. (2010) MHC class II epitope predictive algorithms. Immunology, 130, 319–328. [DOI] [PMC free article] [PubMed] [Google Scholar]
- Nielsen M. et al. (2007) Prediction of MHC class II binding affinity using SMM-align, a novel stabilization matrix alignment method. BMC Bioinformatics, 8, 238. [DOI] [PMC free article] [PubMed] [Google Scholar]
- Nielsen M. et al. (2008) Quantitative predictions of peptide binding to any HLA-DR molecule of known sequence: NetMHCIIpan. PLoS Comput. Biol., 4, e1000107.. [DOI] [PMC free article] [PubMed] [Google Scholar]
- Nielsen M., Lund O. (2009) NN-align. An artificial neural network-based alignment algorithm for MHC class II peptide binding prediction. BMC Bioinformatics, 10, 296.. [DOI] [PMC free article] [PubMed] [Google Scholar]
- Sidney J. et al. (2008) Quantitative peptide binding motifs for 19 human and mouse MHC class I molecules derived using positional scanning combinatorial peptide libraries. Immunome Res., 4, 2.. [DOI] [PMC free article] [PubMed] [Google Scholar]
- Sturniolo T. et al. (1999) Generation of tissue-specific and promiscuous HLA ligand databases using DNA microarrays and virtual HLA class II matrices. Nat. Biotechnol., 17, 555–561. [DOI] [PubMed] [Google Scholar]
- Trolle T. et al. (2015) Automated benchmarking of peptide-MHC class I binding predictions. Bioinformatics, 31, 2174–2181. [DOI] [PMC free article] [PubMed] [Google Scholar]
- Vita R. et al. (2015) The immune epitope database (IEDB) 3.0. Nucleic Acids Res., 43, D405–4D412. [DOI] [PMC free article] [PubMed] [Google Scholar]
- Wan J. et al. (2006) SVRMHC prediction server for MHC-binding peptides. BMC Bioinformatics, 7, 463.. [DOI] [PMC free article] [PubMed] [Google Scholar]
- Wang P. et al. (2008) A systematic assessment of MHC class II peptide binding predictions and evaluation of a consensus approach. PLoS Comput. Biol., 4, e1000048.. [DOI] [PMC free article] [PubMed] [Google Scholar]
- Wang P. et al. (2010) Peptide binding predictions for HLA DR, DP and DQ molecules. BMC Bioinformatics, 11, 568.. [DOI] [PMC free article] [PubMed] [Google Scholar]
- Zhang L. et al. (2012) TEPITOPEpan: extending TEPITOPE for peptide binding prediction covering over 700 HLA-DR molecules. PLoS One, 7, e30483. [DOI] [PMC free article] [PubMed] [Google Scholar]
Associated Data
This section collects any data citations, data availability statements, or supplementary materials included in this article.