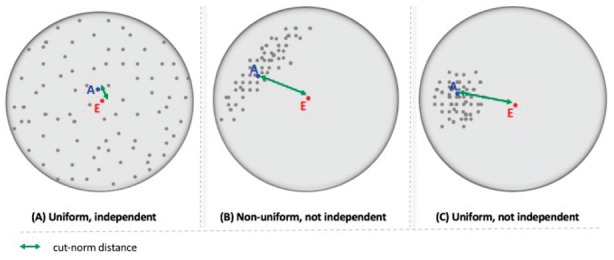
Fig. 1.

An illustrative view of graph sampling strategy outcomes in terms of uniformity and independence. Each gray circle represents a hypothetical sample space of a graph. Sampled graphs which are the outcome of a hypothetical graph sampling strategy are represented as gray dots inside the sample space of all graphs with the prescribed in and out-degrees. The point A represents the sample average and the point E represents the centroid or true average of sample space. The distance (here characterized with the cut norm) between A and E indicates the degree of uniformity and independence of a produced sample. The further away A is from E, the more confident one can be that points are not sampled uniformly and independently
