Abstract
The insulin-like growth factor 1 receptor (IGF1R) is a receptor tyrosine kinase with critical roles in various biological processes. Recent results from clinical trials targeting IGF1R indicate that IGF1R signaling pathways are more complex than previously thought. Moreover, it has become increasingly clear that the function of many proteins can be understood only in the context of a network of interactions. To that end, we sought to profile IGF1R–protein interactions with the proximity-labeling technique BioID. We applied BioID by generating a HEK293A cell line that stably expressed the BirA* biotin ligase fused to the IGF1R. Following stimulation by IGF1, biotinylated proteins were analyzed by MS. This screen identified both known and previously unknown interactors of IGF1R. One of the novel interactors was sorting nexin 6 (SNX6), a protein that forms part of the retromer complex, which is involved in intracellular protein sorting. Using co-immunoprecipitation, we confirmed that IGF1R and SNX6 physically interact. SNX6 knockdown resulted in a dramatic diminution of IGF1-mediated ERK1/2 phosphorylation, but did not affect IGF1R internalization. Bioluminescence resonance energy transfer experiments indicated that the SNX6 knockdown perturbed the association between IGF1R and the key adaptor proteins insulin receptor substrate 1 (IRS1) and SHC adaptor protein 1 (SHC1). Intriguingly, even in the absence of stimuli, SNX6 overexpression significantly increased Akt phosphorylation. Our study confirms the utility of proximity-labeling methods, such as BioID, to screen for interactors of cell-surface receptors and has uncovered a role of one of these interactors, SNX6, in the IGF1R signaling cascade.
Keywords: growth factor, cell signaling, Akt PKB, extracellular-signal-regulated kinase (ERK), insulin-like growth factor (IGF), BioID, IGF1R, retromer, SNX6
Introduction
The insulin-like growth factor 1 receptor (IGF1R)3 is a receptor tyrosine kinase (RTK) that plays a critical role in many biological processes such as proliferation (1), lifespan (2), and muscle growth (3). Due to the importance of these biological processes therapeutic modulation of the IGF1R has attracted much interest. To date, therapeutic modulation of the IGF1R has been tested in various disease settings, including heart failure (4), muscular dystrophy (5), cachexia (6), and cancer (7). Results from clinical trials targeting the IGF1R indicate that IGF1R signaling pathways are more complex than previously thought and that the classical model of IGF1R signaling needs updating (7–10).
Receptors function through interactions with other proteins. Classical methods for identifying novel protein interactions, such as affinity purification and yeast two-hybrid, have provided much important information (11, 12). However, it is commonly accepted that the classical methods have limitations that preclude identification of many physiologically relevant protein–protein interactions (13, 14). The main limitations of these classical methods are an inability to detect weak or transient interactions and the expression of proteins in a non-native context. Recently, the challenge of identifying novel protein interactions has been addressed by proximity-dependent labeling. In proximity-dependent labeling, the protein of interest is expressed as a fusion with a modifying enzyme, which covalently attaches a tag on proximal and interacting proteins, allowing for their identification by MS. Current proximity-dependent labeling techniques include tyramide (15), ascorbate peroxidase (APEX) (16, 17), and proximity-dependent biotin identification (BioID) (14). Proximity-dependent labeling techniques such as BioID have been making a major impact on our understanding of protein interaction networks (14, 18–24). Despite their obvious strengths, no proximity-labeling technique has been employed to identify novel interactions with an RTK such as the IGF1R.
Here, we utilized the proximity-labeling technique BioID to identify novel protein interactions with the IGF1R. This approach identified sorting nexin 6 (SNX6), a protein that plays an important role in intracellular protein sorting, as a novel interactor of the IGF1R. This physical association was confirmed by co-immunoprecipitation. We demonstrated that reduction in SNX6 levels resulted in a specific decrease in IGF1-induced ERK1/2, but not Akt, phosphorylation. Reduced SNX6 expression also inhibited the association between IGF1R and its key signaling adaptors, IRS1 and SHC1. Intriguingly, overexpression of SNX6 induced a significant increase in Akt phosphorylation. In summary, using a proximity-labeling technique we have discovered that the protein SNX6 plays an important role in regulating IGF1R signaling.
Results
BioID for the identification of novel IGF1R interactors
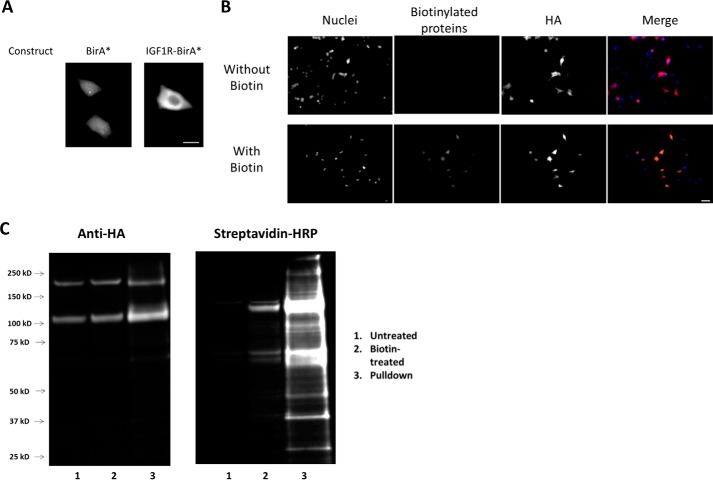
Our aim was to identify novel IGF1R interactors to further understand IGF1R signaling. To that end, we employed the proximity-dependent labeling technique BioID. We first generated a stable cell line that constitutively expressed the IGF1R as a fusion with BirA* (IGF1R–BirA*). To validate our stable cell line, we first performed immunofluorescence. IGF1R-BirA* was expressed largely at the plasma membrane, as is the case for native IGF1R (Fig. 1A). In contrast, cells expressing the BirA* construct showed uniform expression across the cell (Fig. 1A). Immunostaining also indicated robust biotinylation of vicinal proteins in the presence of biotin indicating that the BirA* within the IGF1–BirA* fusion was functional (Fig. 1B). Immunoblotting confirmed expression of the fusion construct at the expected molecular weight as well as efficient biotinylation of a number of proteins (Fig. 1C).
Figure 1.
Validation of the IGF1R–BirA* construct. A, cells were transiently transfected with either BirA* or the IGF1R–BirA* construct. Staining with an anti-HA antibody shows uniform distribution for BirA* and plasma membrane-localized distribution of IGF1R–BirA*. Scale bar = 20 μm. B, cells that had taken up the IGF1R–BirA* construct (as indicated by positive HA staining) also displayed a high degree of protein biotinylation only when supplied with biotin. Scale bar = 50 μm. C, we confirmed our immunofluorescence results by immunoblot. Two distinct bands corresponding to the two forms of IGF1R (pre-mature and mature) can be seen in the first blot. Biotinylation was observed only in the presence of biotin. The third lane of the second blot indicates successful pulldown of a range of biotinylated proteins.
Following validation, we used the IGF1R–BirA* cell line to identify novel interactors of the IGF1R. This cell line was also used for all subsequent experiments.
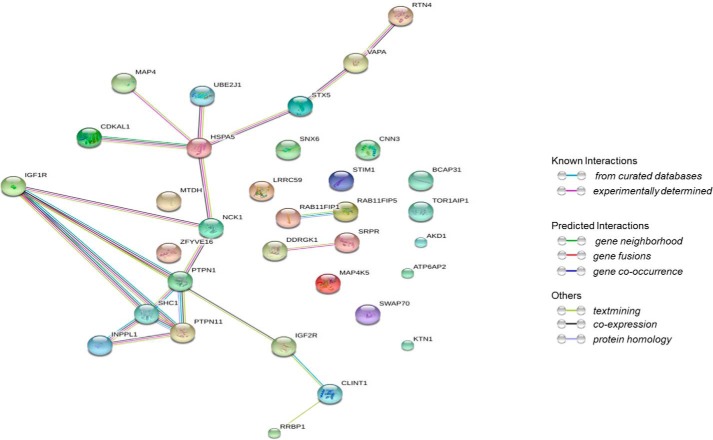
These cells were exposed to vehicle or 100 nm IGF1, as well as an excess amount of biotin. Following treatment for 16 h, cells were lysed and streptavidin-conjugated beads were used to isolate biotinylated proteins. The identity of the biotinylated proteins was determined by LC-MS/MS. As shown in Table 1 we identified many of the previously known interactors of the IGF1R (see supporting Table 1 for additional detail). Using the STRING database, we generated an interaction network. Underscoring the power of the proximity-dependent labeling approach to identify protein interaction networks we identified not only known direct interactors of IGF1R but also proteins that interact with these interactors (Fig. 2).
Table 1.
List of proteins that were found to be significantly associated with the activated IGF1R
Criteria for inclusion were a 2-fold cutoff (IGF1 versus NT) and p-value < 0.05 (two-tailed heteroscedastic t test). “NT” = “No Treatment”.
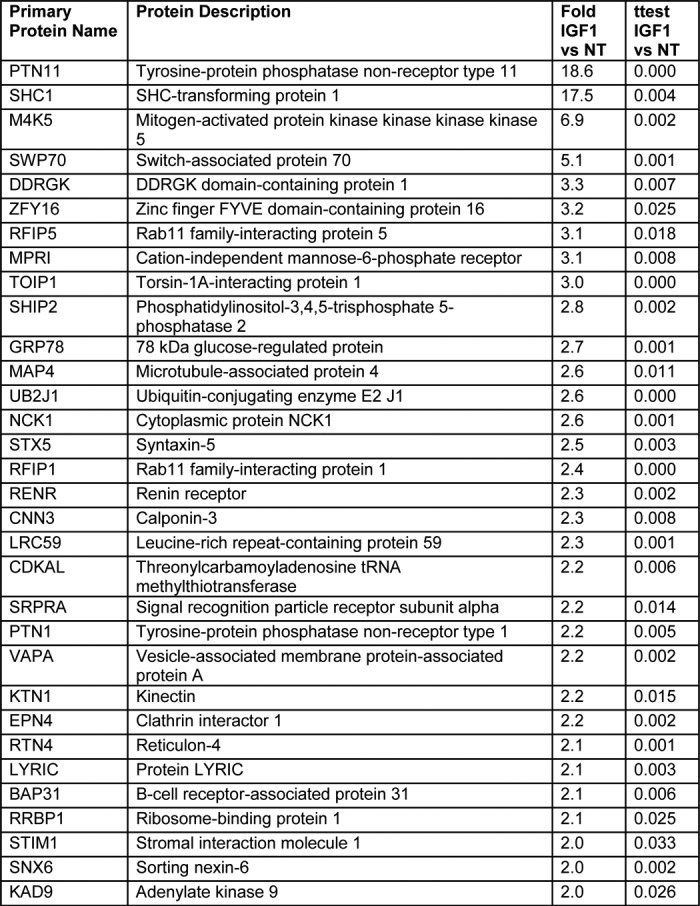
Figure 2.
Known and predicted interactions between the proteins in Table 1 according to the STRING database.
The BioID screen identified a number of novel IGF1R interactors (STX5, VAPA, EPN4, RFIP5, RFIP1, and SNX6) that are involved in the movement of proteins between various cellular compartments. We chose to focus on sorting nexin 6 (SNX6), a key component of the retromer complex (25), as the mechanisms that control IGF1R trafficking, and its effect on IGF1R signaling, are unclear.
Confirmation of physical association between IGF1R and SNX6
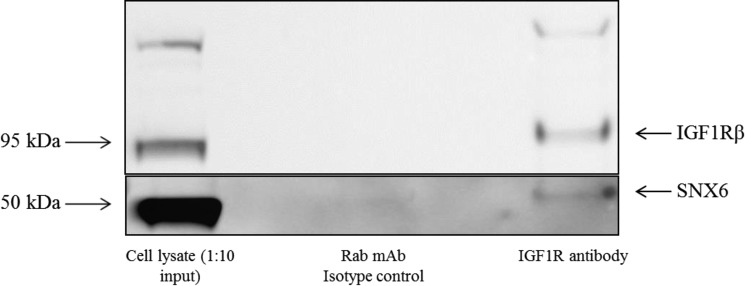
To confirm the physical interaction between activated IGF1R and SNX6, we performed co-immunoprecipitation on cells treated with IGF1, using an anti-IGF1Rβ antibody for pulldown. A distinct band corresponding to SNX6 was observed (Fig. 3), confirming association between this protein and the receptor.
Figure 3.
Co-immunoprecipitation confirms physical interaction of IGF1R and SNX6. Pulldown was performed with either isotype control or anti-IGF1Rβ antibody, followed by immunoblot with an anti-SNX6 antibody or an anti-IGF1Rβ antibody, as indicated. A distinct band corresponding to SNX6 can be seen for the IGF1Rβ pulldown lane. This blot is representative of three independent experiments.
SNX6 knockdown perturbs IGF1R signaling but does not interfere with recycling dynamics
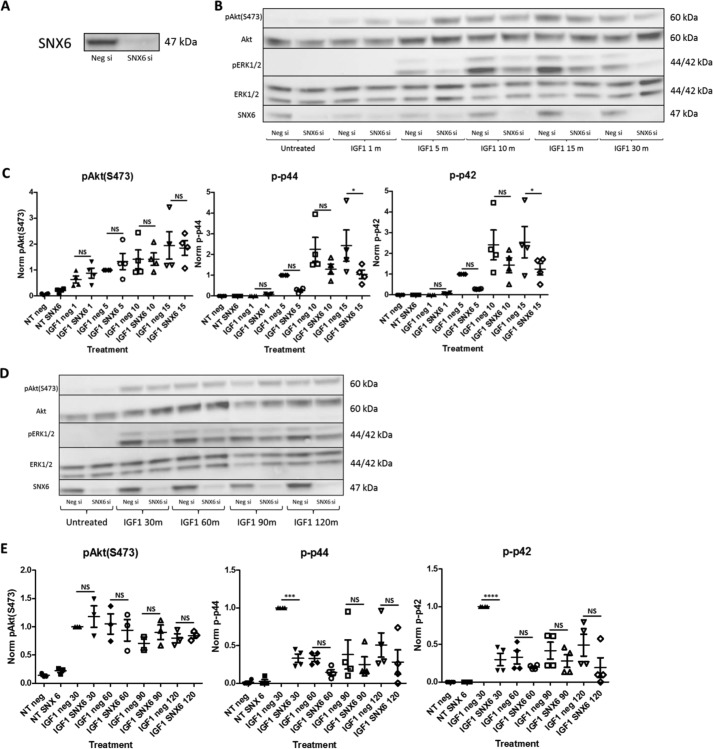
To evaluate the contribution of SNX6 to IGF1R signaling, we initially performed siRNA-mediated knockdown of SNX6. Knockdown of SNX6 was robust (Fig. 4A). Importantly, SNX6 knockdown resulted in a significant diminution of IGF1-induced ERK1/2 phosphorylation 15 and 30 min following the addition of the ligand (Fig. 4, B–E). A similar trend was also noted for later time points but did not reach significance. Intriguingly, SNX6 knockdown did not result in a similar decrease in Akt phosphorylation.
Figure 4.
SNX6 knockdown impairs IGF1R signaling. A, a representative blot showing robust siRNA-mediated knockdown of SNX6. B, representative blot showing that SNX6 knockdown inhibited IGF1-induced phosphorylation of ERK1/2, whereas having no significant effect on IGF1-induced Akt phosphorylation. C, quantification of bands in B. D, a representative blot highlighting a similar trend for later treatment times. E, quantification of bands in D. One-way analysis of variance was performed followed by Bonferroni's Multiple Comparison Test, 0.0001 < ****, p < 0.001; ***, p < 0.001; *, p < 0.05. n = 3–4.
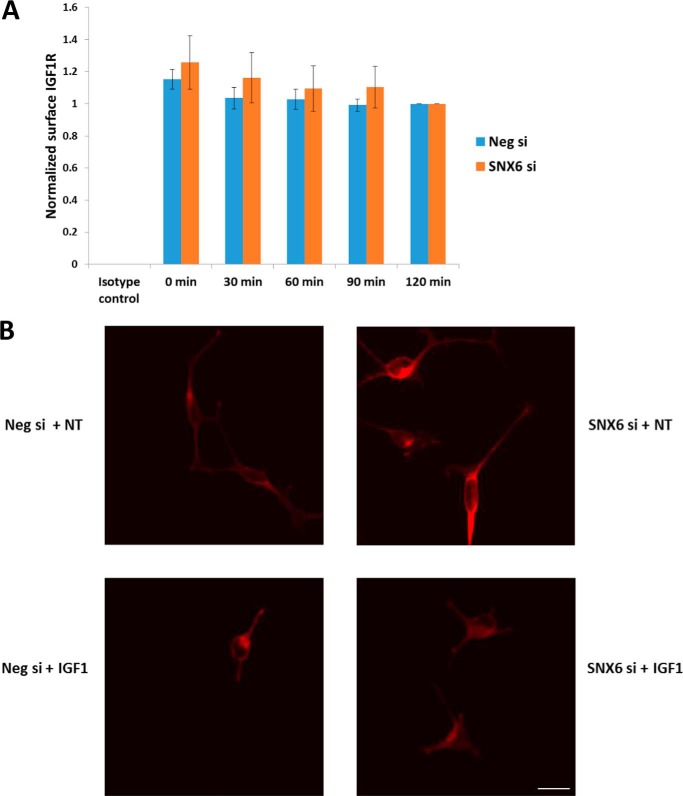
We then assessed the effects of SNX6 knockdown on IGF1R internalization/recycling dynamics following IGF1 stimulation. A steady decrease in the relative amount of cell-surface IGF1R was observed following IGF1 treatment, as expected. SNX6 knockdown did not have a significant effect on the level of IGF1R internalization (Fig. 5A). In agreement with these results, there was no observable difference in the distribution of IGF1R between control and SNX6 knockdown cells (Fig. 5B).
Figure 5.
SNX6 knockdown does not alter IGF1R internalization dynamics or cellular distribution. A, IGF1-induced IGF1R internalization was evaluated by flow cytometry. One-way analysis of variance revealed no significant differences in the extent of internalization as a result of SNX6 knockdown at any of the time points tested. All data were normalized to the 120 min values. n = 5. B, immunofluorescence was performed using an anti-HA antibody to visualize IGF1R distribution (red). This experiment was performed three times. Scale bar = 50 μm.
SNX6 knockdown suppresses recruitment of IRS1 and SHC1 to IGF1R
To understand how SNX6 knockdown perturbs IGF1R signaling, we performed BRET assays to quantify the level of recruitment of the key signaling proteins, IRS1 and SHC1, to IGF1R in control and SNX6 knockdown cells. A clear suppression of IGF1-induced association of IGF1R and IRS1 or SHC1 can be seen in the case of SNX6 knockdown compared with control cells (Fig. 6).
Figure 6.
Quantification of association between IGF1R and selected adaptor proteins by BRET. Data are expressed as the BRET values for the IGF1-treated samples divided by the BRET values for the vehicle-treated samples. Linear lines-of-best-fit were included to highlight trends. Clear depression of association between IGF1R and IRS1, and between IGF1R and SHC1 can be seen in the case of SNX6 knockdown. Data points represent means of five independent experiments.
SNX6 overexpression promotes Akt phosphorylation in the absence of IGF1R stimulation
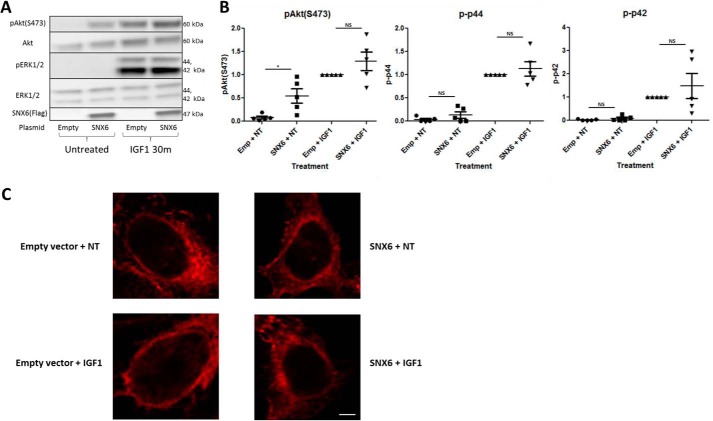
We next decided to assess the effects of increasing SNX6 protein levels on IGF1R signaling. Over-expression of SNX6 had no significant effect on IGF1-stimulated ERK1/2 or Akt phosphorylation (Fig. 7, A and B). Of note, SNX6 over-expression resulted in a pronounced increase in Akt phosphorylation even in the absence of any ligand. This level of Akt phosphorylation was comparable with the level induced by IGF1 itself (Fig. 7, A and B). A similar effect on ERK1/2 phosphorylation was not observed (Fig. 7, A and B).
Figure 7.
SNX6 overexpression promotes Akt phosphorylation without affecting IGF1R distribution. A, SNX6 overexpression promoted a significant increase in Akt phosphorylation in the absence of any other treatment. It also promoted a slight increase in IGF1-induced Akt phosphorylation, however, this increase was not significant. B, quantification of bands in A. One-way analysis of variance was performed followed by Bonferroni's Multiple Comparison Test. *, p < 0.05, n = 5. C, immunofluorescence was performed using an anti-HA antibody to visualize IGF1R distribution (red). SNX6 overexpression did not seem to have a noticeable effect on the distribution of IGF1R. This experiment was performed three times. Scale bar = 5 μm.
SNX6 overexpression has no effect on IGF1R distribution in the cell
Finally, we chose to assess the effects of increased SNX6 protein levels on the cellular distribution of IGF1R. We observed no obvious effects of increased SNX6 protein levels on the distribution of IGF1R in the cell in the basal state or following IGF1 stimulation (Fig. 7C).
Discussion
Recent advances in proteomics have enabled a finer dissection of both the insulin and IGF1 signaling pathways. For example, quantitative phosphoproteomic analysis has been used to identify novel participants in the insulin (and likely IGF1) signaling pathway (26). This type of analysis has even been used to quantify changes in the phosphorylation of IGF1R itself (27). Temporal proteomic analysis has revealed that IGF1 treatment over time promotes the production of proteins associated with vesicle trafficking, glycolysis, and cell stress, functions that have been associated with cancer cell proliferation (28). In addition to being used to analyze cell signaling events, proteomics has also been used to identify proteins that interact with the IGF1R and its adaptors (29). Classical approaches for the identification of protein interactions have several limitations that preclude identification of many biologically important interactions. This barrier has been overcome by proximity-dependent labeling methodologies. To enable a more comprehensive characterization of the IGF1R interactome, one that includes weak, indirect, or transient interactors, we made use of the proximity-labeling method known as BioID.
BioID has been extensively used to define interaction networks for a number of proteins and subcellular regions (reviewed in Ref. 30). APEX is an example of another popular proximity-labeling method that has been used for similar studies (16). To our knowledge there have been only two published studies that have used this approach to define the interactome of cell-surface receptors (31, 32), and in both cases G protein–coupled receptors were the subject of these studies. In this paper we describe the first use of a proximity-labeling method to characterize the interactome of a receptor tyrosine kinase.
Our screen yielded a number of well-established interactors of the activated IGF1R, such SHC1 and PTPN11. These findings underscore the validity of the BioID technique to define the complete IGF1R interactome. One of the novel candidates we identified was SNX6. SNX proteins have been shown to play roles in the recycling and signaling events of a number of cell-surface receptors (33). There are very few published studies on the role of SNX proteins in RTK signaling and function. However, there is one study that links SNX6 with the insulin receptor, a receptor that is very similar to IGF1R (34). Given this information, we chose to further examine the role of SNX6 in IGF1R signaling and function.
We confirmed physical interaction between IGF1R and SNX6 by co-immunoprecipitation. We then showed that SNX6 knockdown resulted in a diminution of IGF1-induced ERK1/2 phosphorylation. A possible explanation for this observation could be that SNX6 knockdown interferes with IGF1-induced IGF1R internalization, which is necessary for the activation of the ERK1/2 pathway (35). However, we found that the internalization dynamics were not significantly perturbed by SNX6 knockdown.
To achieve a mechanistic understanding of how SNX6 knockdown perturbs IGF1R signaling, we performed BRET to quantify recruitment of the key signaling adaptor proteins, IRS1 and SHC1, to IGF1R. We found that knocking down SNX6 inhibited the association between IGF1R and both IRS1 and SHC1. Although this would explain why IGF1-induced ERK1/2 phosphorylation is diminished in SNX6 knockdown cells, as both IRS1 and SHC1 recruitment promote downstream ERK1/2 phosphorylation, it does not explain why we did not see any effect on Akt phosphorylation. Perhaps Akt phosphorylation requires only a modest level of IGF1R activation. Alternatively, there might be compensation by the closely-related IRS2 isoform, as these two proteins have both been shown to promote Akt phosphorylation (36).
Conversely, SNX6 overexpression had no significant effect on either IGF1-induced ERK1/2 or Akt phosphorylation. Intriguingly, SNX6 overexpression alone resulted in a significant increase in Akt phosphorylation, which was comparable with the level of phosphorylation induced by IGF1.
A recent study showed that blocking IGF1R internalization inhibited both Akt and ERK1/2 phosphorylation; leading the authors to conclude that much of IGF1R signaling takes place at the endosome (37). SNX6 is associated with the early endosome (25) presumably by binding of its PX domain to phosphatidylinositol 3-phosphate, which is the most abundant phosphoinositide in the early endosome membrane (38). Both Akt (39) and ERK1/2 (40) have also been shown to signal from the early endosome. Therefore, SNX6 might promote the association of IGF1R with the early endosomal compartment where it will be in close proximity to members of its signaling cascade, including Akt and ERK1/2. This might also serve to explain why we saw an increase in Akt as a result of SNX6 overexpression even in the absence of IGF1 treatment. Perhaps SNX6 overexpression enhances the association of IGF1R with the early endosome. This would serve to (a) bring IGF1R in close proximity to its substrate proteins and (b) draw it away from the degradative lysosomal pathway. Therefore, the effects of even low levels of basal IGF1R kinase activity would be amplified. To test these hypotheses, it would be instructive to measure the effects of SNX6 overexpression on the occupancy (both in terms of quantity and time spent) of IGF1R, Akt, and ERK1/2 in the early endosome.
In summary, the data presented here confirm the utility of using proximity-labeling methods, such as BioID, to identify novel interactors of a cell-surface receptor. Importantly, we have validated the role of SNX6 as a novel mediator of IGF1R function; revealing a hitherto unknown link between SNX/retromer and IGF1R signaling. In addition to its biological significance, this finding also presents an additional target for the therapeutic modulation of IGF1R signaling.
Experimental procedures
BioID principle
BioID was originally developed by Dr. Kyle Roux (14) and makes use of a promiscuous biotin ligase known as BirA*; a mutated version of the BirA ligase. BirA catalyzes a two-step reaction in the presence of biotin. In the first step, BirA combines biotin and AMP to produce biotinoyl-5′-AMP (bioAMP); an activated form of biotin. This activated biotin is retained by BirA in its active site until it comes into contact with a specific lysine residue in a minimal recognition sequence known as the biotin acceptor tag. BirA* also produces the activated biotin bioAMP. However, BirA* does not retain bioAMP in its active site. Instead, BirA* prematurely releases the bioAMP; where it reacts with primary amines of adjacent proteins. This property of BirA* is harnessed in the BioID technique by fusing it with a protein of interest.
BioID construct and generation of the IGF1R–BirA* stable cell line
To generate the IGF1R–BirA* construct, the coding region of human IGF1R (IGF1R; GenBank accession no. NM_000875) minus the stop codon was subcloned into the pcDNA3.1 MCS-BirA(R118G)-HA plasmid (Addgene) such that BirA* was expressed on the C-terminal (cytoplasmic) end of the IGF1R. A stable cell line was generated by stably transfecting HEK293A cells with the IGF1R–BirA* fusion construct, which is referred to as the “BioID cell line” for the rest of this paper. The IGF1R–BirA* construct was transfected into the HEK293A cells with the Lipofectamine LTX transfection reagent (Thermo Fisher Scientific). As this construct contains a neomycin cassette, stably transfected cells were selected for by culturing the cells in media containing 1 mg/ml of the antibiotic G418 (Life Technologies). The BioID cell line was subsequently cultured in normal HEK293A growth media supplemented with 0.5 mg/ml of G418.
Quantitative MS
Sample preparation
Following treatment, cells were lysed and pulldown was performed using streptavidin-coated beads according to a previously published BioID protocol (41). Samples were submitted to the Duke Proteomics Core Facility (DPCF) in 30 μl of 250 mm Tris, 3% SDS. The entire sample was loaded onto an Invitrogen NuPAGE 4–12% SDS-PAGE gel and run for ∼5 min to electrophorese all proteins into the gel matrix. The entire Mr range was then excised in a single gel-band and subjected to standardized in-gel reduction, alkylation, and tryptic digestion. Following lyophilization of the extracted peptide mixtures, samples were resuspended in 20 μl of 2% acetonitrile, 1% TFA supplemented with 10 fmol/μl of yeast alcohol dehydrogenase. From each sample, 5 μl was removed to create a QC Pool sample that was run periodically throughout the acquisition period.
Quantitative analysis method
Quantitative LC/MS/MS was performed on 2 μl of each sample, using a nanoAcquity UPLC system (Waters Corp) coupled to a Thermo QExactive Plus high resolution accurate mass tandem mass spectrometer (Thermo) via a nanoelectrospray ionization source. Briefly, the sample was first trapped on a Symmetry C18 20-mm × 180-μm trapping column (5 μl/min at 99.9/0.1 (v/v) water/acetonitrile), after which the analytical separation was performed using a 1.7-μm Acquity BEH130 C18 75-μm × 250-mm column (Waters Corp.) with a 90-min linear gradient of 5–40% acetonitrile with 0.1% formic acid at a flow rate of 400 nanoliters/min with a column temperature of 55 °C. Data collection on the QExactive Plus mass spectrometer was performed in a data-dependent acquisition mode of acquisition with a r = 70,000 (m/z 200) full MS scan from m/z 375–1600 with a target AGC value of 1e6 ions followed by 10 MS/MS scans at r-17,500 (m/z 200) at a target AGC value of 5e4 ions. A 20-s dynamic exclusion was employed to increase depth of coverage. The total analysis cycle time for each sample injection was ∼2 h.
Following UPLC-MS/MS analyses, data were imported into Rosetta Elucidator version 4.0 (Rosetta Biosoftware, Inc.), and analyses were aligned based on the accurate mass and retention time of detected ions (features) using the PeakTeller algorithm in Elucidator. Relative peptide abundance was calculated based on area under the curve of the selected ion chromatograms of the aligned features across all runs. The MS/MS data were searched against a custom Swissprot database with Homo sapiens taxonomy (downloaded in Sept. 2016) with additional proteins, including yeast ADH1, BSA, streptavidin, Escherichia coli BirA as well as an equal number of reversed-sequence (“decoys”) false discovery rate determination. Mascot Distiller and Mascot Server (version 2.5, Matrix Sciences) were utilized to produce fragment ion spectra and to perform the database searches. Database search parameters included fixed modification on Cys (carbamidomethyl) and variable modifications on Asn and Gln deamidation. After individual peptide scoring using the PeptideProphet algorithm in Elucidator, the data were annotated at a 0.5% peptide false discovery rate.
Statistical analysis
Fold-changes for every identified protein was calculated between the IGF1-treated and untreated groups. In addition, we performed a two-tailed heteroscedastic t test in Excel for each of these comparisons. To select proteins that were differentially interacting with IGF1R, proteins were filtered to include those with a positive 2-fold change and p < 0.05 compared with untreated group. We required proteins to have a ProteinTeller score of >0.8 to maintain a high qualitative identification probability.
Knockdown and overexpression
ON-TARGET plus siRNA pools (Dharmacon) were used to suppress the expression of human SNX6. Transfection was performed 1 day after seeding using the Lipofectamine RNAiMAX reagent (Invitrogen) following the manufacturer's instructions. A nontargeting siRNA pool was used as a negative control. SNX6 overexpression was achieved by transfecting cells with a plasmid containing the coding region of human SNX6 under the influence of a cytomegalovirus promoter (catalog CH803743; Vigene Biosciences) using the Lipofectamine LTX transfection reagent (Thermo Fisher Scientific) according to the manufacturer's instructions.
Immunoblotting
Protein extraction from cultured cells and Western blotting was performed according to a previously published protocol (12). Proteins were resolved on an SDS-PAGE (Life Technologies) and transferred to a nitrocellulose membrane (Bio-Rad). The following antibodies were used: phospho-Akt(S473) number 9271, Akt number 9272, phospho-ERK1/2 number 9101, ERK1/2 number 9102, DYKDDDDK Tag (9A3) number 8146 (all from Cell Signaling Technology), and monoclonal anti-SNX6 antibody (S6324; Sigma). All antibodies were applied at a 1:1000 concentration. Proteins were visualized by chemiluminescence using ECL Prime reagent (GE Healthcare) and a Syngene G:Box. Band intensities were determined using ImageJ software.
Co-immunoprecipitation
Immunoprecipitation was performed by magnetic separation using protein A-agarose beads (number 73778) according to the manufacturer's protocol (Cell Signaling Technology). Cells were seeded at a density of 500,000 cells per 10-cm plate. Pulldown was performed using either IGF1Rβ antibody 3027 or mouse anti-rabbit IgG (Light-Chain Specific) (D4W3E) mAb 45262 at a concentration of 1:100 using identical amounts of cell lysate (200 μg) (Cell Signaling Technology).
Bioluminescence resonance energy transfer (BRET)
Constructs used
The SHC1(PTB)–eYFP and IRS1(PTB)–eYFP constructs were generated by subcloning the fragments encoding the phosphotyrosine binding (PTB) domain of human SHC1 and the PTB domain of human IRS1, respectively, into the pEYFP-N1 vector. The IGF1R–RlucII construct was generated by subcloning the coding region of the human IGF1R into the pcDNA3.1 RlucII vector (a kind gift from Thomas Pack, Duke University). All constructs were validated by sequencing.
Protocol
HEK293A cells were used for the BRET experiments. Cells were seeded at a density of 20,000 cells/well of a 12-well plate for transfections. SNX6 knockdown was performed as previously described. The following day, cells were transiently transfected with pairs of RlucII/eYFP constructs using the Lipofectamine LTX and PLUS Reagent according to the manufacturer's instructions (Thermo Fisher Scientific). The following day cells were trypsinized and re-seeded at a density of 15,000 cells/well of white clear-bottomed 96-well plates (Corning). After 24 h the cells were serum-starved (regular HEK 293A growth media without serum) for 30 min. Following two washes with 1× PBS, the Renilla substrate Coelenterazine-H (Thermo Fisher Scientific) was added at a concentration of 5 μm with or without 100 nm IGF1. The bottom of the plate was then sealed with white backing tape (PerkinElmer Life Sciences) to reduce background signal. Simultaneous measurements at 485 and 515 nm were made on a POLARstar OPTIMA plate reader (BMG Lab Tech). BRET values were calculated as the ratio of the readings taken at 515 nm divided by those taken at 485 nm.
Flow cytometry
Following treatment, cell collection was performed in enzyme-free cell dissociation buffer (Life Technologies). Cells were fixed in 4% paraformaldehyde for 15 min at room temperature, followed by three washes in 1× PBS (800 × g, 5 min). Cells were incubated with either phycoerythrin-conjugated mouse anti-human CD221 antibody (catalog number 555999; BD Biosciences) or phycoerythrin-conjugated mouse IgG1κ Isotype Control (12-4714-42; eBioscience) diluted at 1:5 in incubation buffer (0.5 g of BSA in 100 ml of 1× PBS) for 1 h at room temperature in the dark. Following two final washes in 1× PBS, flow cytometry was performed using a BD FACS Canto II flow cytometer (BD Biosciences) and data analysis was performed using FlowJo Version 10.
Immunofluorescence
Following treatment, cells were fixed in 4% paraformaldehyde for 15 min at room temperature. Following fixation, cells were washed twice with 1× PBS. 10 mm NH4Cl/PBS was added for 20 min to quench the free aldehyde groups of the fixative. Following three more washes in 1× PBS, cells were permeabilized in 0.1% Triton X-100 (in PBS) for 10 min. Following an additional three washes with 1× PBS, 5% normal goat serum was added for 10 min. Cells were then stained using an HA tag (C29F4) antibody (1:200; Cell Signaling Technology) overnight at 4 °C. The following day, cells were washed and blocked again in 5% normal goat serum. Alexa Fluor secondary antibodies (Invitrogen) were used for detection. Cells were counterstained with 4′,6-diamidino-2-phenylindole to visualize nuclei. Images were taken using an LSM 510 META confocal microscope (Zeiss) with ZEN software.
Statistics
For pairwise comparisons, data were analyzed using Student's t test. For multiple comparisons, one-way analysis of variance followed by Bonferroni's Multiple Comparison Test. All data are presented as mean ± S.E. A value of p < 0.05 was considered to be statistically significant. Statistical analysis was performed on GraphPad Prism 5.0.
Author contributions
A. B., C. P. H., and V. J. D. conceptualization; A. B., E. S., and G. W. data curation; A. B. and E. S. formal analysis; A. B., C. P. H., and V. J. D. investigation; A. B., E .S., and G. W. methodology; A. B., C. P. H., and V. J. D. writing-original draft; A. B., C. P. H., and V. J. D. writing-review and editing; C. P. H. and V. J. D. supervision; E. S. resources; V. J. D. funding acquisition.
Supplementary Material
Acknowledgments
We thank Dr. Richard Pratt for intellectual input and comments on the manuscript. We also thank Rosalyn Fletcher for excellent administrative assistance on this project.
This work was supported by the Edna and Fred L. Mandel, Jr. Foundation. The authors declare that they have no conflicts of interest with the contents of this article.
This article contains Table S1.
- IGF1R
- insulin-like growth factor 1 receptor
- RTK
- receptor tyrosine kinase
- BioID
- proximity-dependent biotin identification
- APEX
- ascorbate peroxidase
- SNX6
- sorting nexin 6
- PTB
- phosphotyrosine binding
- BRET
- bioluminescence resonance energy transfer.
References
- 1. Dupont J., and Le Roith D. (2001) Insulin-like growth factor 1 and oestradiol promote cell proliferation of MCF-7 breast cancer cells: new insights into their synergistic effects. Mol. Pathol. 54, 149–154 10.1136/mp.54.3.149 [DOI] [PMC free article] [PubMed] [Google Scholar]
- 2. Narasimhan S. D., Yen K., and Tissenbaum H. A. (2009) Converging pathways in lifespan regulation. Curr. Biol. 19, R657–R666 10.1016/j.cub.2009.06.013 [DOI] [PMC free article] [PubMed] [Google Scholar]
- 3. Schiaffino S., and Mammucari C. (2011) Regulation of skeletal muscle growth by the IGF1-Akt/PKB pathway: insights from genetic models. Skelet. Muscle 1, 4 10.1186/2044-5040-1-4 [DOI] [PMC free article] [PubMed] [Google Scholar]
- 4. McMullen J. R., Shioi T., Huang W. Y., Zhang L., Tarnavski O., Bisping E., Schinke M., Kong S., Sherwood M. C., Brown J., Riggi L., Kang P. M., and Izumo S. (2004) The insulin-like growth factor 1 receptor induces physiological heart growth via the phosphoinositide 3-kinase(p110α) pathway. J. Biol. Chem. 279, 4782–4793 10.1074/jbc.M310405200 [DOI] [PubMed] [Google Scholar]
- 5. Accorsi A., Kumar A., Rhee Y., Miller A., and Girgenrath M. (2016) IGF-1/GH axis enhances losartan treatment in Lama2-related muscular dystrophy. Hum. Mol. Genet. 25, 4624–4634 [DOI] [PubMed] [Google Scholar]
- 6. Schmidt K., von Haehling S., Doehner W., Palus S., Anker S. D., and Springer J. (2011) IGF-1 treatment reduces weight loss and improves outcome in a rat model of cancer cachexia. J. Cachexia Sarcopenia Muscle 2, 105–109 10.1007/s13539-011-0029-3 [DOI] [PMC free article] [PubMed] [Google Scholar]
- 7. Beckwith H., and Yee D. (2015) Minireview: were the IGF signaling inhibitors all bad? Mol. Endocrinol. 29, 1549–1557 10.1210/me.2015-1157 [DOI] [PMC free article] [PubMed] [Google Scholar]
- 8. Iams W. T., and Lovly C. M. (2015) Molecular pathways: clinical applications and future direction of insulin-like growth factor-1 receptor pathway Blockade. Clin. Cancer Res. 21, 4270–4277 10.1158/1078-0432.CCR-14-2518 [DOI] [PMC free article] [PubMed] [Google Scholar]
- 9. Girnita L., Worrall C., Takahashi S., Seregard S., and Girnita A. (2014) Something old, something new and something borrowed: emerging paradigm of insulin-like growth factor type 1 receptor (IGF-1R) signaling regulation. Cell. Mol. Life Sci. 71, 2403–2427 10.1007/s00018-013-1514-y [DOI] [PMC free article] [PubMed] [Google Scholar]
- 10. Takada Y., Takada Y. K., and Fujita M. (2017) Crosstalk between insulin-like growth factor (IGF) receptor and integrins through direct integrin binding to IGF1. Cytokine Growth Factor Rev. 34, 67–72 10.1016/j.cytogfr.2017.01.003 [DOI] [PMC free article] [PubMed] [Google Scholar]
- 11. Morris J. H., Knudsen G. M., Verschueren E., Johnson J. R., Cimermancic P., Greninger A. L., and Pico A. R. (2014) Affinity purification-mass spectrometry and network analysis to understand protein-protein interactions. Nat. Protoc. 9, 2539–2554 10.1038/nprot.2014.164 [DOI] [PMC free article] [PubMed] [Google Scholar]
- 12. Bareja A., Hodgkinson C. P., Payne A. J., Pratt R. E., and Dzau V. J. (2017) HASF (C3orf58) is a novel ligand of the insulin-like growth factor 1 receptor. Biochem. J. 474, 771–780 10.1042/BCJ20160976 [DOI] [PubMed] [Google Scholar]
- 13. Persani L., Calebiro D., and Bonomi M. (2007) Technology Insight: modern methods to monitor protein-protein interactions reveal functional TSH receptor oligomerization. Nat. Clin. Pract. Endocrinol. Metab. 3, 180–190 10.1038/ncpendmet0401 [DOI] [PubMed] [Google Scholar]
- 14. Roux K. J., Kim D. I., Raida M., and Burke B. (2012) A promiscuous biotin ligase fusion protein identifies proximal and interacting proteins in mammalian cells. J. Cell Biol. 196, 801–810 10.1083/jcb.201112098 [DOI] [PMC free article] [PubMed] [Google Scholar]
- 15. Li X. W., Rees J. S., Xue P., Zhang H., Hamaia S. W., Sanderson B., Funk P. E., Farndale R. W., Lilley K. S., Perrett S., and Jackson A. P. (2014) New insights into the DT40 B cell receptor cluster using a proteomic proximity labeling assay. J. Biol. Chem. 289, 14434–14447 10.1074/jbc.M113.529578 [DOI] [PMC free article] [PubMed] [Google Scholar]
- 16. Hung V., Zou P., Rhee H. W., Udeshi N. D., Cracan V., Svinkina T., Carr S. A., Mootha V. K., and Ting A. Y. (2014) Proteomic mapping of the human mitochondrial intermembrane space in live cells via ratiometric APEX tagging. Mol. Cell 55, 332–341 10.1016/j.molcel.2014.06.003 [DOI] [PMC free article] [PubMed] [Google Scholar]
- 17. Hung V., Lam S. S., Udeshi N. D., Svinkina T., Guzman G., Mootha V. K., Carr S. A., and Ting A. Y. (2017) Proteomic mapping of cytosol-facing outer mitochondrial and ER membranes in living human cells by proximity biotinylation. eLife 6, e24463 [DOI] [PMC free article] [PubMed] [Google Scholar]
- 18. Kim D. I., Birendra K. C., Zhu W., Motamedchaboki K., Doye V., and Roux K. J. (2014) Probing nuclear pore complex architecture with proximity-dependent biotinylation. Proc. Natl. Acad. Sci. U.S.A. 111, E2453–E2461 10.1073/pnas.1406459111 [DOI] [PMC free article] [PubMed] [Google Scholar]
- 19. Comartin D., Gupta G. D., Fussner E., Coyaud É., Hasegan M., Archinti M., Cheung S. W., Pinchev D., Lawo S., Raught B., Bazett-Jones D. P., Lüders J., and Pelletier L. (2013) CEP120 and SPICE1 cooperate with CPAP in centriole elongation. Curr. Biol. 23, 1360–1366 10.1016/j.cub.2013.06.002 [DOI] [PubMed] [Google Scholar]
- 20. Guo Z., Neilson L. J., Zhong H., Murray P. S., Zanivan S., and Zaidel-Bar R. (2014) E-cadherin interactome complexity and robustness resolved by quantitative proteomics. Sci. Signal. 7, rs7 10.1126/scisignal.2005473 [DOI] [PMC free article] [PubMed] [Google Scholar]
- 21. Steed E., Elbediwy A., Vacca B., Dupasquier S., Hemkemeyer S. A., Suddason T., Costa A. C., Beaudry J. B., Zihni C., Gallagher E., Pierreux C. E., Balda M. S., and Matter K. (2014) MarvelD3 couples tight junctions to the MEKK1-JNK pathway to regulate cell behavior and survival. J. Cell Biol. 204, 821–838 10.1083/jcb.201304115 [DOI] [PMC free article] [PubMed] [Google Scholar]
- 22. Lambert J. P., Tucholska M., Go C., Knight J. D., and Gingras A. C. (2015) Proximity biotinylation and affinity purification are complementary approaches for the interactome mapping of chromatin-associated protein complexes. J. Proteomics 118, 81–94 10.1016/j.jprot.2014.09.011 [DOI] [PMC free article] [PubMed] [Google Scholar]
- 23. Couzens A. L., Knight J. D., Kean M. J., Teo G., Weiss A., Dunham W. H., Lin Z. Y., Bagshaw R. D., Sicheri F., Pawson T., Wrana J. L., Choi H., and Gingras A. C. (2013) Protein interaction network of the mammalian Hippo pathway reveals mechanisms of kinase-phosphatase interactions. Sci. Signal. 6, rs15 10.1126/scisignal.2004712 [DOI] [PubMed] [Google Scholar]
- 24. Rodríguez-Fraticelli A. E., Bagwell J., Bosch-Fortea M., Boncompain G., Reglero-Real N., García-Leon M. J., Andrés G., Toribio M. L., Alonso M. A., Millán J., Perez F., Bagnat M., and Martin-Belmonte F. (2015) Developmental regulation of apical endocytosis controls epithelial patterning in vertebrate tubular organs. Nat. Cell Biol. 17, 241–250 10.1038/ncb3106 [DOI] [PMC free article] [PubMed] [Google Scholar]
- 25. Wassmer T., Attar N., Bujny M. V., Oakley J., Traer C. J., and Cullen P. J. (2007) A loss-of-function screen reveals SNX5 and SNX6 as potential components of the mammalian retromer. J. Cell Sci. 120, 45–54 [DOI] [PubMed] [Google Scholar]
- 26. Krüger M., Kratchmarova I., Blagoev B., Tseng Y. H., Kahn C. R., and Mann M. (2008) Dissection of the insulin signaling pathway via quantitative phosphoproteomics. Proc. Natl. Acad. Sci. U.S.A. 105, 2451–2456 10.1073/pnas.0711713105 [DOI] [PMC free article] [PubMed] [Google Scholar]
- 27. Wang J., Qi L., Huang S., Zhou T., Guo Y., Wang G., Guo X., Zhou Z., and Sha J. (2015) Quantitative phosphoproteomics analysis reveals a key role of insulin growth factor 1 receptor (IGF1R) tyrosine kinase in human sperm capacitation. Mol. Cell. Proteomics 14, 1104–1112 10.1074/mcp.M114.045468 [DOI] [PMC free article] [PubMed] [Google Scholar]
- 28. Murphy J. P., and Pinto D. M. (2010) Temporal proteomic analysis of IGF-1R signalling in MCF-7 breast adenocarcinoma cells. Proteomics 10, 1847–1860 10.1002/pmic.200900711 [DOI] [PubMed] [Google Scholar]
- 29. Hanke S., and Mann M. (2009) The phosphotyrosine interactome of the insulin receptor family and its substrates IRS-1 and IRS-2. Mol. Cell. Proteomics 8, 519–534 10.1074/mcp.M800407-MCP200 [DOI] [PMC free article] [PubMed] [Google Scholar]
- 30. Kim D. I., and Roux K. J. (2016) Filling the void: proximity-based labeling of proteins in living cells. Trends Cell Biol. 26, 804–817 10.1016/j.tcb.2016.09.004 [DOI] [PMC free article] [PubMed] [Google Scholar]
- 31. Lobingier B. T., Hüttenhain R., Eichel K., Miller K. B., Ting A. Y., von Zastrow M., and Krogan N. J. (2017) An approach to spatiotemporally resolve protein interaction networks in living cells. Cell 169, 350–360.e312 10.1016/j.cell.2017.03.022 [DOI] [PMC free article] [PubMed] [Google Scholar]
- 32. Paek J., Kalocsay M., Staus D. P., Wingler L., Pascolutti R., Paulo J. A., Gygi S. P., and Kruse A. C. (2017) Multidimensional tracking of GPCR signaling via peroxidase-catalyzed proximity labeling. Cell 169, 338–349.e311 10.1016/j.cell.2017.03.028 [DOI] [PMC free article] [PubMed] [Google Scholar]
- 33. Seaman M. N. (2005) Recycle your receptors with retromer. Trends Cell Biol. 15, 68–75 10.1016/j.tcb.2004.12.004 [DOI] [PubMed] [Google Scholar]
- 34. Parks W. T., Frank D. B., Huff C., Renfrew Haft C., Martin J., Meng X., de Caestecker M. P., McNally J. G., Reddi A., Taylor S. I., Roberts A. B., Wang T., and Lechleider R. J. (2001) Sorting nexin 6, a novel SNX, interacts with the transforming growth factor-β family of receptor serine-threonine kinases. J. Biol. Chem. 276, 19332–19339 10.1074/jbc.M100606200 [DOI] [PubMed] [Google Scholar]
- 35. Mukherjee S., Tessema M., and Wandinger-Ness A. (2006) Vesicular trafficking of tyrosine kinase receptors and associated proteins in the regulation of signaling and vascular function. Circ. Res. 98, 743–756 10.1161/01.RES.0000214545.99387.e3 [DOI] [PubMed] [Google Scholar]
- 36. Huang C., Thirone A. C., Huang X., and Klip A. (2005) Differential contribution of insulin receptor substrates 1 versus 2 to insulin signaling and glucose uptake in l6 myotubes. J. Biol. Chem. 280, 19426–19435 10.1074/jbc.M412317200 [DOI] [PubMed] [Google Scholar]
- 37. Martins A. S., Ordóñez J. L., Amaral A. T., Prins F., Floris G., Debiec-Rychter M., Hogendoorn P. C., and de Alava E. (2011) IGF1R signaling in Ewing sarcoma is shaped by clathrin-/caveolin-dependent endocytosis. PloS One 6, e19846 10.1371/journal.pone.0019846 [DOI] [PMC free article] [PubMed] [Google Scholar]
- 38. Jovic M., Sharma M., Rahajeng J., and Caplan S. (2010) The early endosome: a busy sorting station for proteins at the crossroads. Histol. Histopathol. 25, 99–112 [DOI] [PMC free article] [PubMed] [Google Scholar]
- 39. Nazarewicz R. R., Salazar G., Patrushev N., San Martin A., Hilenski L., Xiong S., and Alexander R. W. (2011) Early endosomal antigen 1 (EEA1) is an obligate scaffold for angiotensin II-induced, PKC-α-dependent Akt activation in endosomes. J. Biol. Chem. 286, 2886–2895 10.1074/jbc.M110.141499 [DOI] [PMC free article] [PubMed] [Google Scholar]
- 40. Khoury E., Nikolajev L., Simaan M., Namkung Y., and Laporte S. A. (2014) Differential regulation of endosomal GPCR/β-arrestin complexes and trafficking by MAPK. J. Biol. Chem. 289, 23302–23317 10.1074/jbc.M114.568147 [DOI] [PMC free article] [PubMed] [Google Scholar]
- 41. Mehus A. A., Anderson R. H., and Roux K. J. (2016) BioID identification of lamin-associated proteins. Methods Enzymol. 569, 3–22 10.1016/bs.mie.2015.08.008 [DOI] [PMC free article] [PubMed] [Google Scholar]
Associated Data
This section collects any data citations, data availability statements, or supplementary materials included in this article.


