

Summary
The functional impact of the vast majority of cancer somatic mutations remains unknown, representing a critical knowledge gap for implementing precision oncology. Here, we report the development of a moderate-throughput functional genomic platform consisting of efficient mutant generation, sensitive viability assays using two growth-factor–dependent cell models, and functional proteomic profiling of signaling effects for select aberrations. We apply the platform to annotate >1000 genomic aberrations, including gene amplifications, point mutations, indels, and gene fusions, potentially doubling the number of driver mutations characterized in clinically actionable genes. Further, the platform is sufficiently sensitive to identify weak drivers. Our data are accessible through a user-friendly, public data portal (http://bioinformatics.mdanderson.org/main/FASMIC). Our study will facilitate biomarker discovery, prediction algorithm improvement, and drug development.
Graphical abstract
Ng et al. develop a moderate-throughput functional genomic platform and use it to annotate >1,000 cancer variants of unknown significance. The approach is sufficiently sensitive to identify weak drivers, potentially doubling the number of driver mutations characterized in clinically actionable genes.
Introduction
Next-generation sequencing technologies, including recent consortium projects such as The Cancer Genome Atlas (TCGA) have identified thousands of unique mutations and fusions across cancer types (Cancer Genome Atlas Research et al., 2013). Mutations observed in cancer tissues may exert different functional effects, ranging from oncogenic activation to tumor suppression to no obvious functional impact. Importantly, diverse mutations in the same gene have been observed, often depending on tumor contexts (Chang et al., 2016; Kandoth et al., 2013; Yi et al., 2017). Classical gene knockout or knockdown approaches for characterizing gene function cannot resolve the diverse functional impacts caused by different mutations in the same gene. Even for the most actively studied cancer genes such as PIK3CA, only a fraction of the variants identified in tumors have been functionally characterized (Cheung et al., 2011; Dogruluk et al., 2015). A critical challenge in developing and implementing cancer therapies and improving patient care is to distinguish causal driver mutations from non-pathogenic passenger variants and elucidate their oncogenic mechanisms (Sahni et al., 2013; Scott and Powers, 2016; Takiar et al., 2017). Therefore, there is an urgent need to functionally characterize large numbers of cancer variants of unknown significance (VUS) in a systematic way.
More than a dozen computational algorithms have been developed to predict functional impacts of cancer mutations based on frequency, conservation, and the 3D protein structure (Carter and Karchin, 2014; Porta-Pardo et al., 2017). However, the results of these methods vary greatly, their accuracy is often limited, and there is no “gold standard” for rigorously evaluating their predictive power. Further, computational algorithms can only identify general impact and fail to pinpoint the detailed functional effects of specific mutations. Conventional experimental studies can only characterize a small number of variants in an inefficient way. This is due at least in part to the difficulty in creating, expressing and characterizing large numbers of specific mutants in sensitive functional assay systems.
Several recent studies have functionally characterized a large number of VUS using systematic approaches including pooled (in vitro and in vivo) strategies (Berger et al., 2016; Kim et al., 2016; Kohsaka et al., 2017), which represent significant advances in the field. However, the competition between mutations with different activities in the pooled assays remains a critical concern. Strong drivers can become dominant in the pool and outcompete with many others that have lower activity levels, which decreases the sensitivity of the assay. In addition, in vivo assays are highly time- and resource-consuming. Therefore it is necessary to develop more sensitive, efficient, and systematic approaches to assess how and to what extent a particular somatic mutation contributes to cancer development.
Results
Development of a Versatile Functional Genomic Platform
To annotate functional impact of VUS, we developed a moderate-throughput functional genomic platform. Different from the in vivo ‘pooled-format’ screening used in other studies, our platform tested mutations and fusions on an individual basis using an in vitro system that shortened the time-to-result interval to approximately 6 weeks and avoided the potential masking effect of strong activating mutations for identifying weak drivers. Our platform consists of four main steps: (1) selection of somatic mutations from large-scale patient cohort data; (2) generation and sequence confirmation of bar-coded expression clones by a HiTMMoB approach (Tsang et al., 2016); (3) in vitro screening in two growth-factor–dependent cell models to generate consensus functional annotation of mutations and fusion genes; and (4) functional proteomic profiling of selected mutations through reverse-phase protein arrays (RPPAs) (Li et al., 2017) (Figure 1A).
Figure 1. Overview of the functional genomic platform and cancer mutations tested.
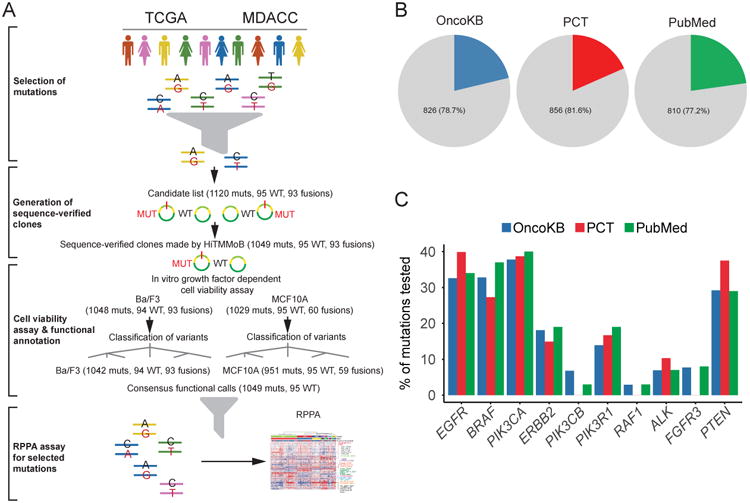
(A) Mutations (muts), corresponding wild-type (WT) and fusion genes were selected from TCGA projects and MD Anderson Cancer Center patient databases. Clones were generated by the HiTMMoB approach, and tested in in vitro growth-factor dependent cell viability assays with Ba/F3 and MCF10A cell models. Mutations and wild-type variants were classified into functional categories based on these results. MCF10A cell lines stably expressing selected mutations were generated for reverse-phase protein array (RPPA) analysis. The numbers of mutant, wild-type and fusion constructs are annotated at each step. (B) Pie charts showing the proportions of the mutations annotated in OncoKB or Personalized Cancer Therapy (PCT) or PubMed literature among all the 1049 mutations tested. (C) Bar plots showing the literature coverage of mutations for the top 10 genes with the greatest number of mutations tested, as shown by the percentages of tested mutations per gene annotated in OncoKB or PCT or PubMed. See also Figure S1 and Table S1.
Our primary mutation list was based on TCGA mutation datasets of 33 cancer types, including recurrent mutations in selected clinically actionable genes (such as EGFR, PIK3CA, BRAF, and ERBB2). The list was further expanded with selected mutations in more potentially druggable genes, such as PTEN, ALK, PDGFRA and FGFR2, identified in the MD Anderson Cancer Center patient database. We generated 1049 mutations and 95 wild-type lentivirus constructs using the HiTTMoB technique and sequenced all constructs in full-length to confirm that unexpected mutations were not introduced in the template (wild-type) clones (Table S1). We estimated how many of the mutations we tested have not been previously annotated in the literature by comparing our mutation list with publicly available knowledge-based mutation annotation databases OncoKB (Chakravarty et al., 2017) and Personalized Cancer Therapy (PCT) (Kurnit et al., 2017) and via text mining in PubMed. Importantly, only 21.3% of mutations (using OncoKB) and 18.4% (using PCT) had been previously annotated, and 22.8% of mutations were found through text mining in PubMed (Figure 1B). Among the top 10 mutated genes surveyed, the literature coverage was in the range of 0-40.3%, with an average of 19.1% (Figure 1C). Altogether, the resource presented provides functional annotations of >1000 mutations, including >800 VUS.
To examine whether screening individual mutations can overcome the potential masking effect of highly active driver mutations in the pooled format, we carried out parallel pooled and individual screens of 29 PIK3CA mutants and wild-type PIK3CA in the Ba/F3 cell line under both in vivo and in vitro settings (Figure S1). Ba/F3 cells depend on interleukin-3 (IL-3) for growth and proliferation but can be transformed to IL-3 independence in the presence of an oncogenic event, making it useful for detecting driver mutations that affect cell proliferation and survival (Warmuth et al., 2007). PIK3CAK111delK had the strongest activating mutation score in both the pooled and individual in vitro formats. Six more mutations were also scored in the pooled format, among which 5 were also captured in the individual format. Notably, 10 mutations (e.g., E39K, G106V and I112N) were only scored (i.e., >2-fold change to the wild-type) when screened as individual mutations (Figure S1A). For the in vivo pooled format (Figure S1B), the enrichment of 3 mutations (E110delE, K111delK and C604R) was found to be less than that from the in vitro pooled screening, which is consistent with higher sensitivity for detecting driver mutations in vitro. To further test whether the effects of moderately active oncogenic mutations were masked in the pooled in vivo screen, G106V, a moderate driver scored in the individual in vitro screening, was tested individually in vivo, with PIK3CAK111delK and wild-type PIK3CA as controls. Tumor growth of Ba/F3 expressing K111delK was the strongest, while the wild-type counterpart did not form a tumor during the experiment duration (Figure S1C). Consistent with the individual in vitro screening, G106V induced weaker tumor growth than K111delK, but had significantly stronger tumor formation effects than wild-type. Thus an individual evaluation of mutations can improve sensitivity and subsequent classification of individual aberrations.
We next tested the candidates in IL-3-dependent Ba/F3 cells and EGF- and insulin-dependent MCF10A cells (a non-tumorigenic breast epithelial cell line) in parallel, using a lentiviral approach with wild-type counterparts as well as negative and positive experimental controls in each screen (STAR Methods). Our hypothesis was that activating mutations, also known as “drivers”, would confer survival advantage to cells in the absence of dependent growth factors; while non-functional mutations, also known as “passengers”, would not. We classified wild-type genes and mutations into different functional categories. Overall, we obtained qualified functional annotation for 1042 mutations and 94 wild-type genes in Ba/F3 cells and 951 mutations and 95 wild-type genes in MCF10A cells (Table S1).
Fusion genes caused by genomic rearrangements can be drivers and important therapeutic targets. We generated 93 fusions identified from human cancers using a modified HiTTMoB approach (Li et al., 2017) and assessed their activity in our platform. Among them, 15 fusions increased proliferation compared to green fluorescent protein (GFP) negative controls (NCs) (Table S1). This provides functional annotation of a large collection of fusion genes and highlights the versatility of the platform.
Functional Classification of Wild-type Genes and Mutations
We annotated wild-type genes and mutations in both Ba/F3 and MCF10A models separately based on their cell viability data. In order to allow accurate comparison across different screens, corresponding wild-type controls were always run in parallel with the mutations of interest in each batch. The first step of the decision tree (Figure S2A) is annotating the wild-type genes, which were classified into three categories (positive, no effect and negative) by comparing viability measurements to GFP/mCherry/Luciferase (NCs) that were run in each experiment batch. If a wild-type gene had higher mean cell viability than the NC, it was classified as positive (e.g., EGFR in both models); if a wild-type gene had cell viability lower than the NC, it was classified as negative (e.g., PTEN in both models); otherwise, the gene was classified as no effect (e.g., BRAF in Ba/F3 and PIK3CA in MCF10A). Next, mutations were annotated by comparing cell viability signals to their corresponding wild-type genes. For positive wild-type genes, mutations were annotated as activating if the cell viability of the mutations was higher than that of the wild-type gene at the same time point in the same experiment; the mutations were annotated as neutral or inactivating if their cell viability measurements was similar to or lower than that of the corresponding wild-type constructs, respectively. For inactivating mutations, the viability of cells overexpressing the mutations was lower than that of the NC, so they were annotated as inhibitory to indicate that the mutations may potentially inhibit cell viability rather than simply inactivate wild-type function. For no effect wild-type genes, mutations were annotated as activating, neutral or inhibitory in the same way. For negative wild-type genes, mutations were classified as neutral or non-inhibitory if their cell viability was no different from or higher than that of the wild-type construct, respectively. Among the non-inhibitory mutations, if the cell viability of the mutations was higher than that of the NC, they were annotated as activating to distinguish them from typical non-inhibitory mutations that inactivate tumor suppressor genes. Activating mutations in a negative wild-type gene therefore actively promote cell growth/proliferation instead of relieving the inhibitory effect of the wild-type gene. Furthermore, for some genes, such as ERBB4, CDH1 and IDH1, none of the mutations and corresponding wild-type constructs tested showed any activity (either activating or inhibitory) in the cell models. We cannot determine whether the cell models were not responsive to the gene product or the mutation functions were not different from wild-type. We therefore annotated these wild-type genes and their mutations as non-informative. It is important to note that non-informative mutations are not necessarily non-functional, as they may exhibit functional effects if evaluated in other model systems.
We functionally annotated 1049 mutations, including 923 missense, 74 indel, and 25 nonsense mutations (Figure 2A). In addition, 27 silent mutations across multiple genes were included to serve as controls for annotation. The overall dataset consists of 95 genes, including 21 genes with more than 10 mutations per gene (Figure 2B). Four major allelic series of clinically actionable cancer genes, EGFR, BRAF, PIK3CA and ERBB2, contributed 479 mutations. For PTEN, a known tumor suppressor gene, and PIK3R1, a gene with tumor suppressive properties (Cheung et al., 2011), more indel and nonsense mutations were included. In Ba/F3 cells, 14, 10 and 8 wild-type genes were annotated as positive, no effect and negative, respectively (Figure 2C). A similar pattern with more positive genes was found in MCF10A cells: 29, 13 and 7 wild-types genes were annotated as positive, no effect and negative, respectively (Figure 2C). Notably, 62 and 45 genes were respectively classified as non-informative in the Ba/F3 and MCF10A models. The number of non-informative genes using the consensus annotation was reduced to 40, whereby the gene was reclassified if functional in one of the two models. Another potential contributing factor to the number of non-informative genes is that only a few mutations were tested since the median number of mutations assessed was only 2 for the non-informative genes. Presumably, this issue could be addressed by including more mutations, more cell lines and orthogonal functional assays.
Figure 2. Functional annotation summary of wild-type genes and mutations.

(A) The numbers of missense (purple), indel (orange), nonsense (red) and silent (white) mutations tested are shown in parentheses. (B) The distribution of mutation types tested per gene for the 21 genes with >10 mutations tested is shown. (C, D) The functional annotations for wild-type genes (C) and mutations (D) in Ba/F3 (blue) and MCF10A (red) cell line models are presented based on the growth-factor independent cell viability assay results. (E) The number of mutations in each functional annotation is shown in parentheses. Eleven mutations with inconclusive functional annotations in Ba/F3 and MCF10A models were excluded. See also Figure S2 and Table S2.
For individual mutations, we annotated 228 activating, 532 neutral, 32 inactivating, 31 non-inhibitory and 4 inhibitory mutations in the Ba/F3 model (Figure 2D). Similarly, we annotated 231 activating, 539 neutral, 80 inactivating, 22 non-inhibitory and 5 inhibitory mutations in the MCF10A model (Figure 2D). Across the two cell models, 753 mutations had informative annotations, with 570 (75.7%) having concordant functional calls (Figure S2B). The mutation-level concordance between the two models was likely underestimated since one major reason for discordance was differential wild-type gene activity between the two models. For example, BRAF and ERBB2 wild-type genes were highly active (i.e., positive) in MCF10A cells, but were annotated as having no effect in Ba/F3 cells. Further, high activity of the wild-type gene narrowed the window to observe effects of activating mutations in the MCF10A model. For example, BRAFP731S, BRAFT599_V600insP and ERBB2V659E were annotated as neutral in MCF10A, but as activating in Ba/F3. However, since the BRAF and ERBB2 wild-type genes were annotated as having no effect in Ba/F3 cells, we were unable to observe any inactivating mutations in the Ba/F3 model. For example, BRAFD594H/A/V and ERBB2V308M were called inactivating in MCF10A, but neutral in Ba/F3. To estimate the concordance of these two cell models in more detail, we further divided the dataset into two groups: mutations with concordant wild-type annotation and mutations without concordant wild-type annotation (Figure S2C and S2D). The concordance rate of mutation annotation was 79.6% for the concordant wild-type group and 73.3% for the discordant wild-type group.
We generated consensus functional annotation for each mutation or wild-type gene by combining the functional annotations of Ba/F3 and MCF10A models based on an “OR gate” logic. Briefly, whenever an aberration was functional (i.e., positive and negative for wild-type genes; activating, inactivating, inhibitory and non-inhibitory for mutations) in either cell model, we used that call in the consensus annotation. In total, we made consensus functional annotations for 1049 unique mutations (Figure 2E) and 95 wild-type genes (Table S1).
Virus infection rate and expression of transgenes are key factors affecting functional consequence of a mutation. To determine their effects on our functional annotation, we measured virus titers used for infection and mRNA expression of transgenes in independent experiments. We observed no significant difference in virus titers or the expression levels of transgenes among different functional annotation groups (Figure S2E and S2F), confirming that their variations were relatively small. More importantly, our functional annotation did not correlate with these factors.
We rigorously assessed the reproducibility of functional annotation. First, we examined the performance of five experimental controls (mCherry and GFP/Luc, PIK3CA wild-type, M1043I and H1047R) in 60 independent Ba/F3 and 57 independent MCF10A experiments. In the Ba/F3 model, two negative controls did not demonstrate activity among all 60 experiments, while the PIK3CA wild-type, M1043I and H1047R exhibited weak, moderate and strong activities, respectively, as reported in a prior study (Dogruluk et al., 2015), in 57-59 out of 60 (95-98%) experiments (Figure S2G). In the MCF10A model, the negative controls did not demonstrate activity among all 57 experiments, while the PIK3CA wild-type and the two mutants exhibited expected activities in the majority (77-88%) of experiments (Figure S2H). Second, we ran an independent repeat experiment of 34 selected mutations and corresponding wild-type with different functional annotations of each of 4 allelic series, BRAF, EGFR, PIK3CA and ERBB2 (Table S2). Based on this subset, the reproducibility rate was 92.5%. Third, for EGFR mutations, we compared our Ba/F3 functional annotation with those characterized by a recent study (Kohsaka et al. 2017) using a similar in vitro arrayed approach, and found that the concordant rate was 90.5% (Figure S2I). Collectively, these results highlight the robustness of functional annotation made by our approach.
High-Sensitivity Functional Mutation Annotation
We compared our annotations with the results from the two published studies (Berger et al., 2016, Kim et al., 2016) that involved in vivo pooled screens. Only 3 out of 21 mutations assayed in both Berger et al. and our platform were positive in Berger et al. (Figure S3A, Table S3), while our platform captured both positive overlapping mutations from the in vivo pooled screen plus 15 additional mutations as activating. Only 4 out of 14 overlapping mutations assayed in both Kim et al. and our platform were positive (>1% of reads) in Kim et al. (Figure S3B, Table S3), while our platform captured all 4 positive overlapping mutations plus classified 7 additional mutations as activating. These results suggest that individual mutation-based functional screening is more sensitive in identifying activating mutations, including well-known and, importantly, weak to moderate activating mutations.
Due to the limited number of mutations that could be directly compared with in vivo pooled screening studies, we compared our annotation calls (only activating and neutral mutations) with OncoKB (Chakravarty et al., 2017), which classifies mutations as oncogenic, likely oncogenic, likely neutral and inconclusive. Among193 mutations annotated in both OncoKB and our dataset, OncoKB only has positive annotations (i.e., oncogenic/likely oncogenic), while our dataset has both positive (i.e., activating/positive) and negative (e.g., inactivating and inhibitory) directions. To provide an accurate comparison, negative annotations were excluded from the comparison. Among 187 shared annotated mutations (Figure 3A), 76 out of 94 (80.9%) oncogenic mutations and 57 out of 79 (72.2%) likely oncogenic mutations were annotated as activating in our dataset. The discrepancies between OncoKB and our dataset may arise from different experimental conditions or context-dependent functional effects. For example, ERBB3V104M is oncogenic in OncoKB based on the finding that it activated signaling and induced cell survival only when co-expressed with wild-type ERBB2 (Jaiswal et al., 2013). In addition, 6 out of 14 likely neutral mutations in OncoKB were annotated as activating in our dataset. We further categorized our activating mutations into strong, moderate and weak activating mutations based on the degree of activation compared to that of the corresponding wild-type genes in the cell viability assay. Interestingly, strong activating mutations were enriched in the oncogenic category (Fisher's exact test, p < 0.01), and the proportion gradually decreased from oncogenic to likely oncogenic and likely neutral. We performed a similar analysis using the mutational effects of the two in vivo screening studies (Figure S3C). We also found additional evidence supporting the vast majority of weak activating mutations identified (Table S3). These results further indicate that our platform has a high sensitivity to capture mutational functionality and associated information.
Figure 3. Comparison of our functional annotation with literature data and computational predictions.

(A) Activating and neutral mutations from our (non-pooled) in vitro platform results were compared to oncogenic, likely oncogenic, and likely neutral mutations annotated from OncoKB. The percentage of mutations in each category is shown. Activating mutations were further classified into strong, moderate and weak based on the degree of activating comparing with the corresponding wild-type genes. Numbers on the bars indicate the mutation numbers in each group. (B) ROC curves of 21 commonly used computational algorithms based on the functional calls in this study, with AUC scores for the top 5 algorithms. (C) Enrichment of activating mutations in three 3D computational algorithms. Numbers on the bars indicate the mutation numbers in each group. ****, p < 10-5. See Figure also S3 and Table S3.
Systematic assessment on computational algorithms for predicting mutation effects has been limited due to the lack of large-scale experimental data. We tested 21 computational algorithms commonly used with our annotation as the reference standard (Figure 3B). The receiver operating characteristic (ROC) analysis showed that the 21 algorithms yielded an area under the ROC curve (AUC) ranging from 49.7% to 76.0%. The top three algorithms were CanDrA plus (Mao et al., 2013) (AUC: 76.0%), CHASM (Wong et al., 2011) (AUC: 73.4%) and VEST3 (Carter et al., 2013) (AUC: 72.9%). Although these computational algorithms achieved some level of accuracy, none fully recapitulated our experimental results. Apart from the conventional prediction algorithms that are mainly based on the sequence information of the gene or protein, computational predictions using 3D information have been recently developed. We therefore tested whether the mutations in clusters detected by 3D prediction algorithms are more likely to be activating compared to those not in a cluster. We compared 855 missense mutations with informative functional annotations to the 3D cluster predictions of TCGA mutation dataset from 3D Hotspots (Gao et al., 2017), HotSpot3D (Niu et al., 2016) and HotMAPS (Tokheim et al., 2016). We observed significant enrichment of activating mutations in 3D clusters using all three predictions (Fisher's exact test, p < 2.2×10⁻¹⁶, Figure 3C).
We further examined the associations of our functional annotations with a number of common mutation properties, including the mutation position in a protein, mutation frequency, and amino acid conservation. As expected, mutations located in protein domains, hotspot positions, or in conserved amino acids were more likely to be functional (Figure S3D-H). We also found that mutations in amino acids that have lower relative surface accessibility (i.e., tend to be inside the core of the protein 3D structure) or those that caused changes in amino acid charge from positive to negative were more likely to be functional (Figure S3G and S3H). These results support prior work relating protein biophysics to functional mutations (Bustamante et al., 2000; Wang and Moult, 2001).
Functional Proteomic Analysis of Annotated Mutations
Signaling aberrations downstream of mutations inform us of the biological functions of mutations and can elucidate related therapeutic vulnerabilities. We performed functional proteomic analysis of 256 MCF10A cell lines that stably expressed different mutations using RPPAs with 304 antibodies (including 69 antibodies that specifically target post-translational modification events). The expression of the introduced mutations of all cell lines was verified at the RNA level by qPCR prior to RPPA analysis. Importantly, concordant with the transcripts, overexpression of the construct was also observed at the protein level (Figure S4A). We first focused on BRAF and EGFR allele series to assess whether RPPA profiling can capture functional annotations of different mutations within the same gene. We ranked the effects of specific mutations relative to a line expressing a reference mutation based on protein expression similarity between samples using all proteins profiled. We found that mutations with the same annotation tended to cluster together in rank-based maps based on the patterns of all proteins expressed in the cells (Figure 4A and 4B). We next performed unsupervised clustering analysis across all the mutations in different genes to assess the global signaling pattern. We found that mutations were grouped into 6 main clusters, primarily based on gene of origin (Figure 4C). BRAF mutations and ERBB2 mutations formed their own clusters, and EGFR mutations formed two clusters (EGFR1 and EGFR2), suggesting that the signaling pathways altered by the different EGFR mutations were distinct. In contrast, most mutations of PI3K signaling pathway genes (PIK3CA, PIK3CB and PTEN) grouped together in the same cluster, indicating common altered signaling pathways. This was somewhat surprising based on PTEN functioning as a tumor suppressor and PIK3CA and PIK3CB being oncogenic, and may be due to the PTEN mutations potentially demonstrating gain of function compared to the wild-type gene.
Figure 4. Functional proteomic profiling of select mutations in MCF10A.

(A, B) A rank order plot showing the overall reverse-phase protein assay (RPPA) protein expression pattern of each BRAF mutation relative to BRAFL584F (A) or each EGFR mutation relative to EGFRG719D (B). Spearman rank correlations were calculated based on all the proteins profiled, and the mutants are color coded by their functional annotations. (C) RPPA unsupervised clustering analysis of 268 MCF10A cell lines stably overexpressing selected mutations was performed. Cluster names are annotated in the top row of the feature track. Gene names and functional calls are also presented in the feature track. Key differentially expressed proteins across clusters are highlighted on the right. (D) Differential cell cycle pathway activities among different clusters. (E) Differential PI3K/Akt pathway activities between activating and non-activating mutations in the PI3K cluster. (F) Differential EMT pathway activities between activating and non-activating mutations in the BRAF cluster. (D-F) The middle lines indicate median values, the top and bottom of the box indicate 25th and 75th percentiles, and whiskers indicate 10th and 90th percentiles. See also Figure S4 and Table S4.
We observed activation of target proteins and linked activation of downstream signaling targets in the stable lines. For example, high expression levels of p-B-Raf p-RAF1 and p-MEK1 were associated with BRAF mutations; high expression levels of p-EGFR, p-SHP-2 and p-Stat3 were linked to EGFR mutations; and high levels of p-Akt or p-HER2 were associated with PIK3CA mutations and ERBB2 mutations, respectively. Interestingly, a large proliferative group of mutations, defined by high expression of proliferation-related proteins (cyclin-B1, CDK1, FoxM1, PLK1 and p-Rb), were found across cell lines carrying BRAF mutations in the BRAF cluster, EGFR mutations in EGFR1 cluster, ERBB2 mutations in the ERBB2 cluster and all PIK3CA, PIK3CB and PTEN mutations. We also found activation of mTOR signaling defined by p-S6, p-mTOR and p-4EBP1 in a sub-group of BRAF and EGFR mutant cell lines.
All mutations within the PI3K cluster (PIK3CA, PIK3CB and PTEN mutations) displayed high levels of p-Chk2 and, surprisingly, Bcl2 and IGFRb. The three PTEN frameshift mutants in the cluster exhibited decreased PTEN protein levels and were associated with high p-Akt, p-S6 and p-mTOR levels comparable to those of PIK3CA mutations. Three PIK3CA mutations (E39K, R38C and I112N) were not clustered with the rest of the PIK3CA mutations, and did not display high expression of Bcl2, IGFRb, and p-Akt. Instead, high expression levels of p-NF-κB and p-YAP suggested that these mutations were signaling rewired variants (i.e., neomorphs). Strikingly, our findings align with the notion that p110α (encoded by PIK3CA) and p110β (encoded by PIK3CB) mediate distinct signaling cascades (Thorpe et al., 2017).
We also performed pathway analysis based on pathway scores, which were indicative of pathway signaling activity (Akbani et al., 2014). Across different clusters, there were significant differences in cell cycle score: PI3K and EGFR2 clusters showed the highest cell cycle scores, while EGFR1 and mixed clusters had the lowest scores (Figure 4D, Table S4). Within the PI3K cluster, activating mutations showed higher PI3K pathway activity than other mutations (Figure 4E); and in the BRAF cluster, activating mutations showed a higher epithelial–mesenchymal transition score than other mutations (Figure 4F). Multiple pathways showed differential activities between the two EGFR clusters (Figure S4B). These results illustrate the utility of RPPA analysis to elucidate the functional effects of driver mutations on pathway activities.
Analysis of EGFR and BRAF Mutant Allelic Series
EGFR and BRAF are among the most important clinically actionable genes, and their mutation status has been routinely used to guide clinical cancer therapies. We assessed >120 mutations for each of these genes (Figure 5, Figure S5, Table S1) in the two cell models, facilitating the development of new predictive biomarkers for existing clinical therapeutics.
Figure 5. Analysis of EGFR and BRAF mutation allelic series.
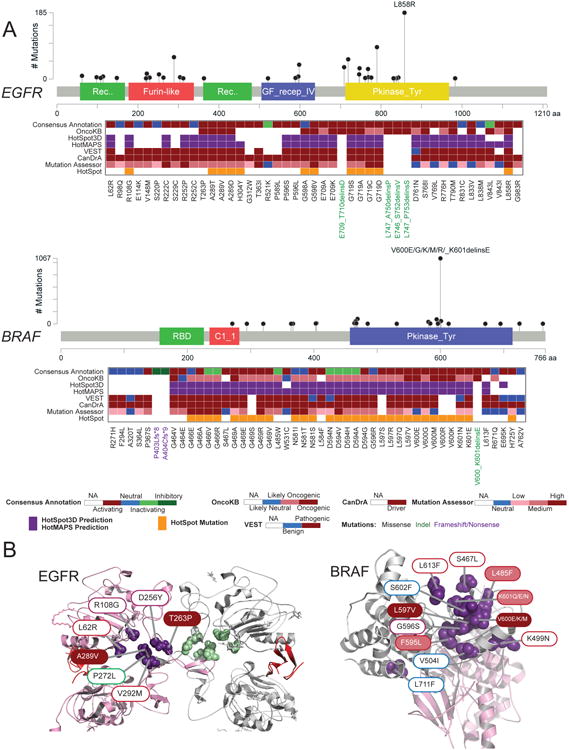
(A) Functional annotations of EGFR (top) and BRAF (bottom) allelic series. Only recurrent mutations of the series are shown. The frequency (based on TCGA and GENIE databases) and location of mutations tested are shown in lollipop plots. In the heatmap (from top to bottom), the consensus functional annotation, OncoKB annotation, computational prediction by 3D structural cluster (HotSpot3D, HotMAPs), population-based (VEST) cancer-focus (CanDrA), Mutation Assessor and hotspot predictions (based on Chang et al., 2016) of mutations tested in this study are shown. (B) Structural clusters of activating mutations in EGFR (left) and BRAF (right). Filled color and border color of the mutation label indicate the OncoKB annotation and our consensus functional annotation, respectively. See also Figure S5.
For EGFR, we used our platform to screen 138 mutations, including 12 indel, 1 frameshift and 8 silent mutations (Figure 5A, Figure S5A). We identified 71 activating mutations, including known driver hotspot mutations A289D/T/V, G719A/C/D/S and L858R. Among these mutations, 34 have been annotated in OncoKB, and 32 out of 34 (94.1%) were classified as oncogenic or likely oncogenic. The remaining 37 activating mutations were not annotated in OncoKB. Our study has therefore likely doubled the number of potential driver mutations in this therapeutically relevant gene. Importantly, 63 of the VUS assessed in EGFR are unlikely to engender sensitivity to therapeutics that target EGFR, enhancing our ability to stratify patients for the appropriate treatment regimens. Further, compared with non-hotspot mutations, we found that there was >2-fold enrichment in the likelihood that hotspot mutations are functional in the cell lines tested (Figure 5A, Figure S5A, Fisher's exact test, p < 0.001). However, most activating mutations identified were still of low frequency, highlighting the need to functionally annotate rare mutations identified in cancer tissues. Our data also showed that some rare functional mutations are only detected by 3D prediction algorithms and not by conventional algorithms. For example, L62R is neither annotated in OncoKB nor classified as hotspot (Figure 5A, Figure S5A). Although far away from any known driver in the linear protein sequence, L62R clustered with three oncogenic mutations (R108K, T263P and A289V) based on HotMAPS and HotSpot3D prediction (Figure 5B).
Since exon 19 deletions and exon 21 mutations (L858R) are FDA-approved predictive biomarkers for afatinib and erlotinib in metastatic non-small cell lung cancer, any other activating mutations in exons 19 and 21 may be potential predictive biomarkers for these agents. We examined 7 exon 19 indels and 25 missense mutations (5 in exon 19, 20 in exon 21) using our platform (Figure S5A). All 7 indels and 12 missense mutations (2 in exon 19 and 10 in exon 21) were activating, including L858R, which suggests their potential as predictive biomarkers for EGFR tyrosine kinase inhibitors. Apart from the deletions in exon 19, 3 deletions in exon 20 were annotated as activating. Thus these newly identified mutations should be considered as potential predictive biomarkers for EGFR inhibitors.
For BRAF, we screened 129 mutations, including 7 indel, 2 frame-shift and 2 silent mutations (Figure 5A, Figure S5B). Among them, 54 mutations were annotated as activating, including well-known V600 mutations. Of the 31 aberrations annotated in OncoKB, 29 (93.5%) were annotated as oncogenic and likely oncogenic, and the 23 remaining mutations are UVS. Similar to EGFR, although an enrichment of activating mutations in hotspots was observed, a number of functional mutations were not hotspots. From 3D predictions, novel activating mutations (e.g., L613F and S467L) were found in a cluster with well-known driver mutations, but they are far apart in the linear sequence (Figure 5B). BRAF inhibitors (vemurafenib or dabrafenib) alone or combined with MEK inhibitors (trametinib) are FDA approved for treating melanoma with BRAFV600 mutations. Since several activating mutations were in the same structural cluster with V600 (Figure 5B), the possibility of using the V600 clustered activating mutations as predictive biomarkers for BRAF inhibitors is worthy of further assessment.
Web Portal for Exploring Functional Effects of Cancer Somatic Mutations
In order to facilitate the broad use of our resource, we developed a user-friendly, interactive and open-access web portal, FASMIC (Functional Annotation of Somatic Mutations in Cancer), for querying and visualizing mutation associated data in a comprehensive manner (http://bioinformatics.mdanderson.org/main/FASMIC). All our assayed mutations have been curated in FASMIC, which currently includes six modules: summary, 3D structure, literature, mutation frequency, function prediction and protein expression (Figure 6A). To find a mutation, users can first query its gene symbol in the input box and select the matched gene to show all related mutations (Figure 6B). All the queried mutations are displayed in a table view along with basic information for each mutation, such as gene name, genomic location, amino acid change, and functional annotation. There are six modules under the table. i) “Summary” shows detailed information for the selected mutation, including genome build version, genomic coordinate, nucleotide change, variant classification, variant type, and functional annotations. ii) “3D structure” uses dynamic 3D animation to show the location of the queried mutation in a 3D protein structure (Figure 6C). iii) “Mutation frequency” displays the mutation frequency obtained from TCGA mutation data in a bar plot (Figure 6D). iv) “Function prediction” provides function predictions made by popular computational algorithms (Figure 6E). v) “Protein expression” provides rich protein expression data of the MCF10A lines altered by mutations compared to the wild-type genes, helping to interpret the specific functional consequences of the mutant (Figure 6F). vi) “PubMed” provides all related PubMed references in a list view. The portal also provides cell viability data supporting the functional annotation.
Figure 6. Overview of FASMIC portal.

(A) Data portal summary. (B) Mutation table of EGFR. (C) The 3D protein structure of p110α (encoded by PIK3CA) with residue K111 highlighted in red. (D) Bar plot of mutational frequency in different cancer types. (E) Functional predictions of various computational algorithms shown in a table with damaging mutations highlighted in dark red. (F) Differential protein expression profile of an EGFR mutant related to the wild-type gene is displayed in a sorted scatter plot.
Discussion
High-throughput functional screenings of mutations using in vivo screening in a pooled format have identified a number of rare oncogenic mutations. However, it remains unclear whether the results are affected by competition between mutations with different driver activities. In vivo screening of individual mutations has been shown to identify weak mutations (Kim et al., 2016), but it is too time-consuming and labor-intensive to use in screening large numbers of mutations. To address these problems and obtain reasonable throughput, we tested mutations individually in a moderate-throughput platform. Comparing to OncoKB, our platform captured more known oncogenic mutations (80.9%) than the two in vivo pooled screens (30.3% and 40.9%) (Berger et al., 2016, Kim et al., 2016) (Figure 3A, Figure S3C). Furthermore, mutations in tumor suppressor genes such as PTEN and CDKN2A can be screened in our platform but not in the in vivo screening setting. In our platform, PTEN and CDKN2A wild-type genes demonstrated cell growth inhibition. Out of 24 PTEN mutations tested, 9 truncation mutations and 12 missense mutations caused loss of the inhibiting property of the wild-type gene. Similarly in CDKN2A, the only frame-shift mutation (L78Hfs*41) out of 4 mutations assessed caused loss of the inhibiting property of the wild-type gene. Our data clearly demonstrate that our platform can screen functional mutations in selected tumor suppressor genes.
Sensitivity and specificity in functional annotation are trade-offs. Along with increased sensitivity to capture activating mutations, one concern for our platform is potential false positives. In the present study, we assessed the functional effects of 27 silent mutations, none of which were different from the corresponding wild-type, suggesting a high specificity. Further, only six activating mutations we captured are annotated as likely neutral in OncoKB. However, OncoKB is a purely literature-based database, which is heavily biased toward oncogenic mutations and the number of likely neutral mutations present is limited. Assessment of the false-positive rate of our platform cannot be done with the OncoKB database alone and should be addressed with other experimental-based functional annotation databases when they are available in the future. Overall, 75.7% of functional annotations of mutations are consistent between the Ba/F3 and MCF10A models, which limits the potential for false positives. Only 22 weak activating mutations identified in the Ba/F3 model were not confirmed as activating in the MCF10A model, which indicates they are potential false positives. To evaluate our functional annotations for these 22 mutations, we looked for evidence supporting their activating property from knowledge-based databases (OncoKB and PCT), computational predictions (CanDrA and CHASM, which are the best preforming algorithms based on our data) and 3D predictions (HotMAPS and HotSpot3D). Among the 22 weak activating mutations, 18 mutations were supported as activating mutations from at least one of the above evidence-based sources (STAR Methods and Table S3). Thus, the number of potential false-positive annotations obtained from our platform could be as low as 4 out of 301 (1.3%) activating mutations. Moreover, a recent study (Watanabe-Smith et al., 2017) suggested that Ba/F3 cells transfected with weak activating mutations can acquire extra mutations on the transgene during prolonged culturing under IL-3-replete conditions. Importantly, each of our constructs was from an individual clone and was sequenced prior to use, which limited the potential for pre-existing mutations in the construct. In addition, IL-3 was not added after transduction and our assays were limited to 3 weeks, which further reduced the potential for acquired mutations.
We recognize additional limitations of our platform. First, the size of the genes tested in the platform is restricted by the lentivirus packaging limit of 4.5 kb. Second, the effects of some mutations may strongly depend on tumor context. To limit this concern we employed two cell models with totally different genetic backgrounds and further our previous studies have shown that Ba/F3 and MCF10A results can be largely recapitulated in relevant human cell lines and xenograft models (Cheung et al., 2014; Dogruluk et al., 2015; Liang et al., 2012). Our data showed that 24 non-informative genes in the Ba/F3 model were informative in the MCF10A model, while 6 non-informative genes in the MCF10A model were informative in the Ba/F3 model. The well-known tumor suppressor gene IDH1 was tested in our platform and had no activity of the wild-type gene as well as all mutations tested. That suggested some genes need to be assessed in other tumor tissue-specific contexts to elucidate their function. The functional effects of those genes or mutations would have been missed in our platform. Third, we only assessed the effects on cellular viability and proliferation. However, these are hallmarks of cancer and represent the key targets of most therapeutic approaches. Finally, we note that pooled screening and in particular in vivo pooled screening have benefits in terms of scale and cost and capturing the effects of tumor microenvironment. Thus, our approach and the pooled screening approaches are complementary, collectively providing the most valuable information to the research community.
Star Methods
Contact for Reagent and Resource sharing
Further information and requests for resources and reagents should be directed to and will be fulfilled by the Lead Contact, Han Liang (HLiang1@mdanderson.org).
Experimental Model and Subject Details
Tissue Culture Cells
LentiX-293T cells (Clontech) were cultured in DMEM (with high glucose, glutamine and sodium pyruvate) with 5% FBS and 1× non-essential amino acid. LentiX-293T cells were used to make lentivirus. Ba/F3 cells are murine pro-B suspension cells that depend on exogenous IL-3 for cell survival. Growth medium for Ba/F3 cells was advanced RPMI with 1× GlutaMAX, 5% FBS and 1 ng/ml mouse IL-3. Assay medium for Ba/F3 was growth medium without IL-3. MCF10A cells are human non-tumorigenic mammary epithelial cells that depend on exogenous EGF and insulin for proliferation. Growth medium for MCF10A cells was DMEM/F12 medium with 5% HS, 20 ng/ml EGF, 0.5 mg/ml hydrocortisone, 100 ng/ml cholera toxin, 10 μg/ml insulin, 1× Pen/strep. Assay medium for MCF10A cells was MEBM basal medium (Lonza #CC-3151) with 100 ng/ml cholera toxin and 52 ng/ml bovine pituitary extract (BPE) (Lonza #CC-4009).
Method Details
Construction of lentivirus vector by HiTMMoB
The lentivirus vector of barcoded wild-types, mutations, fusion genes and controls were constructed with pHAGE-EF1α-GFP or pHAGE-EF1α-PURO backbone by High-Throughput Mutagenesis and Molecular Barcoding (HiTMMoB) technique as described previously (Dogruluk et al., 2015; Tsang et al., 2016; Lu et al., 2017). The ORF entry clones used were from Life Technologies or the ORFeome 8.1 (http://horfdb.dfci.harvard.edu/). All ORF sequences were shown in Table S1. All mutant clones were full-length sequenced before assays to ensure that no unwanted mutation was introduced comparing to template ORFs. Mutant and wild-type constructs are made available through Addgene for sharing with the cancer research community.
Ba/F3 and MCF10A Growth-Factor Independence Assay
To assess the function of the candidates, two growth-factor–dependent cell models, Ba/F3 and MCF10A cell models, were used. Both cell types stop proliferating and die in the absence of the required factor(s). The rationale is that a “driver” mutation will confer survival and proliferation advantages to the cells in the absence of required growth factor(s), but “passenger” mutations will not. The mutation candidates were put into both cell models with various types of controls. First, two experimental negative controls (GFP, mCherry or Luciferase) and three experimental positive controls (PIK3CA wild-type, M1043I and H1047R) with different activities (i.e., wild-type < M1043I < H1047R) served as technical controls to check if the experiments performed well. Second, mutations and their corresponding wild-type counterparts were assessed in parallel in the same experiment, the latter of which determined the basal activity of the genes in the cell models. Third, for selected genes, silent and literature-reported driver mutations were used as additional controls to determine the basal and activated activities of the genes, respectively. In total, 1049 mutations were tested in batches, with up to 33 mutations per batch. In each experiment (i.e., batch), the set of 5 experimental controls (2 negative and 3 positive) and corresponding wild-type clones were included. Additional silent and gene-specific positive mutations were also included if available.
For each experiment, pHAGE constructs of mutants and wild-type genes were freshly prepared from a single colony and used for generating lentivirus for Ba/F3 and MCF10A transduction. Lentivirus was generated in the LentiX-293T cells by transfecting the pHAGE and two packaging plasmids (psPAX2 and pMD2.G). The medium of the transfected cells was refreshed at 16 hours post-transfection. The virus was harvested at 3 days post-transfection by filtering with 0.45 μM filter. Ba/F3 cells (0.6 million cells) were transduced by spinoculation at 1000× g for 3 hours in the presence of polybrene (final concentration: 8 μg/ml). After spinning, cells were resuspended in the Ba/F3 assay medium in a 24-well plate format. For MCF10A cells, 5,000 cells were seeded into 96-well plates 1 day before transduction and transduced by spinoculation at 906× g for 2 hours in the presence of polybrene (final concentration: 2.7 μg/ml). The medium was refreshed after spinoculation with the MCF10A assay medium. Transduced cells were incubated at 37°C for 3 weeks. Cell viability of Ba/F3 and MCF10A cells was measured at 4 time points (at intervals of 3 or 4 days) during the 3-week assay period. The functional annotations of mutations were based on a comparison to the corresponding wild-type clones (Figure S2A).
In vivo Pooled Screening
Barcoded mutations and wild-type counterparts were transduced into Ba/F3 cells by lentivirus individually, and transduced cells were expanded in puromycin-selective conditions for a week until reaching enough cells for injection to mice. Cells were injected (s.c.) into the mice. Tumors were harvested within 50 days depending on the size of tumors. Barcodes were sequenced. Oncogenicity of mutations were presented by enrichment of corresponding barcodes in the harvested tumors compared to input at the injection day.
Comparison to OncoKB Annotation, Literature Mining and Computational Predictions
To compare our functional annotation to the previous in vivo studies (Berger et al., 2016; Kim et al., 2016), we first identified the mutations commonly assayed between our platform and the previous studies, in which 21 and 14 shared mutations, respectively. To compare our annotation with OncoKB, we downloaded the mutation annotation from http://oncokb.org, and identified 193 common mutations, among which 95 are oncogenic, 83 are likely oncogenic and 15 are likely neutral. To compare our functional annotation with predicted mutational impacts from commonly used algorithms, we tested 21 algorithms for 913 point mutations. Except for CanDrA plus and CHASM (Douville et al., 2013), we obtained the other 19 algorithms from dbNSFP (Liu et al., 2016). The ROC curves were generated based on the ranking scores defined in dbNSFP.
To evaluate whether any given mutations had been reported in the literature, we used gene symbols and amino acid changes as keywords to query PubMed. We calculated the proportion of our tested mutations that were reported in specific genes. In addition, mutations curated by the OncoKB and PCT databases were included for comparison.
Reverse-Phase Protein Arrays
Cell pellets were washed twice with PBS and lysed (1% Triton X-100, 50 mM HEPES, pH 7.4, 150 mM NaCl, 1.5 mM MgCl2 1 mM EGTA, 100 mM NaF, 10 mM Na pyrophosphate, 1 mM Na3VO4, 10% glycerol, protease and phosphatase inhibitors). Protein concentration was adjusted to 1-1.5 μg/μl and denatured by 1% SDS. Cell lysates were two-fold serial diluted for 5 dilutions (from undiluted to 1:16 dilution) and arrayed on nitrocellulose-coated slides in 11×11 format. Samples were probed with antibodies by the CSA amplification approach and visualized by DAB colorimetric reaction.
Slides were scanned on a flatbed scanner to produce 16-bit tiff images. Spots from tiff images were identified and density quantified by Array-Pro Analyzer. Relative protein levels for each sample were determined by interpolation of each dilution curve from the “standard curve” (Supercurve) of the slide (antibody). Supercurve was constructed using a script written in R (“Supercurve Fitting”, http://bioinformatics.mdanderson.org/Software/supercurve). Each dilution curve was fitted with a logistic regression model. This fit a single curve using all the samples (i.e., dilution series) on a slide with the signal intensity as the response variable and the dilution steps as the independent variable. The fitted curve (“Supercurve”) was plotted with the signal intensities on the y-axis and the relative log2 concentration of each protein on the x-axis using the non-parametric, monotone increasing B-spline model. During the process, the raw spot intensity data were adjusted to correct for spatial bias before model fitting. A quality control metric was returned for each slide to help determine the quality of the slide: if the score was less than 0.8 on a 0-1 scale, the slide was dropped. In most cases, the staining was repeated to obtain a high-quality score.
The protein concentrations of each set of slides were then normalized by median polish, which was corrected across samples by the linear expression values using the median expression levels of all antibody experiments to calculate a loading correction factor for each sample. These values (given as log2 values) are defined as Supercurve log2 (raw) values. All the data points were normalized for protein loading.
Pathway Score Analysis
For each sample j in a pathway k, pathway scores (Skj) were calculated based on the z-scores (Zi) of each protein member i using the formula (Akbani et al., 2014), described below, where Wki is the weight for each protein i in the pathway k, and ‖Pk‖ represents the number of proteins in pathway k. The pathway protein members and their corresponding weights were obtained from the previous studies.
Text Mining of Cancer Mutations
To evaluate whether a specific mutation had been reported in literature, we used gene symbols and amino acid changes as keywords to query the PubMed. We calculated the proportion of mutations that were reported by the end of 2016. This process was performed by the R package ‘RISmed’. Mutations curated by the OncoKB database and PCT (www.personalizedcancertherapy.org) were also included for comparative purposes.
Pfam Domain and Hotspot Analysis
Protein sequences of these genes were obtained by using R package ‘biomaRt’. We mapped Pfam domains to the genes using HMMER (Finn et al., 2011) and obtained the presence of a Pfam domain and the corresponding range (start and end residues). Mutations were mapped relative to the range of the Pfam domains to determine whether a mutation was inside a Pfam domain or not. Fisher's exact test was used to assess the difference of the proportion of functional mutations in versus outside the Pfam domains. In addition, we calculated the proportion of functional mutations mapped to hotspots and non-hotspots, and used Fisher's exact test to assess the difference.
Structural Analysis and Lollipop Plots
To evaluate whether the mutations were located on the surface or core of a protein, protein sequences were subjected to the NetSurfP program (Petersen et al., 2009), and the relative surface accessibility (RSA) and absolute surface accessibility (ASA) scores were retrieved for each protein residue. We then mapped mutations to the protein sequence to obtain the related scores for each mutation, and assessed the score differences for functional and non-functional mutations by the Wilcoxon rank-sum test.
We downloaded all mutation data of EGFR and BRAF from cBioPortal in all TCGA and GENIE cancer samples and identified 252 mutations for functional annotation. We next calculated the number of mutated samples for each mutation. The lollipop plots were generated using MutationMapper (Vohra and Biggin, 2013). The heatmaps for mutations in hotspots or reported in the literature were plotted using the R package ‘pheatmap’.
3D Structural Predictions for Mutation Impact
HotSpot3D was run on mutations from the MC3 MAF as well as the mutations that were validated to see which mutation clusters were on the protein structure (Niu et al., 2016). The default HotSpot3D parameters were used, and only missense mutations and in-frame insertions/deletions were clustered. Mutations that were labeled as both a deletion and insertion were removed and were not clustered. For the resulting clusters, the cluster closeness was calculated, which was simply the sum of the closeness centralities of the mutations in the cluster. Closeness centrality is a measure of how close a mutation is to other mutations as well as how close a mutation is to a highly recurrent mutation. We identified clusters that were from known cancer genes as previously defined (Tamborero et al., 2013). The top 20% of cluster closeness values of the cancer gene distribution was used as a threshold to determine the significance (Cc >8.2). Using the same MC3 MAF file, HotMAPS v1.1.0 was used in each cancer type and all cancer types grouped together (“PANCAN”), as described previously (Tokheim et al., 2016), to generate hotspot regions, and estimate the background distribution of mutational density in protein structures. Only missense mutations were mapped to available protein structures and homology models using the MuPIT database (Niknafs et al., 2013). We then mapped missense mutations to the same set of protein structures, and mutational densities were calculated based on the TCGA data. HotMAPS detects whether mutated amino acid residues have higher three dimensional mutation density then expected by chance. Since the assay was not cancer-type specific, we took the minimum p value across cancer types and PANCAN as representative of each residue. We assigned all mutations occurring at the same amino acid residue the same p value. Statistical significance was established at a threshold false discovery rate of 0.01 (Benjamini-hochberg method). Only mutations in clusters with the significance above the thresholds were highlighted in the heatmaps in Figure 5 and Figure S5. For visualization of clusters, we utilized Protein Data Bank (PDB) structures 3NJP for EGFR and 4MBJ for BRAF in Figure 5B. Mutations assayed by 3D Hotspots were annotated with http://www.3dhotspots.org.
FASMIC Data Portal Construction
The FASMIC web interface was implemented in JavaScript. All data used in FASMIC were curated in a CouchDB database; tabular results were displayed by DataTables; box and scatter plots were generated by HighCharts; protein 3D structure information was obtained from PDB and visualized by 3Dmol.js (Rego and Koes, 2015).
Quantification and Statistical Analysis
Definition of significance of various statistical tests were described and referenced in their respective Method Details sections.
Data and Software Availability
Functional annotation and cell viability data for each mutation and RPPA protein profiles of selected mutations are available in the FASMIC Data portal (http://bioinformatics.mdanderson.org/main/FASMIC).
Supplementary Material
Table S1, related to Figure 1. Genomic aberrations tested in this study. Provided as an Excel file.
Table S2, related to Figure 2. Selected mutations and wild-types tested in independent repeat experiments. Provided as an Excel file.
Table S3, related to Figure 3. Additional information about mutations mentioned in Figure S3A to S3C and weak activating mutations in Ba/F3. Provided as an Excel file.
Table S4, related to Figure 4. Pathway score membership and weighting. Provided as an Excel file.
Highlights.
Developed a versatile functional genomic platform for somatic mutation annotation
Annotated >1000 genomic aberrations, doubling the number of known driver mutations
Assessed performance of existing algorithms for mutation functional predictions
Built a user-friendly, open-access data portal for community-based investigation
Significance.
Recent sequencing studies have identified thousands of unique somatic mutations across patient tumors, the vast majority of which are cancer variants of unknown significance. Importantly, diverse mutations in the same gene could have distinct functional effects in cancer development and drug response. Using a versatile, sensitive functional genomic approach, we systematically assess the effects of a large number of somatic alterations on cell viability and downstream signaling. We identify many potential driver mutations that had not been characterized. Our results and the related bioinformatics data portal represent a valuable resource to improve patient care and therapy development.
Acknowledgments
This study was supported by the U . S . National Institutes of Health (CA168394, CA098258, CA143883 and HG008100 to G.B.M., CA175486 to H.L., CA209851 to H.L. and G.B.M., CA176284 and CA70907 to A.F.G. and J.D.M, CA204817 to R.K., CA200266 to C.T., and Cancer Center Support Grant CA016672); grants from the Cancer Prevention and Research Institute of Texas (RP140462 to H.L., RR160021 to N.S., and RP150535 to F.M.); and the Adelson Medical Research Foundation (to G.B.M.), and Hong Kong Research Grants Council (27103616) and National Natural Science Foundation of China (81703066) to L.W.T.C., and sponsored research funding provided by AstraZeneca UK Limited to G.B.M. We acknowledge the American Association for Cancer Research and its financial and material support in the development of the AACR Project GENIE registry, as well as members of the consortium for their commitment to data sharing, and LeeAnn Chastain for editorial assistance. This manuscript is dedicated to Honey Badger.
Footnotes
Author Contributions: Sahni N, Liang H and Mills GB supervised the whole project; Scott KL, Meric-Bernstam F, Yi S, Sahni N, Liang H and Mills GB conceived of and designed the study; Ng P, Li J, Jeong KJ, Chen H, Sengupta S, Wang Z, Minussi D, Gao J, Tokheim C, Zhou D, Johnson AM, Zeng J, Ju Z, Li Y, Vellano C, Schultz N, Karchin R, Ding L, Chen K, Yi S, Sahni N, Liang H and Mills GB contributed to the data analysis; Ng P, Li J, Jeong KJ, Shao S, Tsang S, Bhavana VH, Tran R, Soewito S, Moreno D, Kong K, Shaw K., Dogruluk T, Lu H, Ip CKM, Wester M, Yu S, Lu Y, Cheung LWT, Shaw KR, Meric-Bernstam F, Scott KL, Yi S, Sahni N, Liang H and Mills GB contributed to the experiments; Li J and Chen H implemented the web portal. Ng P, Li J, Yi S, Sahni N, Liang H and Mills GB wrote the manuscript, with input from the other authors.
Declaration of Interests: G.B.M. is on the Scientific Advisory Board for AstraZeneca, ImmunoMet, Nuevolution and Precision Medicine; and H.L. is a shareholder and on the Scientific Advisory Board for Precision Scientific Ltd. This study is related to US Patent Application Serial No.: US 2016/0122825 A1.
Publisher's Disclaimer: This is a PDF file of an unedited manuscript that has been accepted for publication. As a service to our customers we are providing this early version of the manuscript. The manuscript will undergo copyediting, typesetting, and review of the resulting proof before it is published in its final citable form. Please note that during the production process errors may be discovered which could affect the content, and all legal disclaimers that apply to the journal pertain.
References
- Akbani R, Ng PK, Werner HM, Shahmoradgoli M, Zhang F, Ju Z, Liu W, Yang JY, Yoshihara K, Li J, et al. A pan-cancer proteomic perspective on The Cancer Genome Atlas. Nature communications. 2014;5:3887. doi: 10.1038/ncomms4887. [DOI] [PMC free article] [PubMed] [Google Scholar]
- Berger AH, Brooks AN, Wu X, Shrestha Y, Chouinard C, Piccioni F, Bagul M, Kamburov A, Imielinski M, Hogstrom L, et al. High-throughput Phenotyping of Lung Cancer Somatic Mutations. Cancer cell. 2016;30:214–228. doi: 10.1016/j.ccell.2016.06.022. [DOI] [PMC free article] [PubMed] [Google Scholar]
- Bustamante CD, Townsend JP, Hartl DL. Solvent accessibility and purifying selection within proteins of Escherichia coli and Salmonella enterica. Molecular biology and evolution. 2000;17:301–308. doi: 10.1093/oxfordjournals.molbev.a026310. [DOI] [PubMed] [Google Scholar]
- Cancer Genome Atlas Research, N. Weinstein JN, Collisson EA, Mills GB, Shaw KR, Ozenberger BA, Ellrott K, Shmulevich I, Sander C, Stuart JM. The Cancer Genome Atlas Pan-Cancer analysis project. Nature genetics. 2013;45:1113–1120. doi: 10.1038/ng.2764. [DOI] [PMC free article] [PubMed] [Google Scholar]
- Carter H, Douville C, Stenson PD, Cooper DN, Karchin R. Identifying Mendelian disease genes with the variant effect scoring tool. BMC genomics. 2013;14 Suppl 3:S3. doi: 10.1186/1471-2164-14-S3-S3. [DOI] [PMC free article] [PubMed] [Google Scholar]
- Carter H, Karchin R. Predicting the functional consequences of somatic missense mutations found in tumors. Methods in molecular biology. 2014;1101:135–159. doi: 10.1007/978-1-62703-721-1_8. [DOI] [PubMed] [Google Scholar]
- Chakravarty D, Gao J, Philips SM, Kundra R, Zhang H, Wang J, Rudolph JE, Yaeger R, Soumerai T, Nissan MH, et al. OncoKB: A Precision Oncology Knowledge Base. JCO Precision Oncology. 2017 doi: 10.1200/PO.17.00011. in press. [DOI] [PMC free article] [PubMed] [Google Scholar]
- Chang MT, Asthana S, Gao SP, Lee BH, Chapman JS, Kandoth C, Gao J, Socci ND, Solit DB, Olshen AB, et al. Identifying recurrent mutations in cancer reveals widespread lineage diversity and mutational specificity. Nature biotechnology. 2016;34:155–163. doi: 10.1038/nbt.3391. [DOI] [PMC free article] [PubMed] [Google Scholar]
- Cheung LW, Hennessy BT, Li J, Yu S, Myers AP, Djordjevic B, Lu Y, Stemke-Hale K, Dyer MD, Zhang F, et al. High frequency of PIK3R1 and PIK3R2 mutations in endometrial cancer elucidates a novel mechanism for regulation of PTEN protein stability. Cancer discovery. 2011;1:170–185. doi: 10.1158/2159-8290.CD-11-0039. [DOI] [PMC free article] [PubMed] [Google Scholar]
- Cheung LW, Yu S, Zhang D, Li J, Ng PK, Panupinthu N, Mitra S, Ju Z, Yu Q, Liang H, et al. Naturally occurring neomorphic PIK3R1 mutations activate the MAPK pathway, dictating therapeutic response to MAPK pathway inhibitors. Cancer cell. 2014;26:479–494. doi: 10.1016/j.ccell.2014.08.017. [DOI] [PMC free article] [PubMed] [Google Scholar]
- Dogruluk T, Tsang YH, Espitia M, Chen F, Chen T, Chong Z, Appadurai V, Dogruluk A, Eterovic AK, Bonnen PE, et al. Identification of Variant-Specific Functions of PIK3CA by Rapid Phenotyping of Rare Mutations. Cancer research. 2015;75:5341–5354. doi: 10.1158/0008-5472.CAN-15-1654. [DOI] [PMC free article] [PubMed] [Google Scholar]
- Douville C, Carter H, Kim R, Niknafs N, Diekhans M, Stenson PD, Cooper DN, Ryan M, Karchin R. CRAVAT: cancer-related analysis of variants toolkit. Bioinformatics. 2013;29:647–648. doi: 10.1093/bioinformatics/btt017. [DOI] [PMC free article] [PubMed] [Google Scholar]
- Finn RD, Clements J, Eddy SR. HMMER web server: interactive sequence similarity searching. Nucleic acids research. 2011;39:W29–37. doi: 10.1093/nar/gkr367. [DOI] [PMC free article] [PubMed] [Google Scholar]
- Gao J, Chang MT, Johnsen HC, Gao SP, Sylvester BE, Sumer SO, Zhang H, Solit DB, Taylor BS, Schultz N, et al. 3D clusters of somatic mutations in cancer reveal numerous rare mutations as functional targets. Genome medicine. 2017;9:4. doi: 10.1186/s13073-016-0393-x. [DOI] [PMC free article] [PubMed] [Google Scholar]
- Jaiswal BS, Kljavin NM, Stawiski EW, Chan E, Parikh C, Durinck S, Chaudhuri S, Pujara K, Guillory J, Edgar KA, et al. Oncogenic ERBB3 mutations in human cancers. Cancer cell. 2013;23:603–617. doi: 10.1016/j.ccr.2013.04.012. [DOI] [PubMed] [Google Scholar]
- Kandoth C, McLellan MD, Vandin F, Ye K, Niu B, Lu C, Xie M, Zhang Q, McMichael JF, Wyczalkowski MA, et al. Mutational landscape and significance across 12 major cancer types. Nature. 2013;502:333–339. doi: 10.1038/nature12634. [DOI] [PMC free article] [PubMed] [Google Scholar]
- Kim E, Ilic N, Shrestha Y, Zou L, Kamburov A, Zhu C, Yang X, Lubonja R, Tran N, Nguyen C, et al. Systematic Functional Interrogation of Rare Cancer Variants Identifies Oncogenic Alleles. Cancer discovery. 2016;6:714–726. doi: 10.1158/2159-8290.CD-16-0160. [DOI] [PMC free article] [PubMed] [Google Scholar]
- Kohsaka S, Nagano M, Ueno T, Suehara Y, Hayashi T, Shimada N, Takahashi K, Suzuki K, Takamochi K, Takahashi F, et al. A method of high-throughput functional evaluation of EGFR gene variants of unknown significance in cancer. Sci Transational Med. doi: 10.1126/scitranslmed.aan6566. in press. [DOI] [PubMed] [Google Scholar]
- Kurnit KC, Bailey AM, Zeng J, Johnson AM, Shufean MA, Brusco L, Litzenburger BC, Sanchez NS, Khotskaya YB, Holla V, Simpson A, Mills GB, Mendelsohn J, Bernstam E, Shaw K, MericBernstam F. “Personalized Cancer Therapy”: A publically available precision oncology resource. Cancer research. 2017;77:e123–126. doi: 10.1158/0008-5472.CAN-17-0341. [DOI] [PMC free article] [PubMed] [Google Scholar]
- Li J, Zhao W, Akbani R, Liu W, Ju Z, Ling S, Vellano CP, Roebuck P, Yu Q, Eterovic AK, et al. Characterization of Human Cancer Cell Lines by Reverse-phase Protein Arrays. Cancer cell. 2017;31:225–239. doi: 10.1016/j.ccell.2017.01.005. [DOI] [PMC free article] [PubMed] [Google Scholar]
- Liang H, Cheung LW, Li J, Ju Z, Yu S, Stemke-Hale K, Dogruluk T, Lu Y, Liu X, Gu C, et al. Whole-exome sequencing combined with functional genomics reveals novel candidate driver cancer genes in endometrial cancer. Genome research. 2012;22:2120–2129. doi: 10.1101/gr.137596.112. [DOI] [PMC free article] [PubMed] [Google Scholar]
- Liu X, Wu C, Li C, Boerwinkle E. dbNSFP v3.0: A One-Stop Database of Functional Predictions and Annotations for Human Nonsynonymous and Splice-Site SNVs. Hum Mutat. 2016;37:235–241. doi: 10.1002/humu.22932. [DOI] [PMC free article] [PubMed] [Google Scholar]
- Mao Y, Chen H, Liang H, Meric-Bernstam F, Mills GB, Chen K. CanDrA: cancer-specific driver missense mutation annotation with optimized features. PloS one. 2013;8:e77945. doi: 10.1371/journal.pone.0077945. [DOI] [PMC free article] [PubMed] [Google Scholar]
- Niknafs N, Kim D, Kim R, Diekhans M, Ryan M, Stenson PD, Cooper DN, Karchin R. MuPIT interactive: webserver for mapping variant positions to annotated, interactive 3D structures. Human genetics. 2013;132:1235–1243. doi: 10.1007/s00439-013-1325-0. [DOI] [PMC free article] [PubMed] [Google Scholar]
- Niu B, Scott AD, Sengupta S, Bailey MH, Batra P, Ning J, Wyczalkowski MA, Liang WW, Zhang Q, McLellan MD, et al. Protein-structure-guided discovery of functional mutations across 19 cancer types. Nature genetics. 2016;48:827–837. doi: 10.1038/ng.3586. [DOI] [PMC free article] [PubMed] [Google Scholar]
- Petersen B, Petersen TN, Andersen P, Nielsen M, Lundegaard C. A generic method for assignment of reliability scores applied to solvent accessibility predictions. BMC structural biology. 2009;9:51. doi: 10.1186/1472-6807-9-51. [DOI] [PMC free article] [PubMed] [Google Scholar]
- Porta-Pardo E, Kamburov A, Tamborero D, Pons T, Grases D, Valencia A, Lopez-Bigas N, Getz G, Godzik A. Comparison of algorithms for the detection of cancer drivers at subgene resolution. Nature methods. 2017;14:782–788. doi: 10.1038/nmeth.4364. [DOI] [PMC free article] [PubMed] [Google Scholar]
- Rego N, Koes D. 3Dmol.js: molecular visualization with WebGL. Bioinformatics. 2015;31:1322–1324. doi: 10.1093/bioinformatics/btu829. [DOI] [PMC free article] [PubMed] [Google Scholar]
- Sahni N, Yi S, Zhong Q, Jailkhani N, Charloteaux B, Cusick ME, Vidal M. Edgotype: a fundamental link between genotype and phenotype. Current opinion in genetics & development. 2013;23:649–657. doi: 10.1016/j.gde.2013.11.002. [DOI] [PMC free article] [PubMed] [Google Scholar]
- Scott KL, Powers S. Functionally Assessing Candidate Drivers Advances Precision Cancer Medicine. Cancer cell. 2016;30:187–189. doi: 10.1016/j.ccell.2016.07.011. [DOI] [PubMed] [Google Scholar]
- Takiar V, Ip CK, Gao M, Mills GB, Cheung LW. Neomorphic mutations create therapeutic challenges in cancer. Oncogene. 2017;36:1607–1618. doi: 10.1038/onc.2016.312. [DOI] [PMC free article] [PubMed] [Google Scholar]
- Tamborero D, Gonzalez-Perez A, Perez-Llamas C, Deu-Pons J, Kandoth C, Reimand J, Lawrence MS, Getz G, Bader GD, Ding L, et al. Comprehensive identification of mutational cancer driver genes across 12 tumor types. Scientific reports. 2013;3:2650. doi: 10.1038/srep02650. [DOI] [PMC free article] [PubMed] [Google Scholar]
- Thorpe LM, Spangle JM, Ohlson CE, Cheng H, Roberts TM, Cantley LC, Zhao JJ. PI3K-p110alpha mediates the oncogenic activity induced by loss of the novel tumor suppressor PI3K-p85alpha. PNAS. 2017;114:7095–7100. doi: 10.1073/pnas.1704706114. [DOI] [PMC free article] [PubMed] [Google Scholar]
- Tokheim C, Bhattacharya R, Niknafs N, Gygax DM, Kim R, Ryan M, Masica DL, Karchin R. Exome-Scale Discovery of Hotspot Mutation Regions in Human Cancer Using 3D Protein Structure. Cancer research. 2016;76:3719–3731. doi: 10.1158/0008-5472.CAN-15-3190. [DOI] [PMC free article] [PubMed] [Google Scholar]
- Tsang YH, Dogruluk T, Tedeschi PM, Wardwell-Ozgo J, Lu H, Espitia M, Nair N, Minelli R, Chong Z, Chen F, et al. Functional annotation of rare gene aberration drivers of pancreatic cancer. Nature communications. 2016;7:10500. doi: 10.1038/ncomms10500. [DOI] [PMC free article] [PubMed] [Google Scholar]
- Vohra S, Biggin PC. Mutationmapper: a tool to aid the mapping of protein mutation data. PloS one. 2013;8:e71711. doi: 10.1371/journal.pone.0071711. [DOI] [PMC free article] [PubMed] [Google Scholar]
- Wang Z, Moult J. SNPs, protein structure, and disease. Human mutation. 2001;17:263–270. doi: 10.1002/humu.22. [DOI] [PubMed] [Google Scholar]
- Warmuth M, Kim S, Gu XJ, Xia G, Adrian F. Ba/F3 cells and their use in kinase drug discovery. Current opinion in oncology. 2007;19:55–60. doi: 10.1097/CCO.0b013e328011a25f. [DOI] [PubMed] [Google Scholar]
- Watanabe-Smith K, Godil J, Agarwal A, Tognon C, Druker B. Analysis of acquired mutations in transgenes arising in Ba/F3 transformation assays: findings and recommendations. Oncotarget. 2017;8:12596–12606. doi: 10.18632/oncotarget.15392. [DOI] [PMC free article] [PubMed] [Google Scholar]
- Wong WC, Kim D, Carter H, Diekhans M, Ryan MC, Karchin R. CHASM and SNVBox: toolkit for detecting biologically important single nucleotide mutations in cancer. Bioinformatics. 2011;27:2147–2148. doi: 10.1093/bioinformatics/btr357. [DOI] [PMC free article] [PubMed] [Google Scholar]
- Yi S, Lin S, Li Y, Zhao W, Mills GB, Sahni N. Functional variomics and network perturbation: connecting genotype to phenotype in cancer. Nature reviews Genetics. 2017;18:395–410. doi: 10.1038/nrg.2017.8. [DOI] [PMC free article] [PubMed] [Google Scholar]
Associated Data
This section collects any data citations, data availability statements, or supplementary materials included in this article.
Supplementary Materials
Table S1, related to Figure 1. Genomic aberrations tested in this study. Provided as an Excel file.
Table S2, related to Figure 2. Selected mutations and wild-types tested in independent repeat experiments. Provided as an Excel file.
Table S3, related to Figure 3. Additional information about mutations mentioned in Figure S3A to S3C and weak activating mutations in Ba/F3. Provided as an Excel file.
Table S4, related to Figure 4. Pathway score membership and weighting. Provided as an Excel file.