Abstract
MitoSOX-based assays are widely used to detect mitochondrial reactive oxygen species (ROS), especially superoxide. To this end, 5 μM MitoSOX is commonly used. In this ROS Protocols article, we described the flow cytometric protocol involving the use of various concentrations of MitoSOX (1, 2.5, 5 μM) for detecting mitochondrial ROS in control and mitochondrial DNA-deficient (MD) melanoma B16-F10 cells. We also compared the MitoSOX-based flow cytometry with lucigenin-derived chemiluminometry for their ability to reliably detect the relative differences in mitochondrial ROS formation in the control and MD cells. Our results suggested that 1 μM, rather than the commonly used 5 μM, appeared to be the optimal concentration of MitoSOX for detecting mitochondrial ROS via flow cytometry.
Keywords: B16-F10 melanoma cells, Chemiluminometry, Flow cytometry, Mitochondrial DNA-deficient cells, Mitochondrial ROS, MitoSOX
1. OVERVIEW
Detection and measurement of the rate of fluxes of individual reactive oxygen species (ROS), especially superoxide, in intracellular compartments is instrumental in understanding the biological activities of the specific ROS. In this context, mitochondria have been identified as a major source of cellular superoxide. Over the past three decades, a number of assays and techniques have been developed to detect and/or quantify mitochondrial superoxide/ROS formation. Among them, the MitoSOX-based assays and the lucigenin-derived chemiluminometry (LDCL) are notable examples [1, 2].
For the above two assays, 5 μM MitoSOX and 5–100 μM lucigenin are commonly used in cellular systems to detect mitochondrial superoxide/ROS formation. However, concerns have been raised regarding the potential diffusion of MitoSOX from the mitochondrial compartment to the cytosol when the probe is used at 5 μM, thereby making the assay non-selective for detecting mitochondrial superoxide/ROS [3]. In addition, MitoSOX at the conventionally used concentrations (e.g., 5 μM) also disrupted the mitochondrial electron transport chain, adding to the complexity in data interpretation [3]. Likewise, the LDCL assay has been criticized for the potential of lucigenin to undergo redox cycling at high concentrations, especially in cell-free and physiologically irrelevant artificial systems [4].
In this article, we characterized the use of various concentrations of MitoSOX in flow cytometric detection of mitochondrial superoxide in control and mitochondrial DNA-deficient melanoma B16-F10 cells. The results of MitoSOX assay were also compared with those from LDCL to determine the reliability of the assays in detecting the relative changes in mitochondrial superoxide formation.
2. METHOD PRINCIPLES
2.1. General Principles of Fluorescence-Based Techniques
Fluorescence is the emission of light that occurs within nanoseconds after the absorption of light (i.e., excitation) that is typically of shorter wavelength [5]. The maximum emission wavelength is denoted as λem and the maximum excitation wavelength as λex. The λem and λex vary with different fluorescent molecules, which serve as the basis for detecting fluorescent substances. Fluorescence can be detected by fluorescence spectrophotometry (also known as fluorometry), visualized by fluorescence microscopy (i.e., fluorescence imaging), or perhaps more commonly by flow cytometry. Indeed, flow cytometry has become one of the most commonly used techniques in biomedical research.
Regardless of the instruments used, the techniques involve using a beam of light (ultraviolet or visible light) that excites the fluorescent molecules and causes them to emit light of a lower energy, typically, but not necessarily, visible light. For detecting ROS by fluorescence-based methods, a fluorescence-based detecting probe is incubated with the ROS-generating system (e.g., enzymes, cells, tissues), and the fluorescence of the reaction product is detected to determine the relative amounts of ROS. In general, most of the available fluorescence-based ROS-detecting probes are non-fluorescent or weakly fluorescent, but yield fluorescent products upon reacting with ROS.
Fluorescence-based probes permit ROS detection with much higher sensitivity than other techniques such as ultraviolet/visible (UV/Vis) spectrophotometry. In addition, fluorescence microscopy-based imaging allows in situ visualization of ROS formation in cells or tissues, and on the other hand, flow cytometry-based measurement provides dynamic information on cell populations. Limited selectivity for different reactive species is often a major disadvantage of the fluorescence-based techniques in detecting ROS production in biological systems. Nevertheless, when used appropriately and especially when combined with other assays, fluorescence-based flow cytometry can yield important information on the formation of ROS.
2.2. Assay Principle of MitoSOX-Based Flow Cytometry
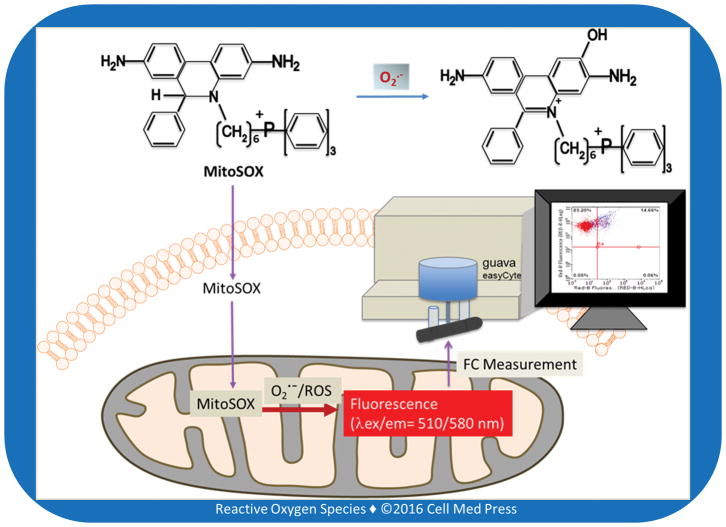
Dihydroethidium, also called hydroethidine (HE), can be oxidized by reactive species, including superoxide to ethidium that subsequently binds to DNA to produce fluorescence. More recently, the derivative of dihydroethidium bearing a cationic triphenylphosphonium moiety, commonly known as MitoSOX Red or Mito-HE, or more frequently called MitoSOX, has been synthesized and become commercially available (e.g., Thermo Fisher, Waltham, MA USA). This positively charged probe rapidly accumulates in mitochondria, and as such may be used to detect superoxide/ROS production inside mitochondria via fluorometry, microscopy, or flow cytometry (Figure 1). In fact, fluorescence imaging of the dihydroethidium/MitoSOX-stained cells or tissues has been claimed as a selective assay for intracellular and intra-mitochondrial superoxide production [6, 7], but this claim has received criticism [8]. Nevertheless, measurement of MitoSOX-derived fluorescence intensity, when the probe is used at appropriate concentrations, seems to be reflective of the levels of mitochondrial total ROS.
FIGURE 1. Schematic illustration of MitoSOX-based flow cytometry (FC) for detecting mitochondrial ROS/superoxide.
The positive charge of MitoSOX is responsible for its intra-mitochondrial accumulation.
3. MATERIALS AND INSTRUMENTS
3.1. Major Materials
The major materials for the assays described in the article are listed below.
B16-F10 melanoma cells: from American Type Culture Collection (ATCC, Manassas, VA, USA) (CRL-6475); B16-F10 cells were initiated derived from melanoma in C57BL/6 mice.
Complete phosphate-buffered saline (CPBS): investigator-prepared; components include 8.1 mM Na2HPO4, 1.47 mM KH2PO4, 138 mM NaCl, 2.67 mM KCl, 0.5 mM MgCl2, 0.7 mM CaCl2, and 0.1% glucose, pH 7.4.
Lucigenin (bis-N-methylacridinium nitrate): from Sigma-Aldrich (St. Louis, MO, USA) (M8010); lucigenin is soluble in water and its molecular mass is 510.50.
MitoSOX: from Thermo Fisher (Waltham, MA, USA) (M36008); each vial contains 50 μg; MitoSOX is soluble in dimethyl sulfoxide (DMSO) and its molecular mass is 759.71.
Phosphate-buffered saline (PBS): investigator prepared; components include 8.1 mM Na2HPO4, 1.47 mM KH2PO4, 138 mM NaCl, 2.67 mM KCl, pH 7.4.
3.2. Major Instruments
EMD Millipore Guava easyCyte 5 flow cytometer
Luminometers: Berthold LB9505 Multi-Channel Biolumat
Water bath or dry bath
Cell culture equipment (CO2 incubator, tissue culture hood, centrifuge, microscope, etc.)
4. PROTOCOLS AND STEPS
4.1. Assay Layout
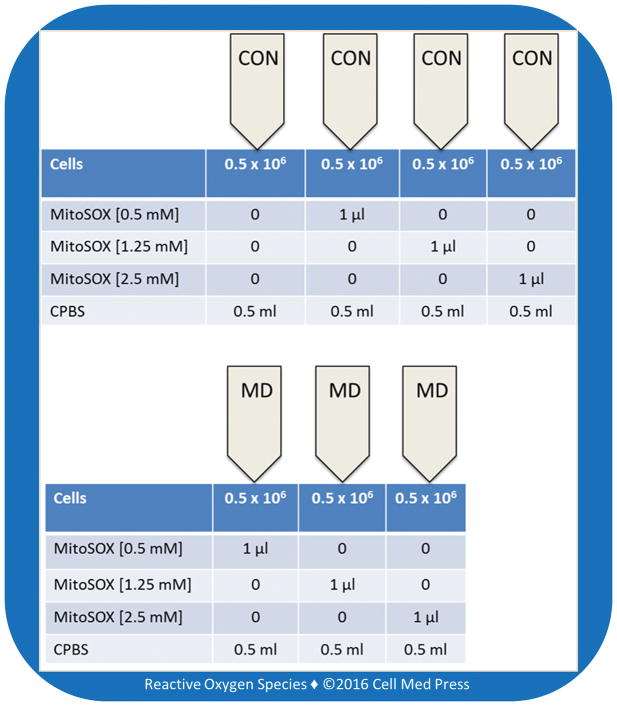
Figure 2 illustrates the assay layout for MitoSOX-based flow cytometry.
FIGURE 2. Assay layout for MitoSOX-based flow cytometric detection of mitochondrial ROS in control (CON) and mitochondrial DNA-deficient (MD) B16-F10 melanoma cells.
Each tube contains 0.5 × 10⁶ cells. The CON tube without MitoSOX serves as the cell auto-fluorescence. In experiments, each MitoSOX concentration was tested in duplicate.
4.2. Assay Description
MitoSOX-based flow cytometric assay is used to detect mitochondrial ROS in control and mitochondrial DNA-deficient (MD) melanoma B16-F10 cells. For creation of MD cells, B16-F10 cells are cultured in the presence of 50 ng/ml of ethidium bromide for 12 weeks. Both control and MD cells are cultured in Dulbecco’s modified Eagle medium (DMEM) supplemented with 10% fetal bovine serum (FBS), 100 units/ml of penicillin, and 100 μg/ml of streptomycin in 150 cm2tissue culture flasks at 37°C in a humidified atmosphere of 5% CO2. The cells are fed every 2–3 days, and subcultured once they reach 80–90% confluence. For flow cytometric measurement, the cells are harvested from the cultures and washed once in supplemented DMEM. As many as 0.5 × 10⁶ cells are suspended in 0.5 ml of supplemented DMEM in an Eppendorf tube containing various concentrations of MitoSOX (1, 2.5, 5 μM), and the Eppendorf tube is immediately transferred to a shaking, 37°C water bath, protected from light, for 20 min. The cells are then washed gently three times with 37°C-prewarmed PBS, mixed gently between each wash, and then resuspended in warm CPBS for detection. Briefly, the Eppendorf tube is transferred to a Guava easyCyte 5 single sample flow cytometer for recording the mean fluorescence intensity and percentage of stained cells. The results are expressed as a dot plot and histogram of the cell count of cell fluorescence emission, representing the size of the cell population emitting the corresponding fluorescence, and as a bar graph representing the mean fluorescence intensity of both the control and mitochondrial DNA-deficient B16-F10 cells.
For LDCL assay, as many as 1 × 10⁶ cells are suspended in 1 ml CPBS in a chemiluminescence (CL) tube containing various concentrations of lucigenin (20, 50, 100 μM) and the CL tube is immediately transferred to a Berthold LB9505 luminometer for recording the CL response at 37°C for 60 min. The results are expressed as the real-time photon emission curve (CL response) and the integrated CL response (the area under the curve, representing the total counts of photon emission over the 60 min of incubation time).
4.3. Preparation of Reagents
MitoSOX reagent solution (2.5 mM in DMSO): 50 μg MitoSOX dissolved in 26 μl DMSO (store at −20°C).
MitoSOX reagent solution (1.25 mM in DMSO): 50 μg MitoSOX dissolved in 52 μl dimethyl sulfoxide (store at −20°C).
MitoSOX reagent solution (0.5 mM in DMSO): 50 μg MitoSOX dissolved in 130 μl DMSO (store at −20°C).
4.4. Steps
Aliquot 0.5 × 10⁶ cells (control and MD cells) into each of the 7 Eppendorf tubes in a final volume of 0.5 ml CPBS.
Add 1 μl DMSO to tube 1 (as control for background fluorescence); add 1 μl of 0.5 mM MitoSOX to tubes 2 and 3 (duplicate, the final concentration of MitoSOX = 1 μM); add 1 μl of 1.25 mM MitoSOX to tubes 4 and 5 (duplicate, the final concentration of MitoSOX = 2.5 μM); and add 1 μl of 2.5 mM MitoSOX to tubes 6 and 7 (duplicate, the final concentration of MitoSOX = 5 μM).
Incubate all 7 tubes in a shaking, 37°C water bath for 20 min. This incubation time can be increased to 40 min depending on experiments.
Remove from water bath and add 0.5 ml of 37°C-prewarmed air-saturated CPBS to all 7 tubes followed by centrifugation to pellet the cells and discard the buffer. Repeat this step twice.
Add 0.5 ml of 37°C-prewarmed air-saturated CPBS to all 7 tubes to resuspend the cells (0.5 × 10⁶ cells in each tube).
Transfer the entire cell suspension in tube 1 to the flow cytometer measurement tube 1 immediately followed by mixing of the sample and recording of the response. Do the same for the remaining 6 samples.
4.5. Calculations
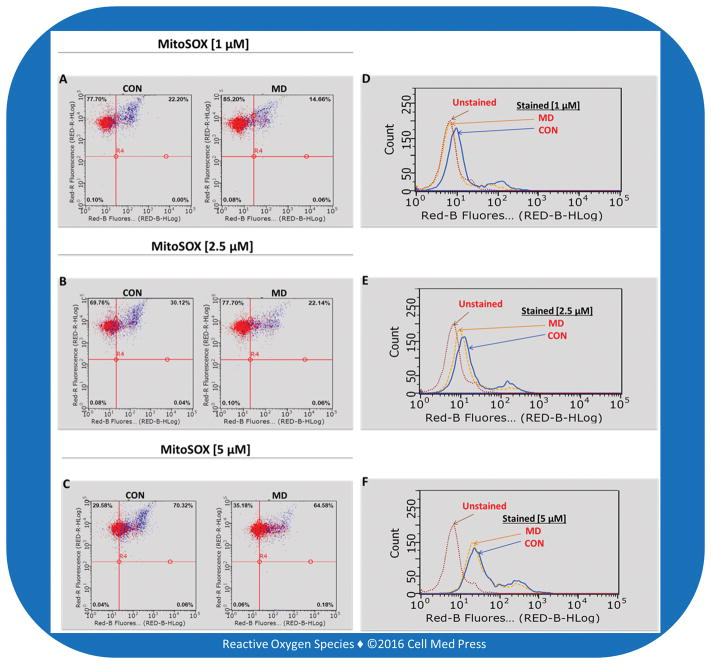
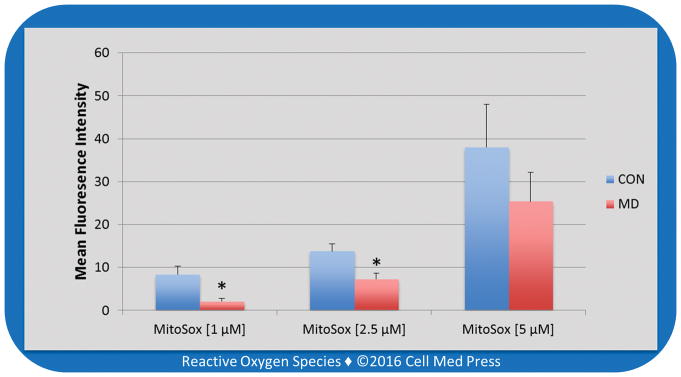
The Guava easyCyte 5 single sample flow cytometer enables real-time measurement of the fluorescence emission from a sample which is reported as (1) dot plots (Figure 3A–3C) measuring the percentage of MitoSOX stained cells emitting fluorescence (upper right quadrant) with units of the Y and X axis being excitation by the Red A laser (690/50 nm) and Red B laser (640 nm), respectively; (2) histograms (Figure 3D–3F) with units of the Y and X axis being counts of fluorescence emission and Red B laser (640 nm), respectively; and (3) bar graph of the mean fluorescence intensity (Figure 4) with units of the Y and X axis being mean fluorescence intensity and MitoSOX concentration, respectively. For the bar graphs, data represent means ± SD from 3 experiments.
FIGURE 3. MitoSOX-based flow cytometric detection of mitochondrial ROS production in control (CON) and mitochondrial DNA-deficient (MD) B16-F10 cells.
Left panels show dot plots and right panels show the corresponding histograms.
FIGURE 4. Mean fluorescence intensity detected by MitoSOX-based flow cytometry with various MitoSOX concentrations in control (CON) and mitochondrial DNA-deficient (MD) B16-F10 cells.
Data represent means ± SD (n = 3). *, p < 0.05, compared to the corresponding control (CON) group.
4.6. Other Considerations
The MitoSOX-based flow cytometric assay was used to detect ROS production in control (CON) and MD melanoma B16-F10 cells with various concentrations (1, 2.5, 5 μM) of MitoSOX. There was a lower percentage of cells (Figure 3A–3C, right upper quadrant of the dot plot) emitting fluorescence by the MD cells for all three of the concentrations of MitoSOX compared to CON cells. In addition, the count of cells for the CON population emitted a higher fluorescence than that of the MD population of cells (Figure 3D–3F) for all three of the concentrations of MitoSOX, further depicting the trend of MD cells emitting lower fluorescence than that of the CON cells.
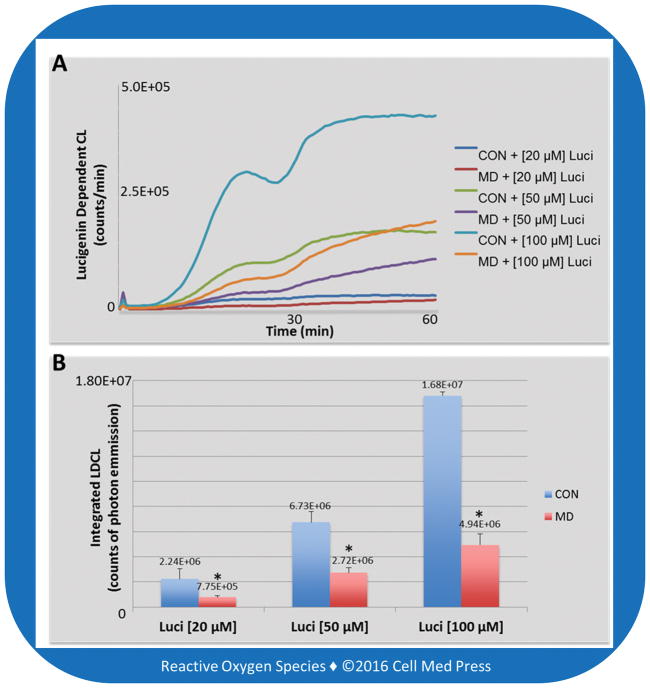
The LDCL can be employed to detect the real-time formation of cellular/mitochondrial superoxide formation (Figure 5A). The LDCL assay with various concentrations of lucigenin (20, 50, 100 μM) resulted in data depicting counts of photon emissions per min for 60 min by CON and MD cells (Figure 5), which further showed the trend of less photon emission by MD cells, indicating less superoxide production in MD cells than in CON cells. Notably, the relative differences (~3-fold) between CON and MD cells were independent of the lucigenin concentrations used, supporting the validity of this assay in detecting cellular/mitochondrial superoxide [2].
FIGURE 5. Lucigenin-derived chemiluminescence in control (CON) and mitochondrial DNA-deficient (MD) B16-F10 cells.
Panel A shows the real-time photon emission indicative of cellular/mitochondrial superoxide formation. Panel B shows total photon emission over 60 min, indicative of total amounts of cellular/mitochondrial superoxide production. Data represent means ± SD (n = 3). *, p < 0.05, compared to the corresponding control (CON) group.
In contrast to differences revealed by the LDCL assay, the differences between CON and MD cells obtained from the MitoSOX assay were dependent on the concentrations of MitoSOX used. In this regard, a ~3-fold difference in mean fluorescence intensity was seen with 1 μM MitoSOX, a ~2-fold difference seen with 2.5 μM MitoSOX, and no statistically significant difference seen with 5 μM MitoSOX (Figure 4). Likewise, as shown in Figure 3D, with 1 μM concentration of MitoSOX the curve depicting the count of fluorescence emitted by MD cells shifted left on the X axis, nearly superimposing the unstained cells. It is noteworthy that each increase in the concentration of MitoSOX decreased the differences between the CON and MD curves of fluorescence emitting cells (Figure 3E–3F), indicating less difference between the estimated amount of ROS production in CON and MD cells. This dependency on MitoSOX concentrations makes the MitoSOX assay less reliable in assessing the relative differences in ROS formation between different samples, compared with the LDCL assay.
Mitochondria are the major source of ROS; however, large amounts of ROS are also present outside of the mitochondrial compartment due to the diffusion of mitochondria-derived ROS into the cytosol as well as the in situ cytosolic ROS production. It is possible that increased MitoSOX concentrations may lead to the increased accumulation of the probe in the cytosol [3], and its subsequent extra-mitochondrial oxidation, thereby preventing the exclusive detection of ROS production inside the mitochondria. When determining the relative difference in mitochondrial ROS production between control and mitochondrial DNA-deficient cells, it is essential to use a MitoSOX concentration that selectively detects ROS generated inside the mitochondria.
5. DISCUSSION OF ADVANTAGES AND LIMITATIONS
MitoSOX is among the most commonly used probe for detecting cellular ROS. MitoSOX accumulates in mitochondria due to its positive charge, and MitoSOX-based assays, especially flow cytometry, have been frequently used to detect mitochondrial ROS formation in cells under various conditions. MitoSOX-based flow cytometry provides an easy, quick, and inexpensive way of detecting mitochondrial ROS production in cells.
Although superoxide appears to be the major ROS oxidizing MitoSOX in the mitochondrial compartment, MitoSOX-based assays do not selectively detect mitochondrial superoxide formation. However, when used under appropriate conditions (as demonstrated in this article), MitoSOX-based assays can be used to also selectively detect mitochondrial ROS production. In combination with a superoxide-specific scavenger, such as the recently reported superoxide dismutase mimetic hydrophilic carbon clusters [9, 10], MitoSOX-based assays may be used to selectively determine mitochondrial superoxide.
Our data suggested that the commonly used 5 μM concentration of MitoSOX might lead to the underestimation of the relative differences in mitochondrial ROS formation between different samples. This is in line with early observations that high concentrations (e.g., 5 μM) of MitoSOX may adversely affect the mitochondrial electron transport chain and lead to diffusion of MitoSOX from the mitochondrial compartment into the cytosol [3]. While the optimal concentrations of MitoSOX in detecting mitochondrial ROS remain to be further determined, 1 μM of MitoSOX appears to be able to more reliably detect the relative differences in mitochondrial ROS formation between control and mitochondrial DNA-deficient cells. It is thus suggested that various concentrations of MitoSOX be used and the results be compared with other ROS-detecting assays. This would allow obtaining an optimal concentration of MitoSOX to reliably detect mitochondrial ROS production.
6. CONCLUSION
MitoSOX-based flow cytometry is a quick, simple, and inexpensive method for detecting cellular ROS. If the probe is used at an optimal concentration, MitoSOX-based flow cytometry can reliably detect the relative differences in mitochondrial ROS formation in cells. It is suggested that 1 μM, instead of 5 μM, of MitoSOX be used as the working concentration for detecting mitochondrial ROS levels. It should be mentioned that MitoSOX-based flow cytometry does not selectively detect superoxide and neither does it measure the amounts of ROS. However, when a selective superoxide scavenger is used, the assay can yield data on the relative amounts of mitochondrial superoxide production under different experimental conditions or between different samples.
Acknowledgments
The work was supported in part by a grant from the U.S. National Institutes of Health/National Cancer Institute (CA192936) and an investigator-initiated grant (IIG) (09A084) from the American Institute for Cancer Research (AICR). Melinda K. Kauffman is currently an undergraduate student. Megan E. Kauffman is currently a medical student.
ABBREVIATIONS
- CL
chemiluminescence
- CPBS
complete phosphate-buffered saline
- DMSO
dimethyl sulfoxide
- HE
hydroethidine
- LDCL
lucigenin-derived chemiluminescence or chemiluminometry
- MD
mitochondrial DNA-deficient
- PBS
phosphate-buffered saline
- ROS
reactive oxygen species
References
- 1.Mukhopadhyay P, Rajesh M, Hasko G, Hawkins BJ, Madesh M, Pacher P. Simultaneous detection of apoptosis and mitochondrial superoxide production in live cells by flow cytometry and confocal microscopy. Nat Protoc. 2007;2(9):2295–301. doi: 10.1038/nprot.2007.327. [DOI] [PMC free article] [PubMed] [Google Scholar]
- 2.Li Y, Zhu H, Kuppusamy P, Roubaud V, Zweier JL, Trush MA. Validation of lucigenin (bis-N-methylacridinium) as a chemilumigenic probe for detecting superoxide anion radical production by enzymatic and cellular systems. J Biol Chem. 1998;273(4):2015–23. doi: 10.1074/jbc.273.4.2015. [DOI] [PubMed] [Google Scholar]
- 3.Roelofs BA, Ge SX, Studlack PE, Polster BM. Low micromolar concentrations of the superoxide probe MitoSOX uncouple neural mitochondria and inhibit complex IV. Free Radic Biol Med. 2015;86:250–8. doi: 10.1016/j.freeradbiomed.2015.05.032. [DOI] [PMC free article] [PubMed] [Google Scholar]
- 4.Liochev SI, Fridovich I. Lucigenin (bis-N-methylacridinium) as a mediator of superoxide anion production. Arch Biochem Biophys. 1997;337(1):115–20. doi: 10.1006/abbi.1997.9766. [DOI] [PubMed] [Google Scholar]
- 5.Lichtman JW, Conchello JA. Fluorescence microscopy. Nat Methods. 2005;2(12):910–9. doi: 10.1038/nmeth817. [DOI] [PubMed] [Google Scholar]
- 6.Robinson KM, Janes MS, Pehar M, Monette JS, Ross MF, Hagen TM, et al. Selective fluorescent imaging of superoxide in vivo using ethidium-based probes. Proc Natl Acad Sci USA. 2006;103(41):15038–43. doi: 10.1073/pnas.0601945103. [DOI] [PMC free article] [PubMed] [Google Scholar]
- 7.Robinson KM, Janes MS, Beckman JS. The selective detection of mitochondrial superoxide by live cell imaging. Nat Protoc. 2008;3(6):941–7. doi: 10.1038/nprot.2008.56. [DOI] [PubMed] [Google Scholar]
- 8.Zielonka J, Kalyanaraman B. Hydroethidine- and MitoSOX-derived red fluorescence is not a reliable indicator of intracellular superoxide formation: another inconvenient truth. Free Radic Biol Med. 2010;48(8):983–1001. doi: 10.1016/j.freeradbiomed.2010.01.028. [DOI] [PMC free article] [PubMed] [Google Scholar]
- 9.Samuel EL, Marcano DC, Berka V, Bitner BR, Wu G, Potter A, et al. Highly efficient conversion of superoxide to oxygen using hydrophilic carbon clusters. Proc Natl Acad Sci USA. 2015;112(8):2343–8. doi: 10.1073/pnas.1417047112. [DOI] [PMC free article] [PubMed] [Google Scholar]
- 10.Bird HZ, Hopkins RZ. Nanomaterials for selective superoxide dismutation. Reactive Oxygen Species. 2016;1(1):59–64. doi: 10.20455/ros.2016.811. [DOI] [Google Scholar]


