Abstract
Introduction:
This study is a follow-up to prior research from our group that attempts to relate noise exposure and hearing thresholds in active performing musicians of the National Ballet of Canada Orchestra.
Materials and Methods:
Exposures obtained in early 2010 were compared to exposures obtained in early 2017 (the present study). In addition, audiometric thresholds obtained in early 2012 were compared to thresholds obtained in early 2017 (the present study). This collection of measurements presents an opportunity to observe the regularities in the patterns of exposure as well as threshold changes that may be expected in active orchestra musicians over a 5-year span.
Results:
The pattern of noise exposure across instrument groups, which was consistent over the two time points, reveals highest exposures among brass, percussion/basses, and woodwinds. However, the average noise exposure across groups and time was consistently below 85 dBA, which suggests no occupational hazard. These observations were corroborated by audiometric thresholds, which were generally (a) in the normal range and (b) unchanged in the 5-year period between measurements.
Conclusion:
Because exposure levels were consistently below 85 dBA and changes in audiometric thresholds were minimal, we conclude that musicians experienced little-to-no risk of noise-induced hearing loss.
Keywords: Hearing loss, noise exposure, symphonic orchestra
Introduction
Qian et al.[1] conducted a noise exposure survey on performing musicians of the National Ballet of Canada Orchestra. The survey was executed using dosimeters running for the entire duration of rehearsals and performances of the ballet Romeo and Juliet by Sergei Prokofiev. On the basis of measured levels and contractual limitations on playing time (360 h/year), the authors concluded that there was little-to-no risk of hearing loss associated with playing in the orchestra. However, the authors also acknowledged that the assessment of noise exposure might not be sufficient to make conclusions regarding risk to hearing health because of other types of noise exposures, not taken into account. Given the challenge of fully accounting for all possible types of noise exposure, another valuable way to address the occupational risks of musicians is to perform audiometric tests.
As a follow-up to the original study, Russo et al.[2] performed audiometric tests on the same population. Musicians were also asked to complete a questionnaire to obtain information about basic demographics and extra-occupational factors that might impact measured hearing thresholds. The objective was to gather all information necessary to predict hearing loss according to the International Organization for Standardization (ISO) 1999 standard.[3] For the study, musicians were divided into five groups exposed to the sound of similar characteristics. Brass, percussion/basses, and woodwinds all had higher levels of exposure than violins, violas, and cellos. There was essentially no difference between predicted and measured hearing losses at 3000, 4000, and 8000 Hz, while predicted hearing losses were underestimated at lower frequencies.
These findings are generally consistent with other noise-exposure surveys[4] and audiometric investigations.[5] However, the study by Russo et al.[2] study did provide reason for some concern about long-term hearing health, especially in brass players who had the highest levels of exposure and the poorest hearing thresholds. Nonetheless, it is important to acknowledge that at the time of testing, none of the groups had clinically significant hearing losses.
Present Study
The present study represents a follow-up involving the same orchestral musicians tested by Russo et al.[2] The orchestra experienced minimal turnover in the period since the previous study allowing for meaningful comparisons across time points. The present study was divided into two parts.
The first part consisted of a noise exposure survey during 12 rehearsals and performances of the ballet Le Petit Prince with music by Kevin Lau. This piece of music is intended to be performed with lower sound levels than the Romeo and Juliet piece used in the previous study. We replicated the noise survey technique using noise dosimeters, which were recording for the entire duration of the piece (approximately 2.5 h) allowing for the determination of real noise exposure levels. Dosimeters were worn by different participants on different occasions. To assess the variations of the exposure between performances or rehearsals, some musicians donned the dosimeters more than once.
The second part of the follow-up study comprised hearing tests on all musicians. As in the previous study, we performed air conduction tests from 500 through 8000 Hz, to assess permanent threshold shifts that may have occurred since the time of last testing.
Noise Exposure Measurements
Instruments and procedure
Noise exposure tests were conducted during 12 sessions of rehearsals and performances. Six dosimeters Casella Type Dbadge micro noise dosimeters were used. Unlike the instruments used in our prior studies,[1,2] the dosimeters used in the current study had the advantage of being lighter (71 g) and having an integrated microphone, thereby being generally less obtrusive.
The routine of the measurements started with the technicians calibrating the dosimeters and checking their batteries. The musicians who were assigned to dawn the dosimeters on a particular day were informed one day in advance. On the day of the performance, they had the dosimeter fitted and turned on prior to congregating in the pit. Instruments were worn all the time, including during the intermission. At the end of the session, dosimeters were collected and their readings recorded.
It is well known that violins and violas provide performing musicians with rather asymmetrical exposure with left ears receiving higher sound levels than right ears. Because musicians were fitted with only one dosimeter, this difference was not assessed.
Figure 1 shows a dosimeter attached to the shoulder of a musician. Figure 2 shows the floor plan of the pit, with the locations of the players, and Figure 3 shows a view of the orchestra pit.
Figure 1.
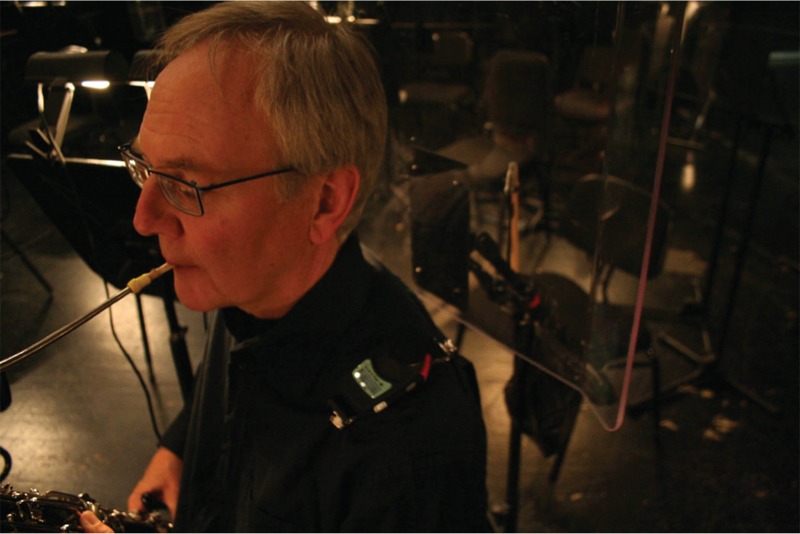
Musician wearing a dosimeter
Figure 2.
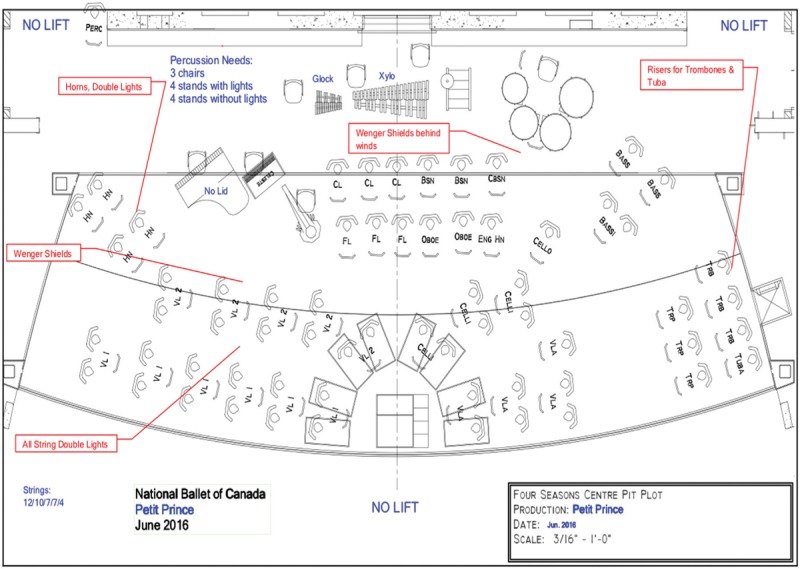
Floor plan of the pit
Figure 3.
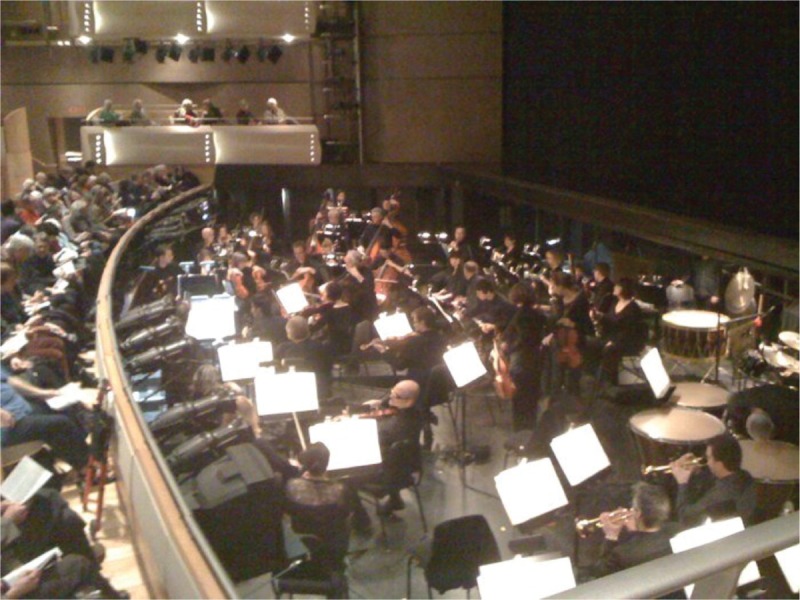
View of the pit
Results
The measured Leq were converted to Lx,360 to reflect the reduced number of exposure hours experienced by an orchestra musician, (The duration of orchestra-related activities is stipulated in the musicians’ contracts.) as compared to an industrial worker (i.e., 360 vs. 2000). The formula for the conversion was:
Lx,360 = Leq = 10 × Log10(360/2000),dB (1)
This conversion amounts to an overall reduction of measured Leq of approximately 7.5 dB. As in Russo et al.,[2] we divided musicians into five groups on the basis of their location in the pit and the frequency content of their instruments: (1) violin I and violin II; (2) viola and cello; (3) woodwinds; (4) brass; (5) percussion and basses. Descriptive noise exposure statistics for each group are reported in Table 1.
Table 1.
Noise exposure (Lx,360) across each of the five groups
| Group # | 1 | 2 | 3 | 4 | 5 |
|---|---|---|---|---|---|
| Instruments | Violins (1 and 2) | Viola/cello | Woodwinds | Brasses | Percussion/basses |
| Average | 77.5 | 78.7 | 82 | 81.7 | 79.9 |
| Standard error | 0.6 | 0.37 | 1 | 0.73 | 0.61 |
| Number of tests | 12 | 8 | 10 | 9 | 5 |
Figure 4 is a comparison of exposures, where “previous” refers to those from Russo et al.[2] and “present” refers to results obtained in the present study. Although the exposure levels were generally higher in the previous study (a performance of Romeo and Juliet), the players tended to report that differences in subjective sound level was negligible. Once again, highest exposure levels were observed in brass, woodwinds, and percussion/basses.
Figure 4.
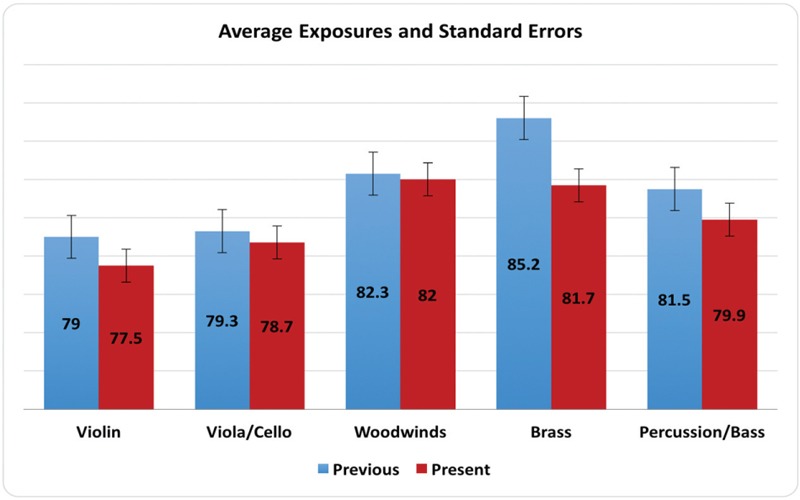
Average and standard error of exposure (Lx,360) across the five groups (1–violins, 2–viola/cello, 3–woodwinds, 4–brass, 5–percussion/basses)
Audiometric Measurements
Instruments and procedure
All 46 musicians who participated in this study had a full audiological workup and evaluation. This included a full history, assessment of both otologic health, otoscopy, and full range of clinical audiometry.
Admittance testing using Grason-Stadler Inc. (GSI) 39 Auto Tymp was included to rule out outer and middle ear disorders. Audiometry was performed using GSI16 clinical audiometer. Measurements were performed for the range 250–8000 Hz, including the 3000 and 6000 Hz inter-octave frequencies. Tests included word recognition assessment and speech detection thresholds. Both air conduction and bone conduction pure tone testing were performed to rule out any hearing loss that is conductive in nature.
All test equipment was calibrated and met national and international standards.[6,7] The audiometric test booth meets the American National Standards Institute (ANSI) S3.1 standard (1999, R2013).[8] The clinical audiometer is calibrated annually and meets the ANSI S3.6 standard (2004, R2010).[9]
For musicians for whom a prior audiogram was available, we computed the difference between thresholds obtained across the two time points.
In addition to a full clinical evaluation performed by the second author (MC is a board certified audiologist), each musician received both written and verbal information regarding hearing loss prevention. In some cases, musicians’ hearing protection was recommended and fit.
Results
Figure 5 plots the audiometric pure tone average thresholds for each group collapsed across ears. As may be seen in the figure, there is a consistent mid- to high-frequency sensory-neural hearing loss with poorest sensitivity in the 4000–6000 Hz region. This pattern of sensitivity is highly consistent with that reported in Russo et al.[2] and suggests early stage hearing losses.
Figure 5.
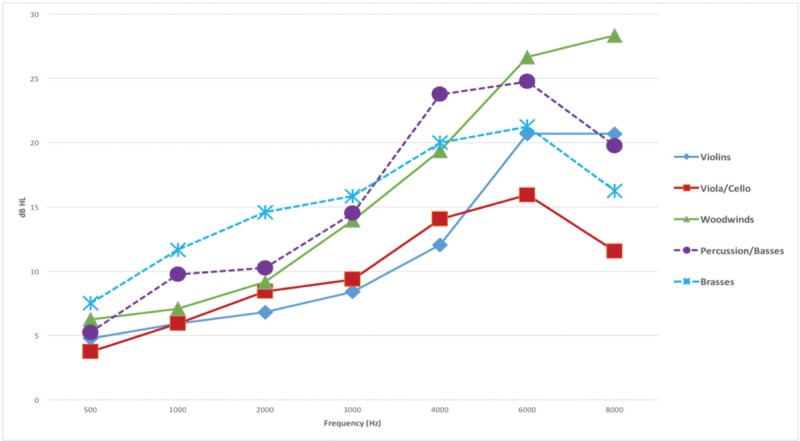
Average hearing loss in each group as assessed at test frequencies between 500 and 8000 Hz
The Canadian Standards Association (CSA) Z107.6 Standard Audiometric testing for use in hearing loss prevention programs[10] defines a significant threshold shift as:
an average shift of the hearing threshold levels at 2000, 3000, and 4000 Hz of ≥10 dB in either ear, or
a shift of the hearing threshold level of ≥15 dB at 3000 or 4000 in either ear.
Table 2 summarizes the significant threshold shifts observed in each group over the 5-year span since Russo et al.[2]
Table 2.
Threshold shifts based on comparison with Russo et al.[2]
| Instrument group | Total ears assessed | Number of people with insignificant shifts | Number of ears with insignificant shifts | Number of significant shifts |
|---|---|---|---|---|
| Violins (1) | 22 | 1 | 2 | 0 |
| Viola/cello (2) | 16 | 2 | 3 | 0 |
| Woodwinds (3) | 24 | 1 | 2 | 2 |
| Brasses (4) | 20 | 1 | 2 | 0 |
| Percussion/bass (5) | 10 | 3 | 5 | 1 |
| Total | 92 | 8 | 14 | 3 |
Conclusion
Across time points, exposure levels were highest across three instrument groups: brass, percussion/basses, and woodwinds. However, the exposure levels were consistently below 85 dBA and clinically significant changes that we observed in pure tone thresholds were minimal across groups. Furthermore, the small number of clinically significant changes are not clearly related to noise exposure. As a result, we conclude that the audiometric changes are most likely multifactorial in nature, likely to include occupational and non-occupational sources of noise, as well as aging. Nonetheless, in the present study as well as Russo et al.,[2] it was observed that those orchestral groups with the highest levels of exposure (brass, percussion/basses, and woodwinds) had the highest levels of hearing loss. Thus, it is entirely plausible that the occupational sources of noise represent a long-term hearing health risk for at least a subset of orchestra musicians.
Financial support and sponsorship
Nil.
Conflicts of interest
There are no conflicts of interest.
Acknowledgements
We thank Adam Pham and Yang Luo, students in Ryerson University’s Occupational Health and Safety Program, for their assistance with noise exposure measurements. We also thank Francesca Copelli for her assistance with formatting text and figures.
REFERENCES
- 1.Qian CL, Behar A, Wong W. Noise exposure of musicians of a ballet orchestra. Noise Health. 2011;13:59–63. doi: 10.4103/1463-1741.74002. [DOI] [PubMed] [Google Scholar]
- 2.Russo F, Behar A, Chasin M, Mosher S. Noise exposure and hearing loss in classical orchestra musicians. Int J Ind Ergon. 2013;43:474–8. doi: 10.4103/nah.NAH_39_17. [DOI] [PMC free article] [PubMed] [Google Scholar]
- 3.ISO 1999 (International Organization for Standardization), 1990. Acoustics: Determination of Occupational Noise Exposure and Estimation of Noise-induced Hearing Impairment. ISO TC/43 N1139. Revision of ISO 1999:1990. Second CD; March 2010. [Google Scholar]
- 4.Schmidt JH, Pedersen ER, Juhl PM, Christensen-Dlasgaard J, Andersen TD, Poulsen T, et al. Sound exposure of symphony orchestra musicians. Ann Occup Hyg. 2011;55:893–905. doi: 10.1093/annhyg/mer055. [DOI] [PubMed] [Google Scholar]
- 5.Jansen EJ, Helleman HW, Dreschler WA, de Laat JA. Noise induced hearing loss and other hearing complaints among musicians of symphony orchestras. Int Arch Occup Environ Health. 2009;82:153–64. doi: 10.1007/s00420-008-0317-1. [DOI] [PubMed] [Google Scholar]
- 6.ANSI/ASA S3.6-2010 American National Standard Specification for Audiometers. 2010. [Google Scholar]
- 7.ANSI/ASA S3.1-1999 (R 2013) American National Standard Maximum Permissible Ambient Noise Levels for Audiometric Test Rooms. 2008. [Google Scholar]
- 8.American National Standards Institute. Maximum Permissible Ambient Noise Levels for Audiometric Test Rooms. ANSI S3. 1–1999 (2013) New York: American National Standards Institute; 1999. [Google Scholar]
- 9.American National Standards Institute. Specification for Audiometers. ANSI S3.6-2004 (R2010) New York: American National Standards Institute; 2004. [Google Scholar]
- 10.CSA Z107.6 Standard. Audiometric Testing for Use in Hearing Loss Prevention Programs. Canadian Standard Institution; 2016. [Google Scholar]


