Abstract
Background & objectives:
India aspires to achieve universal health coverage, which requires ensuring financial risk protection (FRP). This study was done to assess the extent of out-of-pocket (OOP) expenditure and FRP for hospitalization in Haryana State, India. Further, the determinants for FRP were also evaluated.
Methods:
Data collected as a part of a household level survey conducted in Haryana ‘Concurrent Evaluation of National Rural Health Mission: Haryana Health Survey’ were analyzed. Descriptive analysis was undertaken to assess socio-demographic characteristics, hospitalization rate, extent and determinants of OOP expenditure and FRP. Prevalence of catastrophic health expenditure (CHE) (more than 40% of non-food expenditure) and impoverishment (Int$ 1.25) were estimated. Multivariate logistic regression was used to assess determinants of FRP.
Results:
Hospitalization rate was found to be 3106 persons or 3307 episodes per 100,000 population. Median OOP expenditure on hospitalization was ₹ 8000 (USD 133), which was predominantly attributed to medicines (37%). Prevalence of CHE was 25.2 per cent with higher prevalence amongst males [odds ratio (OR)=1.30], those belonging to scheduled caste and scheduled tribes (OR=1.35), poorest 20 per cent households (OR=3.05), having injuries (OR=4.03) and non-communicable diseases (OR=3.13) admitted in a private hospital (OR=2.69) and those who were insured (OR=1.74). There was a 12 per cent relative increase in poverty head count due to OOP payments on healthcare.
Interpretation & conclusions:
Our findings showed that hospitalization resulted in significant OOP expenditure, leading to CHEs and impoverishment of households. Impact of OOP expenditures was inequitably more on the vulnerable groups. OOP expenditure may be curtailed through provision of free medicines and diagnostics and removal of any form of user charges.
Keywords: Catastrophic expenditure, financial risk protection, hospitalization, out-of-pocket expenditure
Out-of-pocket (OOP) payments are the principal means of healthcare financing in most low- and middle-income countries. In India, nearly 60 per cent of total health expenditure is sourced by the households through OOP payments1. While the share of government spending on health as a proportion of total health expenditure has increased from 26 per cent in 2000 to 30.5 per cent in 20112, a commensurate decline in OOP expenditure, especially in terms of per capita expenditure, has not been seen. This has led to an increase in the number of households facing catastrophic health expenditure (CHE) from 15 per cent of all households in 2004-2005 to 18 per cent in 2011-20123.
OOP expenditure acts as a deterrent for utilization of the healthcare services for a considerable proportion of the population. As per National Sample Survey (NSS) 71st round, no care was reported for 4.1 and 2.8 per cent of illness episodes in rural and urban areas, respectively4. More importantly, this unmet need was higher amongst poorer sections. In addition, many of those who seek care face impoverishment. Nearly 63 million people in India are forced below the poverty line (PL) due to OOP expenses for healthcare3. The problem of high OOP expenditure is further compounded by the lack of protective mechanisms such as risk pooling. Only 14 and 18 per cent of rural and urban Indian population respectively is covered by any form of health insurance4.
The need to reduce OOP expenditures and provide financial risk protection has been cited in various policies3,5,6. However, existing evidence on OOP has some limitations. Majority of existing published studies on OOP expenditure and financial risk protection (FRP) have used older data from NSS on healthcare utilization and expenditure (60th round) and other cross-sectional health surveys which are almost a decade old7,8. Further, these surveys have a number of disaggregated expenditure categories and recall periods7,8. Those relying on the use of recent consumption expenditure survey could lead to underestimation of catastrophic expenditure as these do not contain disaggregated data on consumption expenditure (into food and non-food expenditure). The validity and applicability of findings of these studies in relation to high healthcare inflation rates (7.5%)9 has also not been established. Further, assessing the extent of FRP in particular for hospitalization care through publicly financed health insurance schemes has become an important policy question. Haryana has also launched a supply-side funded scheme called Mukhyamantri Muft Ilaj Yojana in 2013, which specifically provides completely free treatment for all hospitalizations including surgeries, diagnostics and drugs10. Finally, while several policy documents such as the High Level Expert Group (HLEG) report as well as the 12th Five-Year Plan recommend State governments to undertake pilot interventions at district level to universalize health coverage5,6, there is no study till date which reports on FRP at district level.
This study was aimed to assess the extent of OOP expenditure and FRP due to hospitalization in Haryana State, India. FRP is reported at State and district level. Second, the determinants of FRP for hospitalization in Haryana State were also evaluated.
Material & Methods
Study design: Data of a large cross-sectional household level survey ‘Concurrent Evaluation of National Rural Health Mission (NRHM): The Haryana Health Survey’ conducted from September 2012 to May 2015 were analyzed. It was approved by the Ethics Committee of the Post Graduate Institute of Medical Education and Research, Chandigarh, India.
The Haryana State has 53 secondary and tertiary care hospitals; 95 community health centres and 440 primary health centres and 2630 sub-centres (SCs) to provide healthcare services11. Multistage stratified random sampling was used to select primary sampling units (PSUs) which comprised a SC in rural areas and an urban polio post in urban areas. Using a proportion of hospitalizations at government hospitals as 40 per cent (NSS 60th round)8, 11 per cent absolute error, 5 per cent type II error and a design effect of 1.25, the sample size was estimated to be 23 at the PSU level.
The overall sample to be selected at PSU level (i.e., SC) was further divided amongst its constituent villages based on population proportional to size. Within each village, the geographic area was divided broadly into four zones, from which one zone was randomly selected. The investigators selected the first house randomly and moved in consecutive order till the required sample of cases with any hospitalization in past one year was obtained. More details of overall study methodology are available elsewhere12,13.
Data collection: Respondents were interviewed using a semi-structured interview schedule. First part of this questionnaire dealt with general household information i.e., household and living characteristics, socio-demographic profile, assets and consumption expenditure. Consumption expenditure for households producing their own food grains, pulses, milk, etc., was computed by eliciting the actual quantity of consumption and then monetizing with the locally prevalent market rates of that commodity. The second part elicited information on any hospitalization within one year preceding the date of survey, ailment causing hospitalization, treatment-seeking behaviour and OOP expenditure incurred. Data were collected based on respondent recall which is a standard practice in many surveys4,14. Further, it was tried to substantiate the recall-based information on expenditure with a review of bills wherever available. A reference period of 365 days was used which is considered appropriate for hospitalization expenditure4,14,15. This was justified on two grounds; first, hospitalization being a rare event, a longer reference period was desirable for identifying enough episodes. Second, since it was a rare and important event in the household, members were likely to remember its features.
Statistical analysis: Data were analysed using SPSS software version 16.0 (SPSS Inc., Chicago, IL, USA) software. A composite household asset index was created using principal component analysis to assess the wealth status16. Twenty seven household assets were used for creating the asset index. In around 14.7 per cent cases, respondent was not able to recall detailed breakup of OOP expenditure for hospitalization. To avoid excluding this sample, overall expenditure amongst these households was apportioned into the five categories, on the basis of trends in remaining 85.3 per cent cases where detailed breakup of OOP expenditure was available. Besides at overall level, mean and median OOP expenditure was estimated for medicines, diagnostics, hospital charges or user fee (in public sector), transportation and other charges. For the purpose of conversion, 1 USD was taken to be equal to ₹ 60.1117.
Financial risk protection (FRP): CHE was calculated based on capacity to pay (CTP). A hospitalization OOP expenditure was considered to be catastrophic if it was ≥40 per cent of the households’ CTP18.
CTP was defined as total household expenditure (THHE) minus subsistence expenditure (SE) or food expenditure (FE) whichever amongst the two was lesser:
CTP = THHE – SE or FE (whichever is less)

If ≥0.4, then CHE is present; If <0.4, then CHE is absent.
Poverty head count: Poverty head counts was compared before and after OOP payments for hospitalization. The pre-hospitalization poverty head count (Pre-Hp) was calculated using mean per capita consumption expenditure (MPCE; xi) using the world bank international PL cut-off of $ 1.25/day/person.
Pre-Hp = 1/n∑(xi ≤ PL)
where n=number of individuals.
The post-hospitalization poverty head count was also computed in a similar manner by netting out OOP payments for hospitalization from consumption expenditure and then comparing with PL.
Post Hp = 1/n∑(xi – OOP) ≤ PL
where n=number of individuals.
Estimate of impoverishment was weighted by rural-urban distribution and size of district population.
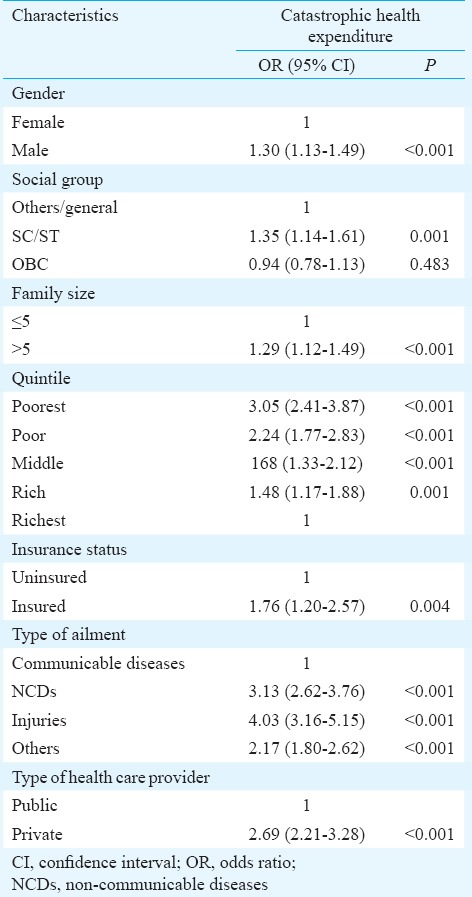
Determinants of catastrophic health expenditure (CHE): Binary logistic regression was performed to assess the independent factors determining the CHE amongst the hospitalized patients. Independent factors reported to be showing significant association with CHE were considered for multivariate analysis19,20. The variables included in first place were age of the patient, gender, social class, educational status, family size, wealth quintiles, type of ailment, type of healthcare provider and insurance status. Step-down approach was adopted for the development of final model. The correlation was assessed between the independent factors determining CHE to rule out the presence of multicollinearity. Wealth status of the family and education of head of household were found to be moderately correlated (0.44), and therefore, education was excluded from the multivariate analysis. The final model included gender, social class, family size, income quintiles, type of ailment, type of healthcare provider and insurance status as the explanatory variables.
Results
The present analysis comprised 79,743 households consisting of 436,657 individuals, of whom 13,253 individuals were hospitalized. Only 2.2 per cent were covered under any form of health insurance scheme; rate of hospitalization was found to be 3106 persons or 3307 episodes per 100,000 population. Majority (76.2%) of the patients sought hospitalization in the private sector. Communicable diseases, non-communicable diseases (NCD) and injuries led to 31.4, 30.9 and 10.2 per cent hospitalization, respectively (Table I).
Table I.
Out-of-pocket (OOP) expenditure according to socio-demographic, epidemiological and care-seeking profile of hospitalized patients in Haryana
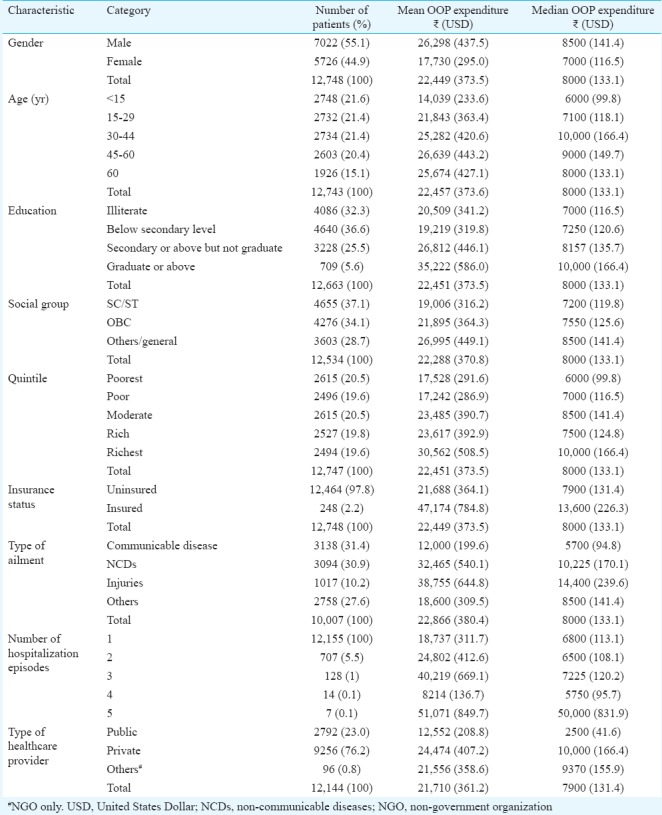
Out-of-pocket expenditure: The median and mean OOP expenditure on hospitalization in Haryana was ₹ 8000 and ₹ 22,450 (₹ 21,441-₹ 23,457), respectively (Table II). Median OOP expenditure incurred on hospitalization was four times higher in the private sector (₹ 10,000) than in the public sector (₹ 2500). Nearly 15.8 per cent of those admitted in public sector hospitals did not incur any OOP expenditure. On the contrary, all those admitted in private health facilities incurred some OOP expenditure. Majority of this was incurred on medicines (34%) followed by hospital charges or user fee (28%) (Fig. 1). Medicines accounted for close to half of total OOP expenditure in the public sector (48%) (Fig. 1).
Table II.
Out-of-pocket expenditure due to hospitalization in Haryana State

Fig. 1.
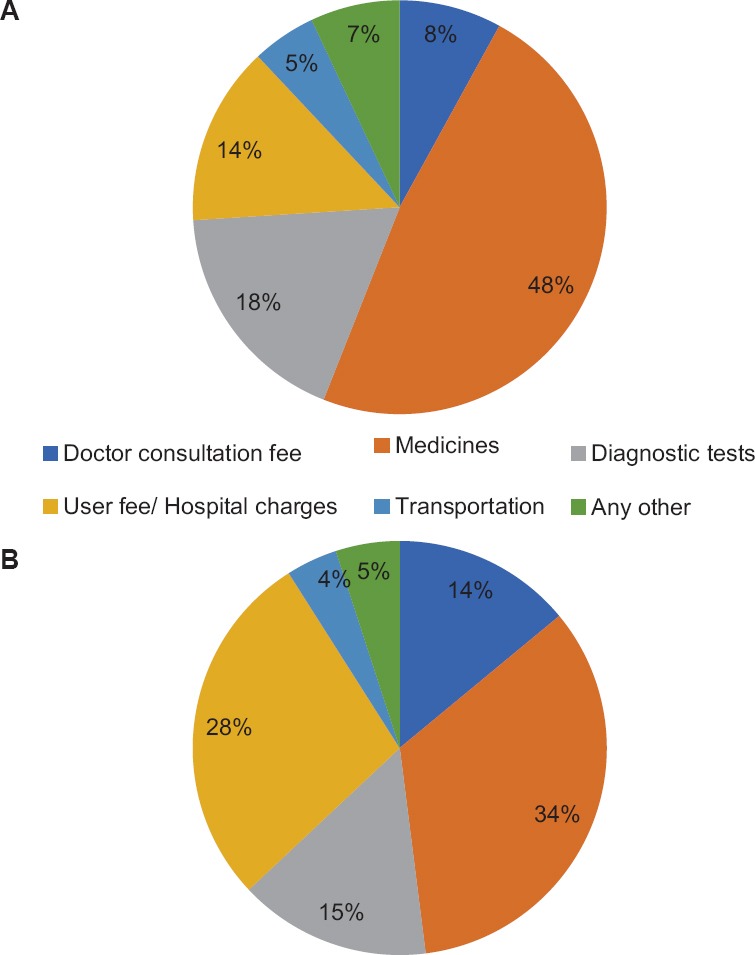
Distribution of out-of-pocket expenditure on hospitalization in health facilities of Haryana (A) Public health facilities (B) Private health facilities.
Borrowing money was the main coping mechanism used to finance OOP payments for hospitalization (43%). The share of insurance for coping OOP payments was only 4.4 per cent (Fig. 2).
Fig. 2.
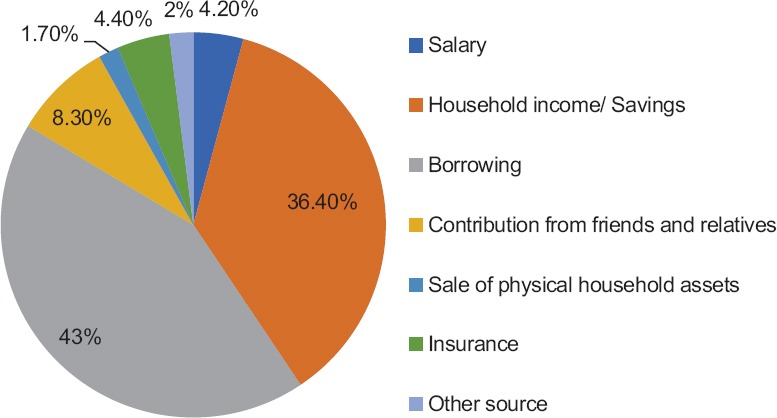
Coping strategies for out-of-pocket payments.
Financial risk protection (FRP): The prevalence of CHE for hospitalization in Haryana State was 25.2 per cent. A relative increase of 12 per cent in poverty head count post-OOP payments for hospitalization was observed. Wide inter-district variations were observed in FRP. CHE prevalence was maximum in Sirsa (46.3%) and lowest in Gurgaon (9.0%), whereas a relative increase in poverty head count was maximum for Fatehabad and least for Rohtak (17.4 and 5.7%, respectively) (Fig. 3). The CHE was significantly more amongst males [odds ratio (OR)=1.30; 95% confidence interval (CI)=1.13-1.49; P<0.001), Scheduled Castes/Scheduled Tribes (OR=1.35; 95% CI=1.14-1.61; P=0.001), poorest quintile (OR=3.05; 95% CI=2.41-3.87; P<0.001) and amongst insured (OR=1.76; 95% CI=1.20-2.57: P=0.004). Second, prevalence of CHE was significantly higher for those being admitted for NCDs (OR=3.13; 95% CI=2.62-3.76; P<0.001) and for those who sought care at a private healthcare facility (OR=2.69; 95% CI=2.21-3.28) (P<0.001). Odds of facing CHE was higher in insured than uninsured (OR=1.76; 95% CI=1.20-2.57) (Tables III and IV).
Fig. 3.
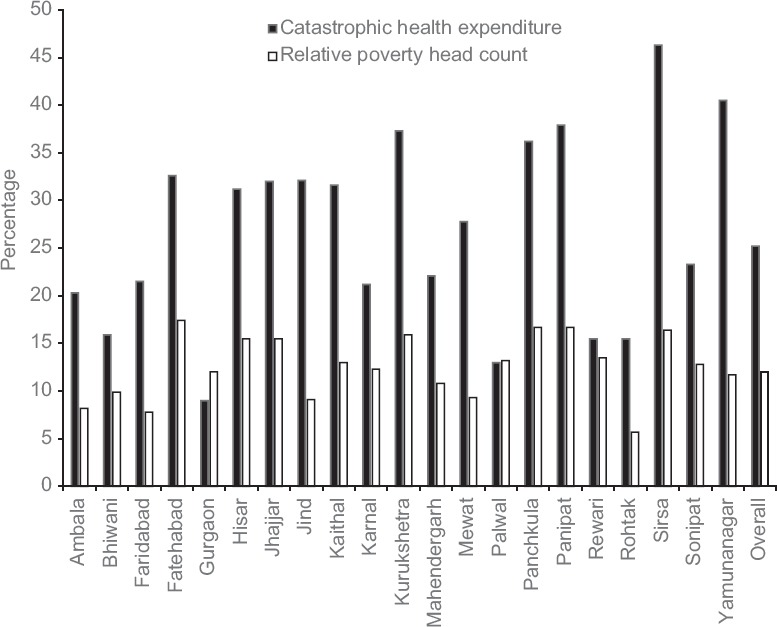
Financial risk protection at district level.
Table III.
Extent of financial risk protection for hospital care in Haryana
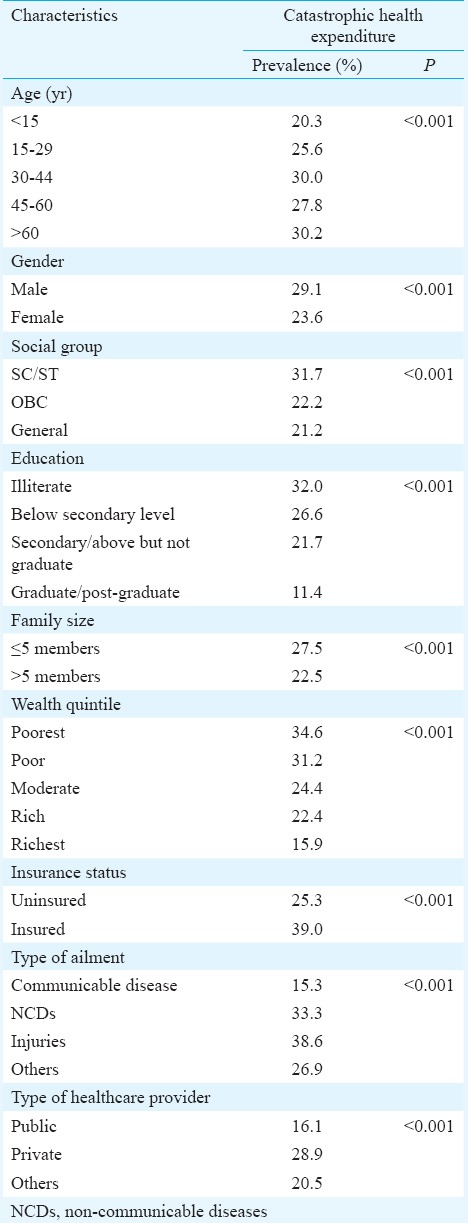
Table IV.
Determinants of financial risk protection for hospital care in Haryana
Discussion
Overall, the median cost of OOP expenditure on hospitalization was estimated to be ₹ 8000 (USD 133). Medicines constituted major share of OOP expenditure (37%). Nearly one-fourth of the households (25.2%) faced financial catastrophe, whereas there was a 12 per cent relative increase in poverty head count as a result of OOP expenditures. Prevalence of CHE was significantly higher in private sector hospitalizations, those due to NCD, amongst poor people and those who were having a health insurance.
The strength of this study lied in the analysis of locally representative, notably large data set on hospitalization. Second, our estimates were valid at district level. With most of government health programmes encouraging decentralized planning process, it is important to generate evidence on health financing also at district level. The HLEG group report as well as the 12th Five-Year Plan recommend undertaking district-level pilots for universal health care5,6. Third, the consumption expenditure data in our study were differentiated into food expenditure and non-food expenditure, making the use of WHO recommended 40 per cent cut-off level for CTP feasible.
Our estimates of mean OOP expenditure (₹ 22,450) were close to the hospitalization expenditure in Haryana reported in the NSS 71st round survey on healthcare service utilization and expenditures (₹ 24,214 per hospitalization case)4. OOP expenditure incurred on hospitalization was almost twice in the private sector than in the public sector, which was similar to previous study finding21. Majority expenditure in both the private as well as the public sectors was incurred on medicines. The same was evident from the findings of another study, which reported that medicines accounted for around 70 per cent of the total OOP expenditures7. The reasons for this high expenditure on medicines could be due to non-availability of drugs in public sector hospitals, irrational use of drugs both by the users as well as the prescribers, over prescription, multidrug prescription and use of expensive but often unnecessary drugs.
The OOP expenditure was found to be progressive i.e., higher amongst the richer quintiles, which was similar to what has been reported earlier7. The possible reasons for the same can be inequity in extent and nature of healthcare utilization amongst the rich and the poor22. The poor have a higher unmet need and hence lower OOP expenditure. Second, the rich tend to access care from more costly private sector while poor seek care from the public hospitals. Finally, poor substitute inpatient care with cheaper forms such as outpatient care21.
It was found that 25.2 per cent of households suffered financial catastrophe at a 40 per cent threshold which was highest in poorest quintile (34.6%) and least in richest quintile (15.9%). A previous analysis also observed that CHE was regressive in Haryana State21.
Policy implications
An important finding of our study was that the odds of facing CHE were 1.7 times higher amongst the insured as compared to uninsured. This finding is similar to a recently published systematic review of the impact evaluations of publicly financed health insurance schemes in India23. It has significant implications for India's health financing policies, where the government is trying to invest more in the form of demand-side financing mechanisms such as publically financed health insurance schemes. Of the four studies, which have evaluated the impact of these schemes on FRP, three have reported no reduction of catastrophic spending amongst those who are insured24,25,26,27. This implies that there is a need to evaluate the existing health insurance schemes, before investing heavily in them to achieve universal health coverage. On the contrary, since public sector health expenditures are significantly lower and since strategies to reduce OOP through public sector strengthening have resulted in positive effects28, it is recommended to invest in developing public sector infrastructure through supply-side funding as a strategy for universal health coverage.
Both OOP expenditure and the prevalence of CHE were higher for hospitalizations related to injuries and NCDs as compared to communicable diseases. This points to the urgent need to invest in prevention of NCDs and injury and strengthening public health systems for provision of primary care for NCDs. A better management of NCDs by focusing on preventive and primary healthcare and thereby reducing the cost of curative care is lacking at present.
One of the methods to reduce OOP payments on hospitalization is through reduction in expenditure on medicines. This can be done by ensuring free availability of medicines in public sector institutions. Models of Tamil Nadu Medical Services Corporation29 and Rajasthan Medical Service Corporation30 for the provision of free medicines need to be emulated by other States. The centralized procurement and decentralized distribution system in Haryana State should be strengthened further31.
Finally, user fee or hospital charge was the second major contributor for OOP expenditure and should be removed. Previous analyses from Haryana State showed that implementing a surgical package care programme did not reduce user charges, and rather resulted in a decline in trends of public sector surgeries32. Similar negative findings in terms of declining overall hospitalizations were observed in early years of health sector reforms when user charges were introduced. Moreover, increased public health spending results in the more equitable utilization of hospital services33.
The study has methodological and data limitations. First, OOP was presented as costs associated with hospital admissions only and did not describe OOP expenditure associated with outpatient visits and with those who did not seek care in hospitals; these costs would be important in giving a comprehensive picture. Second, due to recall bias, detailed breakup of OOP expenditure could not be obtained in about 14.7 per cent cases. This was later apportioned using the distribution of expenditure in cases where detailed breakup was available. However, this could reduce variability. Third, the severity of illness was not assessed. While lack of measurement of severity of illness did not affect the validity of OOP expenditure estimation at the population level as our sample was drawn randomly, it could potentially affect the extent of FRP in one stratum versus another, especially if the severity of illness is systematically different in the two strata. Fourth, the interest of money borrowed to make hospitalization payments was not accounted for. It has been argued that a complete measure of hardship financing should include the additional costs accrued as a result of borrowings incurred to pay the OOP expenditure34. Hence, our estimate on FRP could be considered to be a slight underestimate. Further, besides interviewing the respondents, it was tried to obtain bills of hospital to record exact expenditures. Despite attempts to elicit detailed expenditure data, there could be recall bias.
In conclusion, our study showed high OOP expenditure and its catastrophic impact on households at district level in Haryana. The government should increase the public health spending to reduce the economic burden on households. Better availability of drugs and diagnostics in public sector are likely to yield results. There is a need to re-orient and strengthen the public health systems towards the provision of holistic primary care.
Acknowledgment
The authors acknowledge the National Rural Health Mission (NRHM), Department of Health and Family Welfare, Government of Haryana, for funding this study, and thank Drs Rakesh Gupta and Amit Phogat, for their support in data collection.
Footnotes
Conflicts of Interest: None.
References
- 1.World Health Organization. Global health observatory data repository. Geneva: WHO; 2014. [accessed on January 25, 2015]. Available from: http://apps.who.int/gho/data/node.main.GHEDOOPSCHESHA2011?lang=en . [Google Scholar]
- 2.World Health Organization. World health statistics 2014. Geneva: WHO; 2014. p. 180. [Google Scholar]
- 3.Ministry of Health and Family Welfare. National Health Policy 2015 Draft. 2014. [accessed on February 19, 2015]. p. 57. Available from: http://www.mohfw.nic.in/showfile.php?lid=3014 .
- 4.National Sample Survey Office. Key indicators of social consumption in India health. NSS 71st round January-June 2014. New Delhi: NSSO, Ministry of Statistics and Programme Implementation, Government of India; 2015. [Google Scholar]
- 5.Planning Commission of India. Twelfth five year plan 2012-17. New Delhi: Planning Commission, Government of India; 2012. [Google Scholar]
- 6.Planning Commission of India. High level expert group report on universal health coverage for India. New Delhi: Planning Commission, Government of India; 2011. [Google Scholar]
- 7.Garg CC, Karan AK. Reducing out-of-pocket expenditures to reduce poverty: A disaggregated analysis at rural-urban and state level in India. Health Policy Plan. 2009;24:116–28. doi: 10.1093/heapol/czn046. [DOI] [PubMed] [Google Scholar]
- 8.Gupta I. Out-of-pocket expenditures and poverty: Estimates from NSS 61 st round. Draft paper. New Delhi: Institute of Economic Growth; 2009. [Google Scholar]
- 9.Agencies: Washington. Healthcare costs to rise 7.5 percent in 2013: report. The Indian Express. 2012. May 31, [accessed on November 26, 2014]. Available from: http://www.indianexpress.com/article/lifestlye/health/healthcare-costs-to-rise-7-5-percent-in-2013-report/
- 10.Prinja S, Gupta R, Sharma A, Dalpath SK, Phogat A. Engaging actors for integrating health policy and systems research into policy making: Case study from Haryana State in India. Indian J Community Health. 2017;29:320–2. [Google Scholar]
- 11.Haryana health services at a glance: 2011-12. Panchkula, Haryana, India: Director General, Health Services; 2012. [Google Scholar]
- 12.Prinja S, Gupta R, Bahuguna P, Sharma A, Kumar Aggarwal A, Phogat A, et al. A composite indicator to measure universal health care coverage in India: Way forward for post-2015 health system performance monitoring framework. Health Policy Plan. 2017;32:43–56. doi: 10.1093/heapol/czw097. [DOI] [PubMed] [Google Scholar]
- 13.Gupta M, Angeli F, Bosma H, Rana M, Prinja S, Kumar R, et al. Effectiveness of multiple-strategy community intervention in reducing geographical, socioeconomic and gender based inequalities in maternal and child health outcomes in Haryana, India. PLoS One. 2016;11:e0150537. doi: 10.1371/journal.pone.0150537. [DOI] [PMC free article] [PubMed] [Google Scholar]
- 14.World Health Organization. WHO World health survey. [accessed on April 22, 2016]. Available from: http://www.who.int/healthinfo/survey/en/index.html .
- 15.United Nations Children Fund India. Coverage evaluation survey 2009. New Delhi: United Nations Children Fund; 2010. [Google Scholar]
- 16.Vyas S, Kumaranayake L. Constructing socio-economic status indices: How to use principal components analysis. Health Policy Plan. 2006;21:459–68. doi: 10.1093/heapol/czl029. [DOI] [PubMed] [Google Scholar]
- 17.International Revenue Services. Yearly average currency exchange rates. [accessed on May 15, 2016]. Available from: https://www.irs.gov/Individuals/International-Taxpayers/Yearly-Average-Currency-Exchange-Rates .
- 18.Xu K. Distribution of health payments and catastrophic expenditures methodology. Geneva: Department of Health System Financing, World Health Organization; 2005. [Google Scholar]
- 19.Xu K, Evans DB, Kawabata K, Zeramdini R, Klavus J, Murray CJ, et al. Household catastrophic health expenditure: A multicountry analysis. Lancet. 2003;362:111–7. doi: 10.1016/S0140-6736(03)13861-5. [DOI] [PubMed] [Google Scholar]
- 20.Su TT, Kouyaté B, Flessa S. Catastrophic household expenditure for health care in a low-income society: A study from Nouna district, Burkina Faso. Bull World Health Organ. 2006;84:21–7. doi: 10.2471/blt.05.023739. [DOI] [PMC free article] [PubMed] [Google Scholar]
- 21.Prinja S, Kanavos P, Kumar R. Health care inequities in north India: Role of public sector in universalizing health care. Indian J Med Res. 2012;136:421–31. [PMC free article] [PubMed] [Google Scholar]
- 22.Prinja S, Aggarwal AK, Kumar R, Kanavos P. User charges in health care: Evidence of effect on service utilization & equity from north India. Indian J Med Res. 2012;136:868–76. [PMC free article] [PubMed] [Google Scholar]
- 23.Prinja S, Chauhan AS, Karan A, Kaur G, Kumar R. Impact of publicly financed health insurance schemes on healthcare utilization and financial risk protection in India: A systematic review. PLoS One. 2017;12:e0170996. doi: 10.1371/journal.pone.0170996. [DOI] [PMC free article] [PubMed] [Google Scholar]
- 24.Rao M, Katyal A, Singh PV, Samarth A, Bergkvist S, Kancharla M, et al. Changes in addressing inequalities in access to hospital care in Andhra Pradesh and Maharashtra states of India: A difference-in-differences study using repeated cross-sectional surveys. BMJ Open. 2014;4:e004471. doi: 10.1136/bmjopen-2013-004471. [DOI] [PMC free article] [PubMed] [Google Scholar]
- 25.Selvaraj S, Karan AK. Why publicly-financed health insurance schemes are ineffective in providing financial risk protection. Econ Polit Wkly. 2012;47:61–8. [Google Scholar]
- 26.Aiyar A, Sharma V, Narayanan K, Jain N, Bhat P, Mahendiran S, et al. Rashtriya Swasthya Bima Yojana (A study in Karnataka); 2013. Bengaluru: Centre for Budget and Policy Studies; 2013. [Google Scholar]
- 27.Fan VY, Karan A, Mahal A. State health insurance and out-of-pocket health expenditures in Andhra Pradesh, India. Int J Health Care Finance Econ. 2012;12:189–215. doi: 10.1007/s10754-012-9110-5. [DOI] [PubMed] [Google Scholar]
- 28.Prinja S, Bahuguna P, Gupta R, Sharma A, Rana SK, Kumar R. Coverage and financial risk protection for institutional delivery: How universal is provision of maternal health care in India? PLoS One. 2015;10:e0137315. doi: 10.1371/journal.pone.0137315. [DOI] [PMC free article] [PubMed] [Google Scholar]
- 29.Tamil Nadu Medical Services Corporation Limited. Drug Procurement Policy. [accessed on October 29, 2017]. Available from: http://www.tnmsc.com/tnmsc/new/html/Procurement%20&%20Tender.php,
- 30.Government of Rajasthan Medical and Health Portal. Procurement of Drugs. [accessed on October 29, 2017]. Available from: http://health.rajasthan.gov.in/content/raj/medical/en/rajasthan-medicalservices-corporation-ltd/services/Procurement.html .
- 31.The medicine procurement & management policy. Haryana: 2012. [accessed on September 15, 2015]. Available from: http://www.nrhmharyana.gov.in/files/drugpolicyfinal.pdf . [Google Scholar]
- 32.Balasubramanian D, Prinja S, Aggarwal AK. Effect of user charges on secondary level surgical care utilization and out-of-pocket expenditures in Haryana state, India. PLoS One. 2015;10:e0125202. doi: 10.1371/journal.pone.0125202. [DOI] [PMC free article] [PubMed] [Google Scholar]
- 33.Prinja S, Kumar M, Pinto A, Jan S, Kumar R. Equity in hospital services utilization in India. Econ Polit Wkly. 2013;48:52–8. [Google Scholar]
- 34.Binnendijk E, Koren R, Dror DM. Hardship financing of healthcare among rural poor in Orissa, India. BMC Health Serv Res. 2012;12:23. doi: 10.1186/1472-6963-12-23. [DOI] [PMC free article] [PubMed] [Google Scholar]


