

Abstract
Targeted therapeutics, such as those abrogating hypoxia inducible factor (HIF)/vascular endothelial growth factor signaling, are initially effective against kidney cancer (or renal cell carcinoma, RCC); however, drug resistance frequently occurs via subsequent activation of alternative pathways. Through genome-scale integrated analysis of the HIF-α network, we identified the major protein kinase C substrate MARCKS (myristoylated alanine-rich C kinase substrate) as a potential target molecule for kidney cancer. In a screen of nephrectomy samples from 56 patients with RCC, we found that MARCKS expression and its phosphorylation are increased and positively correlate with tumor grade. Genetic and pharmacologic suppression of MARCKS in high-grade RCC cell lines in vitro led to a decrease in cell proliferation and migration. We further demonstrated that higher MARCKS expression promotes growth and angiogenesis in vivo in an RCC xenograft tumor. MARCKS acted upstream of the AKT/mTOR pathway, activating HIF-target genes, notably vascular endothelial growth factor-A. Following knockdown of MARCKS in RCC cells, the IC50 of the multikinase inhibitor regorafenib was reduced. Surprisingly, attenuation of MARCKS using the MPS peptide synergistically interacted with regorafenib treatment and decreased survival of kidney cancer cells through inactivation of AKT and mTOR. Our data suggest a major contribution of MARCKS to kidney cancer growth and provide an alternative therapeutic strategy of improving the efficacy of multikinase inhibitors.
INTRODUCTION
Renal cell carcinoma (RCC), the most common kidney malignancy and the sixth most common cancer in the United States, is one of the most vascular of the solid tumors. Genome-wide studies of RCC have uncovered frequent mutations, deletions or promoter CpG island methylation of the von Hippel–Lindau tumor suppressor (VHL) as a probable driver of this phenotype.1,2 Under normoxic conditions, the VHL protein contributes to the degradation of the α-subunit of hypoxia-induced factors (HIFs). Because of Q3 the inactivation of the VHL gene, which is common in clear-cell RCC, the HIF-α proteins accumulate and induce expression of their target genes, such as vascular endothelial growth factor (VEGF) and others,3,4 which are involved in angiogenesis; therefore, anti-angiogenic therapies have played a pivotal role in RCC treatment.5 For metastatic RCC in particular, the two standard targets are the VEGF receptor and mammalian target of rapamycin (mTOR), a downstream component in the phosphoinositide 3-kinase (PI3K)/AKT pathway known to upregulate HIF-1α activity.6 Unfortunately, tumors frequently develop resistance to these targeted therapies by activating bypass pathways in response to VEGF7,8 or mTOR inhibition.9
Several new tyrosine kinase inhibitors have recently been developed for metastatic RCC and have demonstrated a marked clinical improvement over first-generation tyrosine kinase inhibitors by increasing drug specificity.10–12 Among these, the multi-kinase inhibitor regorafenib shows antitumor activity via blocking several key kinase pathways associated with tumor angiogenesis (VEGF receptors) and oncogenesis (the mitogen-activated protein kinase pathway);13 however, the PI3K/AKT pathway, activated in up to 50% of RCC cases,1,10 is not a major target of this drug.14 Importantly, toxicity is in fact an issue as was demonstrated in a Phase II trial of 49 patients with metastatic or unresectable RCC, in which 98% experienced drug-related adverse events and 35% experienced drug-related serious adverse effects.15 Likewise, Phase III trials demonstrated consequential adverse effects and low-objective response rate, which was no better than that of current first-line treatments.16 For these reasons, there is an urgent need to develop novel approaches for improving the efficacy of targeted therapies in RCC.
Using a genome-wide integrated network analysis of the genes that interact with HIF-1α, we identified the phosphatidylinositol 4,5-bisphosphate (PIP2)-binding protein MARCKS, a substrate of protein kinase C. MARCKS, especially its phosphorylated form, serves as a key regulatory protein controlling cell migration and signaling.17 Emerging evidence has suggested that MARCKS is capable of specifically promoting cancer migration and metastasis but its function in tumor growth has not been worked out.18–31 MARCKS has also been implicated in lung, breast and pancreatic cancer progression.22,23,26–31 Intriguingly, MARCKS has been reported to be prometastatic,18,19,24 but also a tumor suppressor20,21,32 in glioma, melanoma and colon cancer. Despite these findings in various neoplastic diseases, there has been no information regarding the role of MARCKS in kidney cancer.
In this study, we reveal the therapeutic potential of MARCKS in RCC and determine its molecular contributions to pro-angiogenic signaling elements. Our results not only present a novel molecular mechanism underlying RCC progression but also provide a promising strategy for targeted therapies.
RESULTS
MARCKS expression in kidney cancer and correlation with tumor grade
Using genome-scale integrated analysis,33 we identified a total of 21 genes in human ccRCC samples of multiple grades with a cutoff point of 0.5 occurring in a HIF1A gene network. Because more than a third of all known biomarkers, as well as more than two-thirds of potential disease targets, are membrane-related proteins,34 we focused on the critical PIP2-binding partner17 MARCKS (Supplementary Figure S1a). To investigate the role of MARCKS in kidney cancer, we analyzed MARCKS gene expression between clear-cell RCC tissues (n = 72) and matched normal kidney tissues (n = 72) in data set GSE53757.35 Through the use of the Wilcoxon– Mann–Whitney test, we found that MARCKS mRNA levels were significantly higher in RCC tissues than in adjacent normal tissue sections (Figure 1a, W = 4975, P-value <0.01). This observation was also seen in another cohort of 534 RCC patients from the TCGA data sets (Supplementary Figure S1b). To validate that MARCKS is dysregulated in tumor tissues, we examined the expression pattern of MARCKS in several RCC and adjacent normal tissue samples by immunohistochemistry, which confirmed an increase of MARCKS protein expression in RCC tissues (T) as compared with adjacent normal (N) (Figure 1b).
Figure 1.

MARCKS is upregulated in RCC. (a) Normalized expression of MARCKS in clear-cell RCC tissues (n = 72) versus matched normal kidney tissues (n = 72) using the GSE53757 data set. (b) Higher immunohistochemical staining of MARCKS protein in tumor (T) versus adjacent non-tumor areas (N) from RCC patients; P1, P2 and P3 are three representative patients. PANEL (c and e): representative immunohistochemical images of grades 1, 2 and 3 (G1, G2 and G3) RCC tumors using anti-MARCKS (c) and anti-phospho-MARCKS (e) antibodies (n = 56). An enlarged image from the dark frame is shown at the bottom. Panel (d, f): percentage of patients with high and low levels of MARCKS (d) or phospho-MARCKS (f) expression corresponding to tumor grade. Numbers in bars represent the percentage of patients for each condition.
We next evaluated MARCKS expression and its phosphorylation (phospho-MARCKS) in RCC specimens from a cohort of 56 patients grouped into low- and high-expression categories (see ‘Materials and Methods’; clinical characteristics are summarized in Supplementary Table S1). More intense MARCKS staining was observed in higher as compared with lower-grade RCC (Figure 1c) and there was a positive correlation between tumor grade and MARCKS expression (Figure 1d and Supplementary Table S1; P = 0.042). In addition, abundant phospho-MARCKS staining was seen in RCC samples (Figure 1e) and was greater in RCC patients with grade 2 (G2) and 3 (G3) compared with patients with grade 1 (G1) (Figure 1f). Positive-nuclear staining for phospho-MARCKS was also detected in tumor specimens, whereas there was no significant association of nuclear localization of phospho-MARCKS with increasing grade (Supplementary Table S2). Thus, MARCKS protein is likely of more importance in patients with higher-grade RCC.
MARCKS contributes to cell proliferation in RCC
On the basis of the increased levels of both MARCKS and phospho-MARCKS in the RCC specimens examined, we next assessed phospho-MARCKS and total MARCKS abundance in primary normal human kidney epithelial cells (NHK) and in several commercially available RCC cell lines. Using quantitative real-time RT-PCR and immunoblotting, we observed higher MARCKS and phospho-MARCKS expression in all tested RCC cell lines as compared with NHK cells (Figure 2a), thus validating these cells, previously shown to represent high grade,36 for further study.
Figure 2.

MARCKS expression is associated with RCC cell growth. (a) Upregulated MARCKS expression in various RCC cell lines. Top, expression of MARCKS mRNA as measured by real-time RT-qPCR. Bottom, MARCKS protein and its phosphorylation were confirmed by western blots. Panel (b, c): genetic knockdown of MARCKS expression. (b) Multiple RCC cells as indicated were treated with control or MARCKS-specific shRNA; after 72 h of transduction, cells were subjected to MTS proliferation assays (top) and western blot analyses (bottom). Data expressed as mean ± s.d. (n = 3), *P<0.05 as compared with cells receiving control shRNA. (c) Higher phospho-MARCKS promotes RCC cell proliferation. Caki-1 and 786-O cells were transduced with control non-specific or MARCKS-specific shRNA-containing lentiviruses. Following knockdown of MARCKS, cells were transfected with either wild type or mutant (S159/163 A) V5-tagged MARCKS. Cell proliferation and the levels of phospho-MARCKS abundance and MARCKS expression in these genetically modified cells were determined by MTS assays (top) and western blots (bottom). *P<0.05 versus control shRNA (n = 3). (d) Effects of MARCKS-knockdown on cell growth as determined by colony formation assays. Colonies were stained and visualized microscopically as described in ‘Materials and Methods’ section. A representative view of each cell line is shown in the upper panel. Bottom, colonies were counted in a blinded fashion and quantification. Panel (e, f): pharmacologic inhibition of MARCKS. (e) Cells were incubated with various concentrations of the MPS peptide for 72 h and then subjected to MTS assays. (f) Cells were treated with the indicated concentrations of MPS peptide and colonies were counted after 9 days using crystal violet staining. Top, data are representative of three independent experiments. Bottom, number of colony units (mean ± s.d.).
Given that a hallmark of cancer, including RCC, is the continual unregulated proliferation of cells,37 we asked whether an increase in both phospho-MARCKS and total MARCKS promote kidney cancer cell proliferation. Using RCC cells which showed abundant MARCKS expression, we used a MARCKS-specific short hairpin RNA (MARCKS shRNA) to eliminate both phospho-MARCKS and MARCKS expression and showed reduction of proliferation in four RCC cell lines, including highly invasive Caki-1 and ACHN cells derived from metastases (Figure 2b). Overexpression of V5-tagged wild-type MARCKS in MARCKS-knockdown cells augmented phospho-MARCKS level and cell proliferation ability of RCC cells, but these alterations were dramatically attenuated in cells transfected with the phosphorylation defective S159/163A-MARCKS (Figure 2c). This phenomenon was recapitulated in low MARCKS-expressing NHK cells (Supplementary Figure S2a). Similarly, clonogenic ability was impaired in MARCKS-silenced cells (Figure 2d and Supplementary Figure S2b). Interestingly, we noticed a decrease in the number of cell spreading and migration in Caki-1 cells after knockdown of MARCKS, as compared with parental or control shRNA-transduced cells (Supplementary Figure S2c).
We previously identified a novel peptide, the MPS peptide, which targets the phosphorylation site domain (PSD) of MARCKS and inhibits MARCKS-mediated functions in lung cancer.23 Treatment with the MPS peptide in various RCC cell lines confirmed that this peptide had an inhibitory effect on MARCKS phosphorylation (Supplementary Figure S2d), cell proliferation (Figure 2e) and colony formation (Figure 2f and Supplementary Figure S2e) in RCC cells, consistent with shRNA knockdown of MARCKS. These results suggest that MARCKS plays an important role in several cancer hallmarks relevant to RCC oncogenesis.
Loss of MARCKS reduces xenograft tumor growth and angiogenesis
To determine a functional role of MARCKS in promoting RCC growth in vivo, we utilized a subcutaneous xenograft tumor model implanted with MARCKS-manipulated Caki-1 and 786-O cells. One group of mice were injected subcutaneously with cells previously transduced with control shRNA, and the other group of mice were injected with MARCKS-knockdown cell. After 15 days, the average volume of tumors derived from VHL wild-type Caki-1 cells transduced with MARCKS shRNA was significantly reduced, whereas tumors from Caki-1 cells receiving control shRNA showed continuous growth (Figure 3a), and the size and weight of tumors were approximate 4.6-fold increase in control shRNA group (Figure 3b). In addition, knockdown of MARCKS in 786-O (VHL-negative) cells led to a similar reduction in growth rate, weight and size (Figures 3c and d), suggesting that MARCKS-mediated tumorigenesis is not associated with VHL expression status.
Figure 3.

MARCKS promotes RCC growth and angiogenesis in vivo. Panel (a–d): growth curves (a, c) and tumor weights (b, d) of xenograft tumors generated by subcutaneous injection of MARCKS-manipulated Caki-1 (a, b) and 786-O (c and d) cells as described in ‘Materials and Methods’ section. Data are presented as means ± s.d. Photos of primary tumors from subcutaneous tissue of nude mice (b, d, left). The tumor weights are average values from four mice per group (b, d, right). *P<0.05 as compared with control shRNA group. (e) H&E and immunohistochemical staining of CD31 in Caki-1 and 786-O xenografted tumors as described in a–d. Representative images are shown and positive staining is quantified (mean ± s.d.). CD31-stained cells in the most vascular areas (hot spots); microvessel density is expressed as the percentage of CD31+ area per high-powered field. Analysis of 6–12 high-powered fields per tumor was performed with ImageJ software.
Since angiogenesis is an important factor for RCC progression and a target of current therapies,38 we hypothesized that tumor growth mediated by MARCKS shRNA occurs through inhibition of the growth of the tumor microvasculature. We found that the MARCKS-knockdown xenograft tumors did in fact have the lowest microvessel density by staining with the endothelial marker CD31 as compared with the control shRNA group (Figure 3e) suggesting the importance of MARCKS expression in neoangiogenesis. Consistent with the in vitro proliferation data (Figure 2), we found a decrease in proliferating cell nuclear antigen, a marker of proliferation, in MARCKS-silenced cells (Supplementary Figure S3a); however, activated caspase-3, a hallmark of apoptosis, remained unchanged in MARCKS-knockdown group.
MARCKS upregulates VEGFA levels and the AKT/mTOR pathway VEGF, an important target of HIF, is a major mediator of angiogenesis in many cancers including RCC.4,39 To determine whether this growth factor is involved in MARCKS signaling, we evaluated VEGFA-stained cells in the xenograft tumors and found parallel reduction of VEGFA and MARCKS expression in tumors derived from MARCKS-silenced 786-O cells (Figure 4a). To validate this finding in human RCC, samples from the GSE53757 data set (n = 144) were grouped into high- and low-MARCKS expression using the median as a cutoff and subjected to Wilcoxon–Mann– Whitney test on the VEGFA expression levels of the two groups; these data showed a significantly higher level of VEGFA in the high-MARCKS subset (Figure 4b; W = 4902, P-value <0.01).
Figure 4.

MARCKS regulates VEGF expression and secretion in RCC. (a) Paraffin histology sections as described in Figures 3c and d subjected to immunohistochemistry for MARCKS and VEGF-A. A representative image is shown. (b) Comparison of VEGF-A expression in high-MARCKS-expressing and low-MARCKS-expressing cells using the RCC data set (n = 144, GSE53757). Panel (c–e): genetic knockdown of MARCKS expression. Cells were infected with MARCKS-specific or non-specific shRNA-containing lentiviruses. After 72 h of infection, VEGFA expression was determined by real-time RT-qPCR (c) and VEGF ELISA (d) assays. n = 3, *P<0.05 versus control shRNA. (e) Western blots analysis of phospho-mTOR and phospho-AKT levels in MARCKS-silenced cells. Panel (f–h): pharmacologic inhibition of MARCKS. Cells were treated with 100 μM MPS peptide for 48 h and then collected for real-time RT-qPCR (f) and VEGF ELISA (g) assays. *P<0.05 versus 0 μM. (h) Determination of AKT and mTOR activation in MPS-treated cells using immunoblotting with indicated antibodies.
To determine a causal effect of MARCKS on VEGFA, we next examined VEGFA expression in MARCKS-knockdown cells and found that MARCKS-silenced cells displayed significantly lower mRNA expression and secretion of VEGFA as compared with cells receiving control shRNA (Figures 4c and d). Likewise, knockdown of MARCKS in RCC cells resulted in decreased expression of MMP9 (Supplementary Figure S4a–d), a HIF-targeted gene involved in aggressive tumor growth and invasion.40
The AKT/mTOR pathway, which functions in RCC cell growth and is a target for therapy in the clinic,12,38,41 acts upstream of HIF to modulate VEGFA expression. In light of the fact that MARCKS is associated with the PI3K/AKT pathway,23,27,42 we next asked whether MARCKS activates AKT/mTOR signaling to augment VEGFA expression and cell proliferation. We first tested the effect of MARCKS protein on PIP2 binding and PIP3 synthesis, which are the two major determinants for AKT activation.42 A kinetic assay confirmed that the peptide mimicking the MARCKS PSD binds PIP2 with a dissociation constant of 17.64 nM (Supplementary Figure S4e). As expected, a decrease of PIP3 pools in whole-cell lysates of MARCKS-silenced RCC cells was observed (Supplementary Figure S4f), in agreement with previous reports that MARCKS expression directly regulates both PIP2 availability43 and PIP3 production.23,42 Next, RCC cells transduced with MARCKS shRNA showed decreased levels of phospho-AKT both at Ser473 and Thr308 as well as phospho-mTOR at Ser2448, which is the PI3K/AKT-induced phosphorylation site (Figure 4e). Consistent with the above findings, a reduction in VEGFA mRNA expression (Figure 4f), VEGFA secretion (Figure 4g) and the activity of AKT and mTOR (Figure 4h) was seen after MARCKS inhibition by MPS treatment.
MARCKS reduces antitumor activity of the angiogenic and oncogenic multikinase inhibitor
In view of the low-objective response rate, high rate of resistance and adverse effects of the current RCC therapeutic regorafenib,15,16 there is an urgent clinical need to improve the efficacy of such treatment in RCC. Given the functional role of MARCKS in VEGF production and the AKT/mTOR pathway, we hypothesized that MARCKS might be involved in the antitumor activity of regorafenib. To test this possibility, we transduced various RCC cell lines with either control shRNA or MARCKS shRNA and then exposed the cells to increasing concentrations of regorafenib for 72 h. In these experiments, cell viability was significantly reduced by MARCKS shRNA, compared with that in cells receiving control shRNA, at all higher doses of regorafenib in all cell lines tested (Figures 5a–d). The IC50 (half maximal inhibitory concentration) of regorafenib was deceased from 1410 to 875 nM in Caki-1 (Figure 5a), from 1423 to 937 nM in ACHN (Figure 5b), from 1153 to 571 nM in 786-O (Figure 5c) and from 1428 to 1062 nM in A498 cells (Figure 5d). To confirm this data, we demonstrated an increase in floating/dead cells in the cells with low-MARCKS expression (MARCKS shRNA) upon 48 h of regorafenib incubation (500 nM) (Figures 5e and g), and trypan blue exclusion supported the finding that MARCKS-knockdown cells were more sensitive to regorafenib (Figures 5f and h). Altogether, these data suggest that MARCKS expression is inversely associated with the efficacy of regorafenib in RCC cells.
Figure 5.
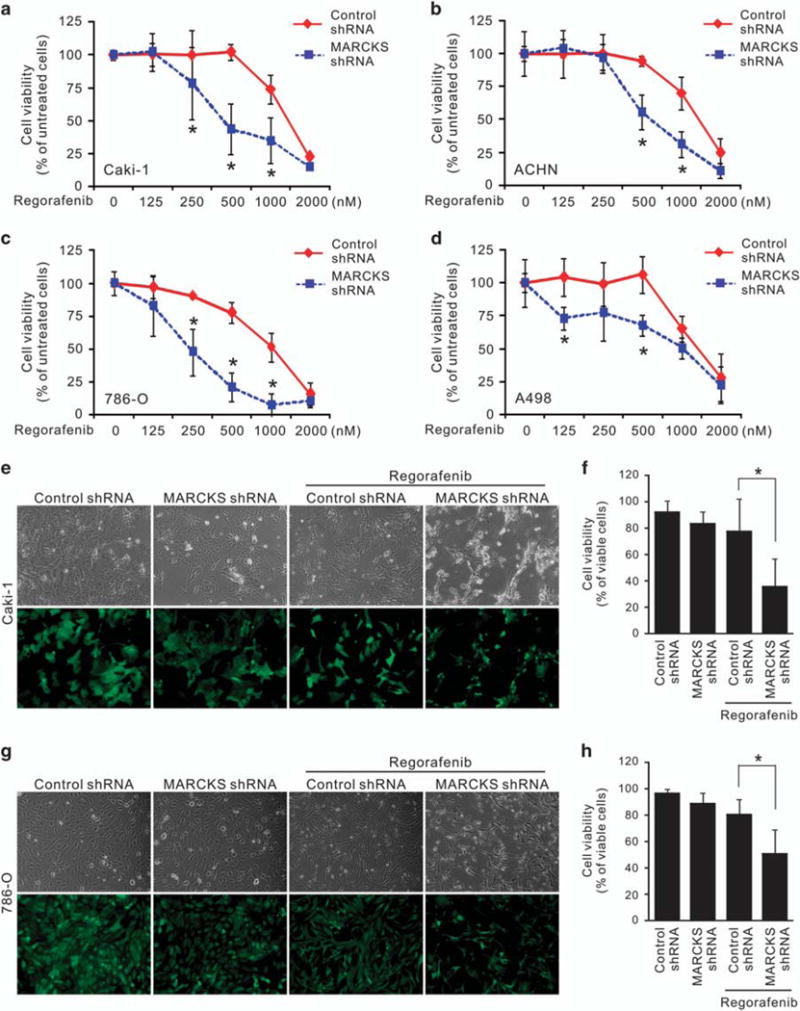
MARCKS inhibition enhances regorafenib sensitivity. Panel (a–d): knockdown of MARCKS decreases cell viability of Caki-1 (a), ACHN (b), 786-O (c) and A498 (d) cells in response to regorafenib. Cells were infected with control (non-specific) or MARCKS-specific shRNA-containing lentivirus. These cells were subjected to the indicated doses of regorafenib. After 72 h of treatment, cell viability was determined by MTT assays. Data shown as mean ± s.d.; *P<0.05 versus control shRNA (n = 3). Panel (e–h): Caki-1 (e, f) and 786-O (g, h) cells with transduction of control or MARCKS-specific shRNA were treated with 0.5 μM regorafenib. After 48 h, cell morphology (e, g, top) and transduction efficiency (e, g, bottom) was photographed; cell viability was determined by trypan blue exclusion assay (f, h, n = 3). Cell viability was calculated by the number of viable cells/the number of total cells × 100.
Synergistic antitumor efficacy of a multikinase inhibitor and MARCKS inhibition
To further confirm the influence of MARCKS on regorafenib efficacy, the RCC cell lines were treated with various doses of regorafenib (62.5–1000 nM) and/or MPS peptide (6.25–100 μM) for 72 h. After either single or combination treatment, cell viability was decreased in Caki-1 (Figure 6a), ACHN (Figure 6b), 786-O (Figure 6c) and A498 (Figure 6d) cells when treated with either regorafenib, the MPS peptide or the combination of regorafenib and MPS peptide, with the greatest inhibition of viability observed in the combination group. Furthermore, we used the Chou and Talalay CI (combination index) method44 to evaluate the therapeutic interactions between regorafenib and MPS peptide. The CI value was 0.95 in Caki-1, 0.65 in ACHN, 0.65 in ACHN, 0.54 in 786-O and 0.64 in A498 cells when the effective dose (ED) of both drugs inhibited the cell viability to 50% (Figure 6e). The addition of MPS substantially enhanced the viability suppression of regorafenib with CI value ranging from 0.54 to 0.95 (CI <1), indicating the synergistic effects of drug combination. Of note, the values were lower than 1 at ED50, approximately 1 at ED75 and above 1 at ED90 (data not shown). Thus, the combination effect was dose-dependently correlated with the components, and therefore low-dose regorafenib in combination with low dose of MPS represents a synergistic effect on cell proliferation. Simultaneously, data from trypan blue exclusion test indicated that cell survival was significantly lower with the combination treatment as compared with control, MPS and regorafenib (Figure 6f and Supplementary Figure S5a–b). These data convincingly demonstrate that MARCKS inhibition enhances regorafenib sensitivity in kidney cancer cells and represents a viable and novel option for RCC patients.
Figure 6.

MPS peptide acts synergistically with regorafenib in RCC. Panel (a–e): combinatorial effect of MPS peptide with regorafenib on RCC cell lines. Caki-1 (a), ACHN (b), 786-O (c) and A498 (d) cells were treated with various doses of regorafenib (0.0625–1 μM) and/or MPS peptide (6.25–100 μM) for 72 h, respectively. After single or combined treatment, cell viability was determined by MTS assays. (e) The Chou and Talalay CI (combination index) method was utilized to evaluate the therapeutic interactions between regorafenib and MPS peptide using the Calcusyn software. Gray line, additive effect of the combination of MPS peptide and the drug is represented at CI = 1. A CI of <1 denotes a synergistic interaction, a CI of ~ 1 denotes an additive interaction and a CI of 41 indicates an antagonistic interaction. (f) Caki-1(left) and 786-O (right) cells were individually treated with 0.5 μM regorafenib, 50 μM MPS peptide or combinations of 0.5 μM regorafenib and 50 μM MPS peptide. After 48 h, cell viability was determined by the trypan blue exclusion assay (n = 3; * P<0.05). Cell viability was calculated by the number of viable cells/the number of total cells × 100.
DISCUSSION
There is increasing evidence that the membrane-associated protein MARCKS contributes to cancer cell motility and metastasis by regulation of the cytoskeleton.18,19,22–24,27 Recent studies have indicated that an important function of MARCKS is to provide PI3K with PIP2 pools and thereby activate AKT.23,27,42 Although the contribution of MARCKS has already been characterized in a handful of solid tumors, most notably carcinomas of the lung,23,27–29 a role has yet to be demonstrated in kidney cancer. In this study, we confirm an oncogenic role of MARCKS in RCC, and we provide the first demonstration of the role of MARCKS in angiogenesis.
We now show that the MARCKS protein, and manipulation thereof, has potential clinical relevance to RCC. Increases of both MARCKS mRNA and its protein levels were noted in human RCC tumor specimens as compared with adjacent control tissue, and MARCKS expression, both on a transcriptional and translational level, positively correlated with tumor grade, indicating a potential role in tumor progression. These correlations support our proposed mechanism of MARCKS-mediated pathogenesis as well as the possibility of MARCKS as a therapeutic target in RCC, a disease in which the PI3K/AKT pathway is often deregulated and highly activated.1,10,41 To confirm these findings, we also showed that suppression of MARCKS expression inhibited proliferation, colony formation, cell spreading and AKT/mTOR activation in vitro, as well as slowed tumor growth and vasculature in vivo, providing evidence for a tumor-supporting role for MARCKS. On the basis of the expression of proliferation and apoptosis markers (proliferating cell nuclear antigen and activated caspase-3, respectively) in RCC after MARCKS silencing, it seems likely that MARCKS supports tumor growth by increasing proliferation rather than by inactivating apoptosis.
One hallmark of RCC is its high vascular density, often due to upregulated expression of pro-angiogenic targets of the HIF transcription factor. Because of RCC’s high vascularity, anti-angiogenic therapy has been shown to be clinically effective in treating the disease.5,38 However, this therapeutic strategy is rarely curative, as RCC usually develops resistance to the tyrosine kinase inhibitors.7,8,11,45 Broader inhibition of the angiogenic pathways, as was investigated in this study, might therefore result in a more durable clinical response. Two possible methods of achieving such a response include (i) the use of an inhibitor that affects multiple signaling cascades simultaneously or (ii) targeting a common upstream element of these pathways; in the case of RCC, many of these pathways share the transcriptional activator, HIF-α. Over half of sporadic clear-cell RCCs lack a functional copy of VHL, such that once HIF-1α is synthesized, protein levels will remain abnormally elevated.4,46,47 Although there are a limited number of investigational drugs that target HIF-α, mTOR, an upstream regulator of HIF-1α, is the target of numerous pharmaceutical inhibitors.6,12,38 The PI3K/AKT/mTOR axis, which drives HIF-1α translation in the majority of human cancer cell lines,48 is therefore an attractive target in RCC.
Despite their widespread clinical use, mTOR inhibition suffers drawbacks similar to VEGF-targeted therapy: RCC cells may activate mTOR-independent pathways in response to loss of mTOR signaling, often through the PI3K/AKT pathway.9,41,48 Furthermore, this pathway is involved in not only the translation of HIF-1α but in the protection of HIF-1α from degradation by VHL protein-independent pathways.49 Because PI3K and AKT control numerous downstream elements besides mTOR, it has been suggested that targeting signaling pathways upstream of mTOR in the PI3K/AKT pathway may be more effective than targeting mTOR itself.10 In light of our results showing its importance in the activation AKT and mTOR, as well as angiogenic pathways, MARCKS is a promising target for mitigating RCC progression and resistance.
We found that MARCKS inhibition resulted in a decrease in the expression of pro-angiogenic genes including VEGF. Although we did not test a wide range of HIF-1α transcriptional targets, we did show that two angiogenic factors that act along independent pathways, VEGF and MMP9, are both downregulated after MARCKS-knockdown. Of note, RCC cells displayed a reduction in the expression and secretion of VEGF upon genetic or pharmacologic inhibition of MARCKS. Gene expression analysis of patient-derived samples also revealed a correlation between MARCKS expression and VEGF expression, further supporting the clinical relevance of MARCKS as a druggable target for kidney cancer. In addition, we demonstrated in vivo the role of MARCKS in angiogenesis by showing that silencing MARCKS is able to reduce tumor microvascular density, the expression of the endothelial cell marker CD31 and VEGF.
In addition to anti-angiogenic activity via the targeting of endothelial cells, a member of the second generation of targeted therapies for RCC, regorafenib, has been shown to exhibit anti-proliferative activity via inhibition of the mitogen-activated protein kinase pathway in cancer cells;13 however, regorafenib does not address one of the resistance mechanisms of mTOR inhibition in which the PI3K/AKT pathway activates mTOR-independent downstream effectors and thereby supports continued tumor growth.9 Under treatment with this multikinase inhibitor, PI3K/AKT signaling is still active.14 Moreover, adverse effects and a low-objective response rate are common with regorafenib treatment.15,16 It seems reasonable, then, that targeting an element of PI3K/AKT signaling that could be therapeutically targeted in tandem with regorafenib administration circumvents the shortcomings of regorafenib monotherapy. Since MARCKS was shown to upregulate the AKT activity and VEGF expression, we hypothesized that combining regorafenib treatment with inhibition of MARCKS may address both of these issues: we reasoned that by reducing the secretion of VEGF ligand from cancer cells as well as by attenuating pro-survival AKT signaling in cancer cells, we could reduce the dosage of regorafenib (which inhibits the VEGF receptor) needed to produce a comparable response in a monotherapeutic regime. Combination therapy with regorafenib and inhibition of the PI3K/AKT pathway has been shown in one preclinical trial to have a synergistic effect in killing tumor cells,14 in accordance with the results of our studies. Specifically, we have demonstrated that MARCKS inhibition increases sensitivity to regorafenib and reduces the IC50 of this drug, suggesting that when combined with MARCKS inhibition, lower dosages of regorafenib can be administered to achieve the same effects, reducing exposure to toxicity. Although our knockdown and pharmacologic experiments have had promising results, it should be noted that combination therapy with regorafenib has had limited success in the clinic, with toxicity being the primary obstacle.50 Future studies on targeting MARCKS in combination therapy must no doubt prioritize investigating the mechanisms underlying the on- and off-target action of pharmacological inhibition of MARCKS to minimize this problem.
On the basis of the current evidence, the agent we used to inhibit MARCKS in this study, a novel peptide MPS, has an inhibitory effect on AKT activity,23 making it an attractive candidate for further study in combination therapy regimes. Previously, we demonstrated that MPS attenuates lung cancer growth and metastasis.23 Here we revealed that MPS reduces cancer cell proliferation and also improves the efficacy of multikinase inhibitors. To the best of our knowledge, this is the first study on the efficacy of MPS as an antitumor agent in RCC, and our results present MARCKS as a druggable target in this disease. MPS targets the phosphorylation site domain (PSD; effector domain) of MARCKS, the site where phosphorylation occurs, causing MARCKS to disassociate from the membrane and to release PIP2 pools. Indeed, several studies have shown a functional role of the MARCKS PSD in PIP2 sequestration and accumulation though its binding to PIP2 molecules.43,51,52 Therefore, there is a possibility that MARCKS in its unphosphorylated state (membrane-bound) reduces the availability of PIP2 to other molecules such as PI3K,42 thereby inactivating the PI3K/AKT pathway, as MPS did. A study on the role of MARCKS as a tumor suppressor in glioma is consistent with this proposition.20 In contrast, following phosphorylation at the PSD, phosphorylated MARCKS promotes the activation of AKT due to releasing PIP2 pools.28,42 Such a dual contribution of MARCKS may explain why an upregulation of MARCKS would not necessarily contribute to tumorigenesis,20,32 whereas an increase in MARCKS phosphorylation would.22,23,26 By reducing MARCKS phosphorylation and trapping PIP2 pools at the membrane, MPS effectively inactivates the PI3K/AKT pathway.23,42 Although treatment with MPS peptide provides a proof-of-concept that targeting MARCKS controls RCC cell growth and regorafenib efficacy, the off-target effects of this peptide in kidney cancer in vivo is an important line of investigation for future studies.
In summary, our findings here show a novel function of MARCKS, acting in RCC through activation of pro-angiogenic regulators such as VEGF and its upstream targets. We also show that inhibition of MARCKS using two separate approaches results in abrogation of angiogenic as well as proliferative properties of RCC both in vitro and in vivo. Thus, the use of anti-angiogenic therapy such as regorafenib along with MARCKS inhibition could increase the efficacy of regorafenib treatment in RCC, thereby increasing efficacy and attenuating the adverse effects associated with this therapeutic approach.
MATERIALS AND METHODS
Materials
All reagents, primers and antibodies used in this study are described in the Supplementary Methods.
Cell culture and lentiviral short hairpin RNA-mediated knockdown
The kidney cancer cell lines, Caki-1 (VHL-positive), ACHN (VHL-positive), 786-O (VHL-negative) and A498 (VHL-negative) cells, were purchased from the American Type Culture Collection (Manassas, VA, USA). Normal human primary kidney tubular epithelial (NHK) cells were purchased from Lonza (Allendale, NJ, USA). The cancer cell lines were cultured in RPMI1640 medium with 10% fetal bovine serum and 1% penicillin-streptomycin at 37 °C in a humidified atmosphere of 5% CO2. NHK cells were grown in Dulbecco’s Modified Eagle’s medium with 10% fetal bovine serum and 1% penicillin-streptomycin. For lentivirus-based short hairpin RNA-mediated knockdown, viruses were produced by co-transfection of HEK293T cells with the appropriate MARCKS shRNA-containing lentiviral vector and a packing DNA mix, using Lipofectamine 2000 (Invitrogen). The host cells were transduced with lentiviral constructs at three different multiplicities of infection in polybrene (8 μg/ml)-containing medium. Twenty-four hours after infection, the cells were treated with puromycin (2 μg/ml) and puromycin-resistant clones were selected and pooled.
Patient tumor specimens and immunohistochemical staining
Kidney tumors (from 56 patients) were obtained from patients with histologically confirmed RCC who underwent surgical resection at the UC Davis Comprehensive Cancer Center (Sacramento, CA, USA) after approval by the Institutional Review Board of the UC Davis Health System. Written informed consent was obtained from all patients. Formalin-fixed and paraffin-embedded specimens were used, and immunohistochemical staining was performed for MARCKS expression as well as phospho-MARCKS levels as described previously.23,27,28 Detailed information on staining and scoring are found in the Supplementary Methods.
Xenograft models of kidney cancer
Six-week-old male nude mice (supplied by The Jackson Laboratory) were housed and fed autoclaved food ad libitum. Detailed information on subcutaneous implantation of tumors will be found in the Supplementary Methods.
Measurement of VEGF-A secretion
The cells were plated at 1 × 10⁵ cells/well in 12-well plates in RPMI1640 containing 10% FBS overnight, and then washed with serum-free medium and cultured for additional 24 h in 0.5 ml of the serum-free medium. The supernatant was collected and centrifuged to remove cell debris. The secreted VEGF-A was quantified by ELISA using the human VEGF-A immunoassay kit according to the manufacturer’s protocols (Thermo Fisher Scientific, Carlsbad, CA, USA). VEGF-A levels were normalized to the final cell numbers determined using a hemocytometer.
Additional methods
Detailed methods on real-time reverse transcription polymerase chain reaction (RT-qPCR), immunoblotting, cell viability, migration, proliferation and colony formation assays, kinetic assay, PI(3,4,5)P3 quantitation and evaluation of therapeutic interactions are described in the Supplementary Methods.
Statistical analysis
Data are presented as the mean ± s.d. of at least three independent experiments. The quantitative in vitro and in vivo data were analyzed using the Student’s t-test. The difference in patient characteristics between the high-expression and the low-expression groups was analyzed using Fisher’s exact test. Both MARCKS and VEGF mRNA expressions in samples from data set GSE53757 and the TCGA data set were examined using Wilcoxon–Mann–Whitney test. All analyses were performed using SPSS software (v20.0; SPSS, Inc., Chicago, IL, USA). All statistical tests were two-sided, and P-values <0.05 were considered statistically significant.
Supplementary Material
Acknowledgments
The authors thank Mr Muhammad S Arif (Department of Public Health Sciences, University of California at Davis, Davis, CA, USA) for assistance with the experiments; Dr Yu-Ching Lin (UNIMED Healthcare Inc., Taiwan) and Ms Wen-Hsin Chang (Institute of Molecular Medicine, National Taiwan University College of Medicine, Taipei, Taiwan) for technological support in ForteBio system; Dr Guan-Chin Tseng (Department of Pathology, China Medical University Hospital, Taiwan) for useful advice; and the UC Davis Comprehensive Cancer Center Biorepository (University of California at Davis, Davis, CA, USA) for pathology support. This work was supported by NIH grants 1R01CA135401-01A1, 1R03CA181837-01 and 1R01DK082690-01A1, the Medical Service of the US Department of Veterans’ Affairs (all to RHW), and Dialysis Clinics, Inc. (DCI; C-3917 to C-HC).
Footnotes
CONFLICT OF INTEREST
The authors declare no conflict of interest.
Supplementary Information accompanies this paper on the Oncogene website (http://www.nature.com/onc)
References
- 1.Cancer Genome Atlas Research N. Comprehensive molecular characterization of clear cell renal cell carcinoma. Nature. 2013;499:43–49. doi: 10.1038/nature12222. [DOI] [PMC free article] [PubMed] [Google Scholar]
- 2.Cowey CL, Rathmell WK. VHL gene mutations in renal cell carcinoma: role as a biomarker of disease outcome and drug efficacy. Curr Oncol Rep. 2009;11:94–101. doi: 10.1007/s11912-009-0015-5. [DOI] [PMC free article] [PubMed] [Google Scholar]
- 3.Masoud GN, Li W. HIF-1alpha pathway: role, regulation and intervention for cancer therapy. Acta Pharm Sin B. 2015;5:378–389. doi: 10.1016/j.apsb.2015.05.007. [DOI] [PMC free article] [PubMed] [Google Scholar]
- 4.Gudas LJ, Fu L, Minton DR, Mongan NP, Nanus DM. The role of HIF1alpha in renal cell carcinoma tumorigenesis. J Mol Med. 2014;92:825–836. doi: 10.1007/s00109-014-1180-z. [DOI] [PMC free article] [PubMed] [Google Scholar]
- 5.Domblides C, Gross-Goupil M, Quivy A, Ravaud A. Emerging antiangiogenics for renal cancer. Expert Opin Emerg Drugs. 2013;18:495–511. doi: 10.1517/14728214.2013.858697. [DOI] [PubMed] [Google Scholar]
- 6.Su D, Stamatakis L, Singer EA, Srinivasan R. Renal cell carcinoma: molecular biology and targeted therapy. Curr Opin Oncol. 2014;26:321–327. doi: 10.1097/CCO.0000000000000069. [DOI] [PMC free article] [PubMed] [Google Scholar]
- 7.Joosten SC, Hamming L, Soetekouw PM, Aarts MJ, Veeck J, van Engeland M, et al. Resistance to sunitinib in renal cell carcinoma: From molecular mechanisms to predictive markers and future perspectives. Biochim Biophys Acta. 2015;1855:1–16. doi: 10.1016/j.bbcan.2014.11.002. [DOI] [PubMed] [Google Scholar]
- 8.Zhou L, Liu XD, Sun M, Zhang X, German P, Bai S, et al. Targeting MET and AXL overcomes resistance to sunitinib therapy in renal cell carcinoma. Oncogene. 2016;35:2687–2697. doi: 10.1038/onc.2015.343. [DOI] [PMC free article] [PubMed] [Google Scholar]
- 9.Santoni M, Pantano F, Amantini C, Nabissi M, Conti A, Burattini L, et al. Emerging strategies to overcome the resistance to current mTOR inhibitors in renal cell carcinoma. Biochim Biophys Acta. 2014;1845:221–231. doi: 10.1016/j.bbcan.2014.01.007. [DOI] [PubMed] [Google Scholar]
- 10.Gross-Goupil M, Massard C, Ravaud A. Targeted therapies in metastatic renal cell carcinoma: overview of the past year. Curr Urol Rep. 2012;13:16–23. doi: 10.1007/s11934-011-0232-y. [DOI] [PubMed] [Google Scholar]
- 11.Parekh H, Rini BI. Emerging therapeutic approaches in renal cell carcinoma. Expert Rev Anticancer Ther. 2015;15:1305–1314. doi: 10.1586/14737140.2015.1090315. [DOI] [PubMed] [Google Scholar]
- 12.Dorff TB, Pal SK, Quinn DI. Novel tyrosine kinase inhibitors for renal cell carcinoma. Expert Rev Clin Pharmacol. 2014;7:67–73. doi: 10.1586/17512433.2014.862496. [DOI] [PubMed] [Google Scholar]
- 13.Wilhelm SM, Dumas J, Adnane L, Lynch M, Carter CA, Schütz G, et al. Regorafenib (BAY 73-4506): a new oral multikinase inhibitor of angiogenic, stromal and oncogenic receptor tyrosine kinases with potent preclinical antitumor activity. Int J Cancer. 2011;129:245–255. doi: 10.1002/ijc.25864. [DOI] [PubMed] [Google Scholar]
- 14.Sajithlal GB, Hamed HA, Cruickshanks N, Booth L, Tavallai S, Syed J, et al. Sorafenib/regorafenib and phosphatidyl inositol 3 kinase/thymoma viral proto-oncogene inhibition interact to kill tumor cells. Mol Pharmacol. 2013;84:562–571. doi: 10.1124/mol.113.088005. [DOI] [PMC free article] [PubMed] [Google Scholar]
- 15.Eisen T, Joensuu H, Nathan PD, Harper PG, Wojtukiewicz MZ, Nicholson S, et al. Regorafenib for patients with previously untreated metastatic or unresectable renal-cell carcinoma: a single-group phase 2 trial. Lancet Oncol. 2012;13:1055–1062. doi: 10.1016/S1470-2045(12)70364-9. [DOI] [PubMed] [Google Scholar]
- 16.Zaki K, Aslam S, Eisen T. Regorafenib (BAY 73-4506): stromal and oncogenic multikinase inhibitor with potential activity in renal cell carcinoma. Curr Oncol Rep. 2013;15:91–97. doi: 10.1007/s11912-013-0292-x. [DOI] [PubMed] [Google Scholar]
- 17.Aderem A. Signal transduction and the actin cytoskeleton: the roles of MARCKS and profilin. Trends Biochem Sci. 1992;17:438–443. doi: 10.1016/0968-0004(92)90016-3. [DOI] [PubMed] [Google Scholar]
- 18.Chen X, Rotenberg SA. PhosphoMARCKS drives motility of mouse melanoma cells. Cell Signal. 2010;22:1097–1103. doi: 10.1016/j.cellsig.2010.03.003. [DOI] [PMC free article] [PubMed] [Google Scholar]
- 19.Micallef J, Taccone M, Mukherjee J, Croul S, Busby J, Moran MF, et al. Epidermal growth factor receptor variant III-induced glioma invasion is mediated through myristoylated alanine-rich protein kinase C substrate overexpression. Cancer Res. 2009;69:7548–7556. doi: 10.1158/0008-5472.CAN-08-4783. [DOI] [PubMed] [Google Scholar]
- 20.Jarboe JS, Anderson JC, Duarte CW, Mehta T, Nowsheen S, Hicks PH, et al. MARCKS regulates growth and radiation sensitivity and is a novel prognostic factor for glioma. Clin Cancer Res. 2012;18:3030–3041. doi: 10.1158/1078-0432.CCR-11-3091. [DOI] [PMC free article] [PubMed] [Google Scholar]
- 21.Brooks G, Brooks SF, Goss MW. MARCKS functions as a novel growth suppressor in cells of melanocyte origin. Carcinogenesis. 1996;17:683–689. doi: 10.1093/carcin/17.4.683. [DOI] [PubMed] [Google Scholar]
- 22.Chen CH, Cheng CT, Yuan Y, Zhai J, Arif M, Fong LW, et al. Elevated MARCKS phosphorylation contributes to unresponsiveness of breast cancer to paclitaxel treatment. Oncotarget. 2015;6:15194–15208. doi: 10.18632/oncotarget.3827. [DOI] [PMC free article] [PubMed] [Google Scholar]
- 23.Chen CH, Statt S, Chiu CL, Zhai J, Arif M, Fong LW, et al. Targeting myristoylated alanine-rich C kinase substrate phosphorylation site domain in lung cancer. Mechanisms and therapeutic implications. Am J Respir Crit Care Med. 2014;190:1127–1138. doi: 10.1164/rccm.201408-1505OC. [DOI] [PMC free article] [PubMed] [Google Scholar]
- 24.Rombouts K, Carloni V, Mello T, Omenetti S, Galastri S, Madiai S, et al. Myristoylated alanine-rich protein kinase C substrate (MARCKS) expression modulates the metastatic phenotype in human and murine colon carcinoma in vitro and in vivo. Cancer Lett. 2013;333:244–252. doi: 10.1016/j.canlet.2013.01.040. [DOI] [PubMed] [Google Scholar]
- 25.Yang Y, Chen Y, Saha MN, Chen J, Evans K, Qiu L, et al. Targeting phospho-MARCKS overcomes drug-resistance and induces antitumor activity in preclinical models of multiple myeloma. Leukemia. 2014;29(3):715–726. doi: 10.1038/leu.2014.255. [DOI] [PubMed] [Google Scholar]
- 26.Browne BC, Hochgrafe F, Wu J, Millar EK, Barraclough J, Stone A, et al. Global characterization of signalling networks associated with tamoxifen resistance in breast cancer. The FEBS journal. 2013;280:5237–5257. doi: 10.1111/febs.12441. [DOI] [PubMed] [Google Scholar]
- 27.Chen CH, Thai P, Yoneda K, Adler KB, Yang PC, Wu R. A peptide that inhibits function of Myristoylated Alanine-Rich C Kinase Substrate (MARCKS) reduces lung cancer metastasis. Oncogene. 2014;33:3696–3706. doi: 10.1038/onc.2013.336. [DOI] [PMC free article] [PubMed] [Google Scholar]
- 28.Chen CH, Chiu CL, Adler KB, Wu R. A novel predictor of cancer malignancy: up-regulation of myristoylated alanine-rich C kinase substrate phosphorylation in lung cancer. Am J Respir Crit Care Med. 2014;189:1002–1004. doi: 10.1164/rccm.201401-0053LE. [DOI] [PMC free article] [PubMed] [Google Scholar]
- 29.Hanada S, Kakehashi A, Nishiyama N, Wei M, Yamano S, Chung K, et al. Myristoylated alanine-rich C-kinase substrate as a prognostic biomarker in human primary lung squamous cell carcinoma. Cancer Biomark. 2013;13:289–298. doi: 10.3233/CBM-130354. [DOI] [PubMed] [Google Scholar]
- 30.Naboulsi W, Megger DA, Bracht T, Kohl M, Turewicz M, Eisenacher M, et al. Quantitative tissue proteomics analysis reveals versican as potential biomarker for early-stage hepatocellular carcinoma. J Proteome Res. 2016;15:38–47. doi: 10.1021/acs.jproteome.5b00420. [DOI] [PubMed] [Google Scholar]
- 31.Brandi J, Pozza ED, Dando I, Biondani G, Robotti E, Jenkins R, et al. Secretome protein signature of human pancreatic cancer stem-like cells. J Proteomics. 2016;136:1–12. doi: 10.1016/j.jprot.2016.01.017. [DOI] [PubMed] [Google Scholar]
- 32.Bickeboller M, Tagscherer KE, Kloor M, Jansen L, Chang-Claude J, Brenner H, et al. Functional characterization of the tumor-suppressor MARCKS in colorectal cancer and its association with survival. Oncogene. 2015;34:1150–1159. doi: 10.1038/onc.2014.40. [DOI] [PubMed] [Google Scholar]
- 33.Greene CS, Krishnan A, Wong AK, Ricciotti E, Zelaya RA, Himmelstein DS, et al. Understanding multicellular function and disease with human tissue-specific networks. Nat Genet. 2015;47:569–576. doi: 10.1038/ng.3259. [DOI] [PMC free article] [PubMed] [Google Scholar]
- 34.Josic D, Clifton JG, Kovac S, Hixson DC. Membrane proteins as diagnostic biomarkers and targets for new therapies. Curr Opin Mol Ther. 2008;10:116–123. [PubMed] [Google Scholar]
- 35.von Roemeling CA, Radisky DC, Marlow LA, Cooper SJ, Grebe SK, Anastasiadis PZ, et al. Neuronal pentraxin 2 supports clear cell renal cell carcinoma by activating the AMPA-selective glutamate receptor-4. Cancer Res. 2014;74:4796–4810. doi: 10.1158/0008-5472.CAN-14-0210. [DOI] [PMC free article] [PubMed] [Google Scholar]
- 36.Wettersten HI, Hakimi AA, Morin D, Bianchi C, Johnstone ME, Donohoe DR, et al. Grade-dependent metabolic reprogramming in kidney cancer revealed by combined proteomics and metabolomics analysis. Cancer Res. 2015;75:2541–2552. doi: 10.1158/0008-5472.CAN-14-1703. [DOI] [PMC free article] [PubMed] [Google Scholar]
- 37.Hanahan D, Weinberg RA. Hallmarks of cancer: the next generation. Cell. 2011;144:646–674. doi: 10.1016/j.cell.2011.02.013. [DOI] [PubMed] [Google Scholar]
- 38.Posadas EM, Limvorasak S, Sharma S, Figlin RA. Targeting angiogenesis in renal cell carcinoma. Expert Opin Pharmacother. 2013;14:2221–2236. doi: 10.1517/14656566.2013.832202. [DOI] [PubMed] [Google Scholar]
- 39.Maroto P, Rini B. Molecular biomarkers in advanced renal cell carcinoma. Clin Cancer Res. 2014;20:2060–2071. doi: 10.1158/1078-0432.CCR-13-1351. [DOI] [PubMed] [Google Scholar]
- 40.Koh MY, Lemos R, Jr, Liu X, Powis G. The hypoxia-associated factor switches cells from HIF-1alpha- to HIF-2alpha-dependent signaling promoting stem cell characteristics, aggressive tumor growth and invasion. Cancer Res. 2011;71:4015–4027. doi: 10.1158/0008-5472.CAN-10-4142. [DOI] [PMC free article] [PubMed] [Google Scholar]
- 41.Sourbier C, Lindner V, Lang H, Agouni A, Schordan E, Danilin S, et al. The phos-phoinositide 3-kinase/Akt pathway: a new target in human renal cell carcinoma therapy. Cancer Res. 2006;66:5130–5142. doi: 10.1158/0008-5472.CAN-05-1469. [DOI] [PubMed] [Google Scholar]
- 42.Ziemba BP, Burke JE, Masson G, Williams RL, Falke JJ. Regulation of PI3K by PKC and MARCKS: single-molecule analysis of a reconstituted signaling pathway. Biophys J. 2016;110:1811–1825. doi: 10.1016/j.bpj.2016.03.001. [DOI] [PMC free article] [PubMed] [Google Scholar]
- 43.Kalwa H, Michel T. The MARCKS protein plays a critical role in phosphatidylinositol 4,5-bisphosphate metabolism and directed cell movement in vascular endothelial cells. J Biol Chem. 2011;286:2320–2330. doi: 10.1074/jbc.M110.196022. [DOI] [PMC free article] [PubMed] [Google Scholar]
- 44.Chou TC, Talalay P. Quantitative analysis of dose-effect relationships: the combined effects of multiple drugs or enzyme inhibitors. Adv Enzyme Regul. 1984;22:27–55. doi: 10.1016/0065-2571(84)90007-4. [DOI] [PubMed] [Google Scholar]
- 45.Han KS, Raven PA, Frees S, Gust K, Fazli L, Ettinger S, et al. Cellular adaptation to VEGF-targeted antiangiogenic therapy induces evasive resistance by overproduction of alternative endothelial cell growth factors in renal cell carcinoma. Neoplasia. 2015;17:805–816. doi: 10.1016/j.neo.2015.11.001. [DOI] [PMC free article] [PubMed] [Google Scholar]
- 46.Kaelin WG., Jr The von Hippel-Lindau tumor suppressor gene and kidney cancer. Clin Cancer Res. 2004;10:6290S–6295S. doi: 10.1158/1078-0432.CCR-sup-040025. [DOI] [PubMed] [Google Scholar]
- 47.Choueiri TK, Fay AP, Gagnon R, Lin Y, Bahamon B, Brown V, et al. The role of aberrant VHL/HIF pathway elements in predicting clinical outcome to pazopanib therapy in patients with metastatic clear-cell renal cell carcinoma. Clin Cancer Res. 2013;19:5218–5226. doi: 10.1158/1078-0432.CCR-13-0491. [DOI] [PMC free article] [PubMed] [Google Scholar]
- 48.Karar J, Maity A. PI3K/AKT/mTOR pathway in angiogenesis. Front Mol Neurosci. 2011;4:51. doi: 10.3389/fnmol.2011.00051. [DOI] [PMC free article] [PubMed] [Google Scholar]
- 49.Zhou J, Schmid T, Frank R, Brune B. PI3K/Akt is required for heat shock proteins to protect hypoxia-inducible factor 1alpha from pVHL-independent degradation. J Biol Chem. 2004;279:13506–13513. doi: 10.1074/jbc.M310164200. [DOI] [PubMed] [Google Scholar]
- 50.Ferraro D, Zalcberg J. Regorafenib in gastrointestinal stromal tumors: clinical evidence and place in therapy. Ther Adv Med Oncol. 2014;6:222–228. doi: 10.1177/1758834014544892. [DOI] [PMC free article] [PubMed] [Google Scholar]
- 51.Rauch ME, Ferguson CG, Prestwich GD, Cafiso DS. Myristoylated alanine-rich C kinase substrate (MARCKS) sequesters spin-labeled phosphatidylinositol 4,5-bisphosphate in lipid bilayers. J Biol Chem. 2002;277:14068–14076. doi: 10.1074/jbc.M109572200. [DOI] [PubMed] [Google Scholar]
- 52.Rohrbach TD, Shah N, Jackson WP, Feeney EV, Scanlon S, Gish R, et al. The effector domain of MARCKS is a nuclear localization signal that regulates cellular PIP2 levels and nuclear PIP2 localization. PloS One. 2015;10:e0140870. doi: 10.1371/journal.pone.0140870. [DOI] [PMC free article] [PubMed] [Google Scholar]
Associated Data
This section collects any data citations, data availability statements, or supplementary materials included in this article.