Abstract
Assessing the quality of tissue engineered (TE) cartilage has historically been performed by endpoint measurements including marker gene expression. Until the adoption of promoter-driven reporter constructs capable of quantitative and real time non-destructive expression analysis, temporal gene expression assessments along a timeline could not be performed on TE constructs. We further exploit this technique to utilize microRNA (miRNA or miR) through the use of firefly luciferase reporter (Luc) containing a 3’ UTR perfect complementary target sequence to the mature miR-145-5p. We report the development and testing of a firefly luciferase (Luc) reporter responsive to miR-145-5p for longitudinal tracking of miR-145-5p expression throughout MSC chondrogenic differentiation.
Plasmid reporter vectors containing a miR-145-5p responsive reporter (Luc reporter with a perfect complementary target sequence to the mature miR-145-5p sequence in the 3’UTR), a Luc reporter driven by a truncated Sox9 (one of the targets of miR-145-5p) promoter, or the Luc backbone (control) vector without a specific miRNA target were transfected into MSCs by electroporation. Transfected MSCs were mixed with untransfected MSC to generate chondrogenic pellets. Pellets were imaged by bioluminescent imaging (BLI) and harvested along a preset time line.
The imaging signals from miR-145-5p responsive reporter and Sox9 promoter-driven reporter showed correlated time-courses (measured by BLI and normalized to Luc-control reporter; Spearman r=0.93, p=0.0002) during MSC chondrogenic differentiation. Expression analysis by qRT-PCR suggests an inverse relationship between miR-145-5p and Sox9 gene expression during MSC chondrogenic differentiation.
Non-destructive cell-pellet imaging is capable of supplementing histological analyses to characterize TE cartilage. The miR-145-5p responsive reporter is relatively simple to construct and generates a consistent imaging signal responsive to miR-145-5p during MSC chondrogenesis in parallel to certain molecular and cellular events.
Keywords: MicroRNA, miR-145, MSC, Chondrogenesis, Sox9
Introduction
Quality evaluation of tissue engineered (TE) cartilage constructs will require the assessment of markers for optimal biological properties. These markers include cartilage-related genes such as Sox9 as well as other regulators of gene expression such as microRNAs (miRNA or miR). Currently, testing for these markers/factors involves endpoint quantifications based on immunohistochemistry (IHC) or quantitative real-time polymerase chain reaction (qRT-PCR) methodologies. While these techniques are accepted as “standard” metrics, alternative nondestructive, and longitudinal methods would improve the tracking of key molecular and cellular events during chondrogenic differentiation of human mesenchymal stem cells (hMSCs). Promoter-driven reporters have been developed previously and used to track chondrogenic markers such as aggrecan (ACAN), type II collagen (Col2), COMP, RUNX2, and Sox9 [1–3]. However, the tracking of small non-coding RNA molecules such as miRNAs has only recently been attempted. miRNAs suppress gene expression in a post-transcriptional fashion, and target many different genes simultaneously [4]. Each miRNA pairs with a nearly complimentary sequence found within target gene mRNA transcripts with kinetics based on thermal hybridization efficiency. The binding of a miRNA leads to reduced target mRNA translation through either degradation or sequestration [5]. In this study, we show the development of a luciferase (Luc) reporter construct negatively responsive to the expression of miR-145-5p, an important miRNA relevant to chondrogenic differentiation of MSC. This construct produces a Luc mRNA transcript containing a 3’UTR perfectly complementary sequence to that of the mature miR-145-5p. miR-145-5p was chosen because it targets gene transcripts that are known to have dynamic expression during MSC chondrogenic differentiation.
As an obligatory gene for chondrogenesis, the transcription factor SRY-related high-mobilitygroup box 9 (Sox9) is indispensable for MSC chondrogenic differentiation [6]. The Sox9 promoter has been used to drive Luc reporter expression in other cell lines [3] and is potentially useful for tracking early events in MSC chondrogenesis. Sox9 expression is low in bone marrow-derived undifferentiated MSC and increases in response to differentiation cues present in chondrogenic differentiation medium, until hypotrophy and ossification stages occur [7]. While the traditional marker gene promoter-driven reporter systems such as those driven by the Sox9 promoter are useful, additional reporter systems are sought for several reasons. Primarily, promoter/reporter systems have been designed to express mRNA, which is transcribed by RNA polymerase III. This bias for mRNA transcripts limits the potential to promoters of genes encoding for proteins ignoring entirely non-coding RNAs (like miRNA), which participate in innumerable biological pathway regulation. Additionally, small changes in promoter activity yielding large biological effects may lack a detectable activation when driving the reporter gene expression and thus limit quantification resolution. Also, promoter identification and optimization remains a lengthy process for chondrogenesis-specific promoter sequences appropriate for driving reporter expression [3]. We therefore endeavored to design a reporter construct responsive to miR-145-5p, a non-coding RNA thought to influence the expression of a variety of genes dynamically regulated throughout MSC chondrogenic differentiation.
To this end, a miR-145-5p responsive Luc reporter containing a miR-145-5p perfect complementary target sequence (PT) in the 3’UTR of the Luc mRNA and under the control of a strong and constitutively active promoter was constructed and tested to investigate the expression patterns of miR-145-5p during the process of MSC chondrogenesis. Since Sox9 is a direct target of miR-145 [8,9], the endogenous miR-145-5p targets both the mRNA of marker gene Sox9 and the transcript of the miR-145-5p responsive Luc reporter. Therefore, Sox9 expression was also examined during the same process of MSC chondrogenesis. The outcome will guide further evaluation of the utility of such miRNA-responsive reporters for tracking MSC chondrogenic differentiation and TE cartilage optimization.
Methods
Procurement of human MSCs
The MSCs were obtained from bone marrow aspirate from normal healthy donors after informed consent, as described previously [10], under a protocol approved by the Institutional Review Board of the University Hospitals Cleveland Medical Center. Primary cultures of MSC were generated by the Case Center for Multimodal Evaluation of Engineered Cartilage (CCMEEC).
Reporter constructs
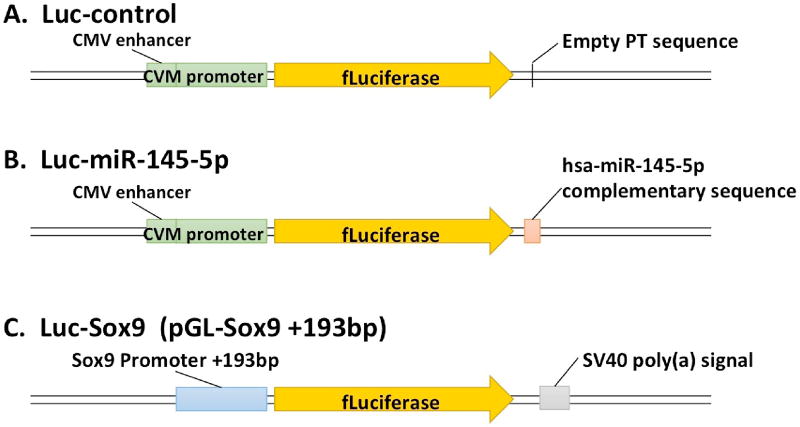
The miR-145-5p responsive reporter contains Luc (Figure 1A) with one Perfect complementary Target sequence repeat (PT) to the mature human miR-145-5p sequence within the 3’UTR of Luc (Luc-miR-145-5p). The expression of Luc is driven by the CMV immediate early enhancer and the CMV immediate early promoter sequences located upstream of the Luc transcriptional start site. The Luc-control reporter vector construct is shown in Figure 1B, is identical to reporter described above, but lacks the PT to miR-145-5p and is unresponsive to endogenous miRNA expression.
Figure 1. Luciferase reporters.
A) miR-145-5p responsive reporter contains firefly luciferase (Luc) with one Perfect complementary Target sequence repeats (PT) to the mature human miR- 145-5p sequence within the 3’UTR of Luc. The expression of Luc is driven by the CMV immediate early enhancer and the CMV immediate early promoter sequences located upstream of the Luc transcriptional start site; B) Luc-control reporter vector construct is identical to reporter described above, but without the PT to miR-145; C) Sox9 promoter-driven luciferase reporter construct is a truncated mouse Sox9 promoter segment that contains only a short sequence −193bp proximal to the promoter, a product of sequential deletions of the Sox9 promoter region, which produces maximal luciferase signal, and is no longer tissue-dependent.
The traditional Sox9 promoter-driven luciferase reporter (Luc-Sox9) construct is shown in Figure 1C, (a generous gift from Dr. Peter Koopman of the University of Queensland, Australia) and was used originally for investigating campomelic dysplasia and autosomal sex-reversal in mice [3]. This truncated mouse Sox9 promoter segment contains the −193 bp proximal Sox9 promoter sequence. The −193 bp upstream region was identified as the minimal Sox9 promoter sequence to produce the maximal tissue-independent luciferase signal [3].
Reporter transfection
Early passage MSCs (p2) were grown DMEM-low glucose media supplemented with Antibiotic: Antimycotic (Thermo Fisher) and 10% FBS (Thermo Fisher, MSC certified by CCMEEC). Cells were used to generate chondrogenic pellets no later than the fourth passage. MSCs were washed with Tyrode’s solution and trypsinized with 0.25% trypsin-EDTA (Gibco). Cells (5 × 10⁵ MSCs per reaction) were transfected with either Luc-miR-145-5p (Luc driven by CMV promoter/enhancer containing the miR-145-5p PT sites), or Luc-control (Luc reporter driven by CMV promoter/enhancer without the PT site), or Luc-Sox9 (Sox9 promoter-driven Luc) via electroporation (Nucleofector II, Lonza) with the high efficiency transfection setting according to manufacture’s protocol. For each transfection reaction 2 ug of plasmid DNA was used. After, transfection MSCs were seeded in MSC medium and allowed to recover for 5 days.
Pellet culture
One week after reporter transfection, viable transfected MSCs were mixed with untransfected MSCs 1:1 from the same donor to reach the number of the cells required to generate enough chondrogenic pellets for use in this time-course study. The only exception is the untransfected cells, which needed no mixture. On Day 0, 0.125 × 10⁶ transfected MSC (p4) cells were combined with 0.125 × 10⁶ untransfected MSC (p4) per well were plated in sterile 96-well polypropylene plates containing chondrogenic pellet medium consisting of: DMEM-high glucose, 1% ITS+ (Becton Dickinson), dexamethasone (10-7 M), sodium pyruvate (1 mM), ascorbic acid-2 phosphate (120 µM), and non-essential amino acids (100 µM). The plates were centrifuged at 1250 g for 5 minutes and the media was replaced with chondrogenic differentiation media, which consists of the chondrogenic pellet media supplemented with 10 ng/ml TGF-β1. Media was changed every 2–3 days.
Bioluminescent Imaging
3 to 6 cell pellets were randomly selected for bioluminescent imaging (BLI) on Days 3, 6, 10, 12, 14, 16, 18, 20 and 26, using an IVIS spectrum imager (PerkinElmer, CA). The selected pellets were removed from initial 96-well plate and placed in a new 96-well, clear bottom black plate (BD Life Sciences) to monitor BLI signal during chondrogenesis from the reporters transfected into MSCs. During each imaging session, the substrate D-luciferin potassium salt from Promega (Madison, WI) was added to the wells containing pellets. Imaging was done at 1, 5, 10 and 15 min after the addition of D-luciferin, each with 1 min exposure. The 10 min time point was chosen when the BLI signals seemed to be stabilized and thus suitable for quantification across all days and for all pellets for consistency (see supplementary materials). After imaging, half of the pellets were saved for RNA extraction and subsequent real-time quantitative PCR (qRT-PCR) analysis of miR-145-5p and Sox9 expression, and the other half for histology analysis described below.
Total RNA extraction and qRT-PCR
After each imaging session, half of the harvested pellets were homogenized and total RNA was isolated with the RNeasy Mini Kit (Qiagen). RNA quantity and quality were measured with a NanoDrop instrument (NanoDrop). cDNA was generated from 10 ng of RNA by reverse transcription using the TaqMan microRNA reverse transcription kit (Applied Biosystems, Carlsbad, CA), including the miR-145-5p specific primer (Applied Biosystems) in the reaction. Reverse transcription was followed by qRT-PCR with a TaqMan PCR master mix (Applied Biosystems) and the miR-145-specific TaqMan probe (Applied Biosystems). Normalization of the miRNA expression data was done with the endogenous control gene U6 (small nucleolar RNA), it was assigned an arbitrary value of 1. For mRNA expression analysis, cDNA was generated from total RNA (100 ng) using the High-Capacity RNA-to-cDNA kit (Applied Biosystems), including oligo(dT)18 primers, according to the manufacturer’s instructions. PCR reactions were performed with TaqMan PCR master mix (Applied Biosystems) and the appropriate mRNA-specific TaqMan probe (Applied Biosystems) for Sox 9. All the PCR reactions were performed in triplicate using StepOne system (Applied Biosystems).
Expression data was obtained for each gene from each sample as threshold cycle (Ct). ΔCt was calculated as the Ct of endogenous control gene minus the Ct of the gene of interest. ΔΔCt was then calculated as the ΔCt of the reference sample minus the ΔCt of another sample. This sets the ΔΔCt of the reference sample to 0. The relative quantification of gene expression (RQ) was calculated as 2−(ΔΔCt). This yields an RQ for the reference sample as 1. Samples with more transcripts than the reference sample will have negative ΔΔCt scores and larger RQ values.
Histological analysis
Half of the pellets were harvested and fixed in 10% formalin for paraffin sectioning after imaging. Sections were stained with Safranin O to detect cartilage extracellular matrix (ECM) proteoglycans. Adjacent sections were also immunohistochemically (IHC) stained with antibody to Sox9. Except for the early days (3 and 6), hematoxylin and eosin (H&E) stained sections were obtained for all harvest days.
Data Analysis
Data were analyzed with Living Image Software v4.5 (Caliper Life Science) by drawing regions of interest (ROIs) over each photon-emitted pellet. The unit of choice for signal intensity is radiance (photons/second from the surface) in each pixel, summed over the ROI area, in a square centimeter (cm2) of the pellet. These data were multiplied by one steradian (sr). The photon radiance is displayed as the average radiance, which is the sum of the radiance from each pixel inside the ROI/number of pixels or superpixels (photons/sec/cm2/sr). Two types of ROI were used for bioluminescent quantification: 1) pellet ROI (each photon-emitted pellet); and 2) the averaged background ROI, which measures the background signal in the area and corrects the bioluminescent emission by subtraction. Time curves of BLI signals were generated from the pellets expressing the miR-145-5p responsive reporter (Luc-miR-145-5p), Luc-control, and the Sox9 promoter-driven reporter (Luc-Sox9) and calculated with pellet ROIs placed over these pellets in the wells. Normalization of the reporter signals was performed by dividing the imaging signal intensity from using either Luc-miR-145-5p reporter or Luc-Sox9 reporter with that from using the Luc-control reporter along the time line to account for transfection efficiency, reporter longevity, or any other effects on the promoter. For each experiment, the data represent the average of three independent pellets in each day of imaging. qRT-PCR for levels of Sox9 mRNA and miR-145-5p were quantified as relative quantification (RQ) to a reference from RNA extracts from the samples along a set of time points after BLI. Histology analyses were performed along the same timeline for other samples. With these data, the following statistical analyses were conducted:
To check for similarity between BLI signal profiles (imaging intensity time activity curves) from the pellets transfected with either Sox9 promoter-driven reporter (Luc-Sox9)) or miR-145-5p responsive reporter (Luc-miR-145-5p) by checking their correlation and concordance. Concordance was tested using Spearman’s correlation coefficient, where the null value is zero (no concordance) and values of −1 or +1 indicate perfect negative or positive concordance, respectively;
To confirm the inverse relationship between quantitative Sox9 mRNA levels with corresponding miR-145-5p level from the same pellets using Spearman correlations;
To determine if Sox9 mRNA profile from qRT-PCR relates with the BLI imaging profile from using Sox9 promoter-driven reporter, using simple linear regression. Using similar methods, qRT-PCR results of miR-145-5p level with imaging signal profile from miR-145-5p responsive reporter.
Results
Overview
In this study, longitudinal imaging during MSC chondrogenesis was performed with two reporter systems: a traditional Sox9 native 5’UTR promoter-driven Luc reporter and the newly designed 3’UTR downstream of a Luc reporter containing the miR-145-5p target, and compared to a control Luc reporter. Specifically, three cohorts of early passage (p4) MSCs from the same donor were transfected by electroporation with either: 1) the Sox9 promoter-luciferase reporter construct (Sox9-Luc), or 2) the miR-145-PT-luciferase reporter construct (miR-145-5p–Luc), or 3) the control luciferase reporter construct (Luc-control). Electroporation was used as it maintains multipotentiality and proliferation rates at levels comparable to untreated cells [11]. Seven days after seeding, transfected MSCs were mixed with untransfected MSCs to ensure the formation of the pellets, and chondrogenic pellets were generated as described above. Control pellets from untransfected MSC pellets (UTP) were also generated for comparison.
Bioluminescent imaging
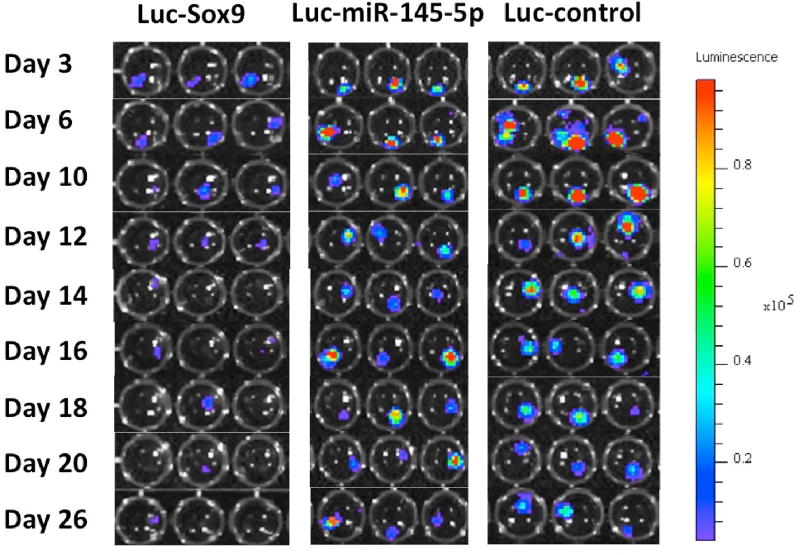
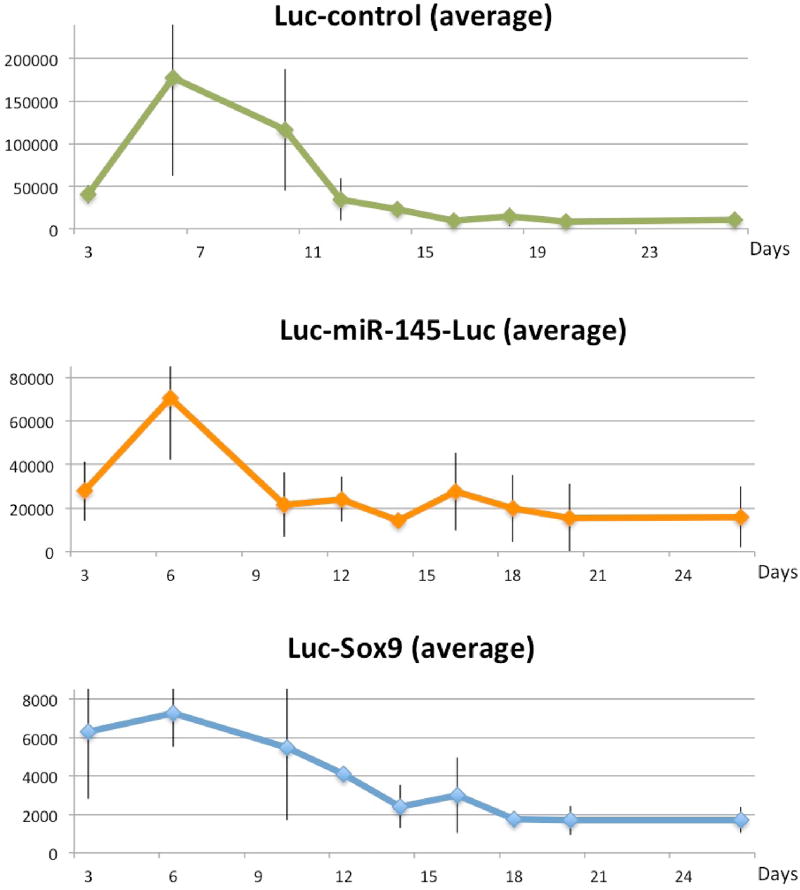
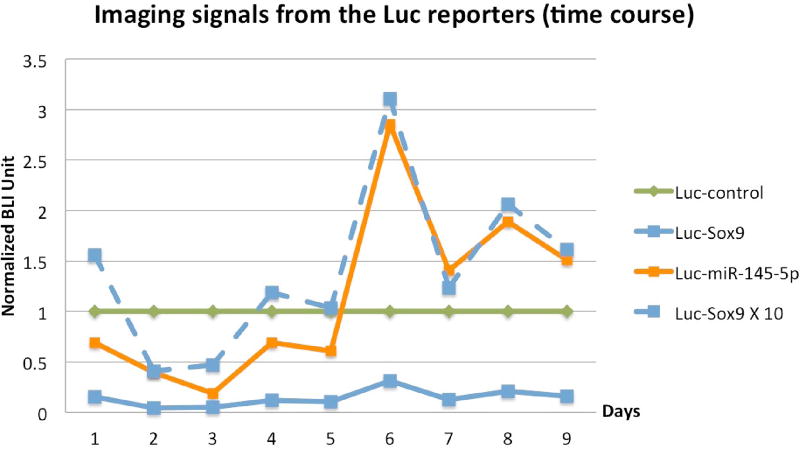
In order to track miR-145-5p and Sox9 expression, we measured luciferase activity at several time points following initial pellet formation (Figure 2). ROIs were placed over each pellet to generate the average luciferase activity for the pellets harvested at each time point (Figure 3). Luciferase signals in all samples declined rapidly following transfection, as expected, because transiently transfected reporters degrade over time. It is known that the signal intensity from luciferase reporters following substrate D-luciferin addition is never plateaued with time [12], as experienced in this study (see Figure S2 for daily imaging details in supplementary materials). For quantification consistency, the time point for BLI signal quantification for all pellets on any imaging day was chosen to be 10 min post-D-luciferin addition because light output stabilized for most pellets by 10 min (Figure S2 in supplementary materials). The BLI signal intensity observed from Luc-control pellets was greater than miR-145-5p–Luc pellets. Luc-control pellets were one order of magnitude more intense than Sox9-Luc pellets which is consistent with the difference between native promoter activities comparing to the stronger CMV promoter. When the BLI signal from the prospective miR-145-5p–Luc and pSox9-Luc pellets was normalized to Luc-control pellet activity, time-activity curves were closely correlated throughout MSC chondrogenic differentiation (Figure 4) (Spearman r = 0.93, p = 0.0002). BLI results were normalized to Luc-control expression levels to account for the transient nature of transfected reporter and subsequent degradation as demonstrated in supplementary Figure S1.
Figure 2.
Bioluminescent imaging (BLI) of pellets transfected with luciferase reporters. This is a collection of well-plate imaging taken at 10 min after the addition of imaging substrate Dluciferin. Figure S2 in supplementary provides the all imaging data.
Figure 3.
BLI signal (raw imaging curves with error bars) from using the luciferase reporters transfected into prospective pellets as (from the top): Luc-control, Luc-miR-145-5p and Luc- Sox9 (see text).
Figure 4.
Normalized BLI time intensity courses showing a correlation (Spearman r = 0.93, p = 0.0002) between signals from using Luc-miR-145-5p and Luc-Sox9 reporters. The signal intensity from Luc-miR-145-5p is one order of magnitude higher than that from Luc-Sox9 (the dotted blue line is the solid blue line times 10).
Sox9 mRNA and miR-145-5p gene expression during chondrogenic differentiation
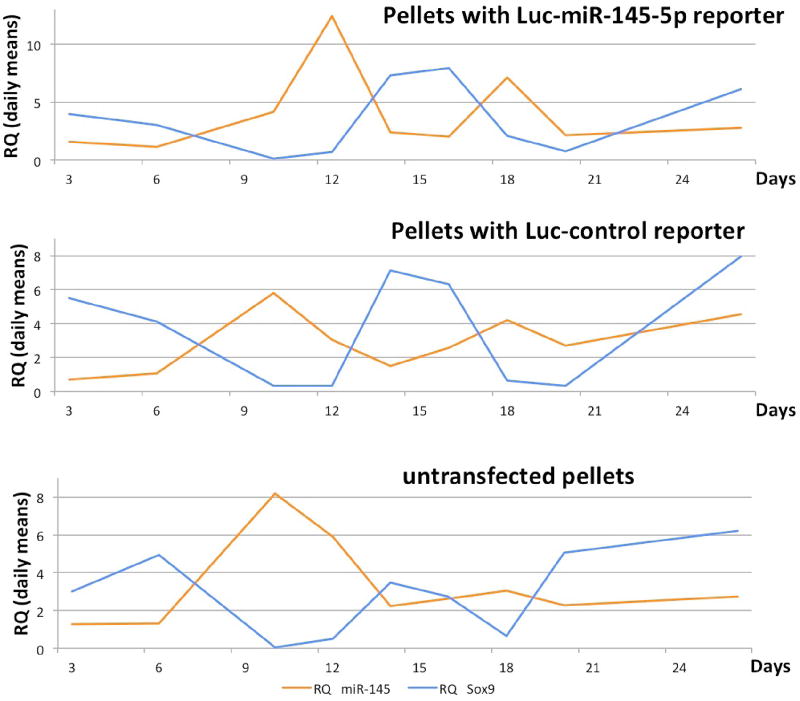
Relative quantification of Sox9 mRNA and miRNA-145-5p was determined for each transfection (pmiR-145-5p–Luc, pSox9-Luc, Luc-control, and UTP) for validation and correlation. Each time after BLI (Days 3, 6, 10, 12, 14, 16, 18, 20 and 26), 3 pellets from each group were harvested and homogenized for further RNA extraction or histology. Expression analysis by qRT-PCR suggested an inverse relationship (Figure 5) between miR-145-5p and mRNA of Sox9 expression during MSC chondrogenic differentiation for pellets transfected with pmiR-145- 5p–Luc (Spearman r = −0.50, p = 0.17), Luc-control (Spearman r = −0.34, p = 0.08) and untransfected pellets (Spearman r = −0.63, p = 0.05).
Figure 5.
Expression analysis by qRT-PCR of extracted RNAs from pellets after imaging at each time point. The relationship between miR-145-5p and mRNA of Sox9 expression during the time course was estimated for pellets transfected with Luc-miR-145-5p (Spearman r = −0.50, p=0.17), Luc-control (Spearman r = −0.343, p=0.08) and untransfected (Spearman r = −0.63, p=0.051).
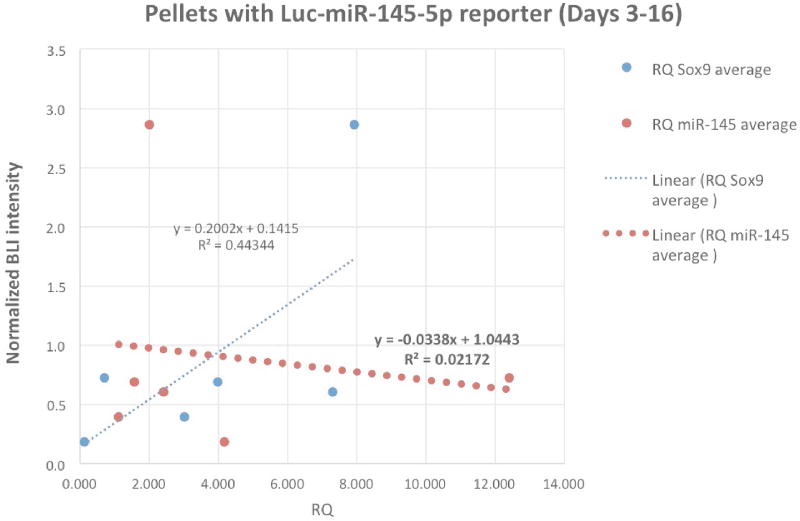
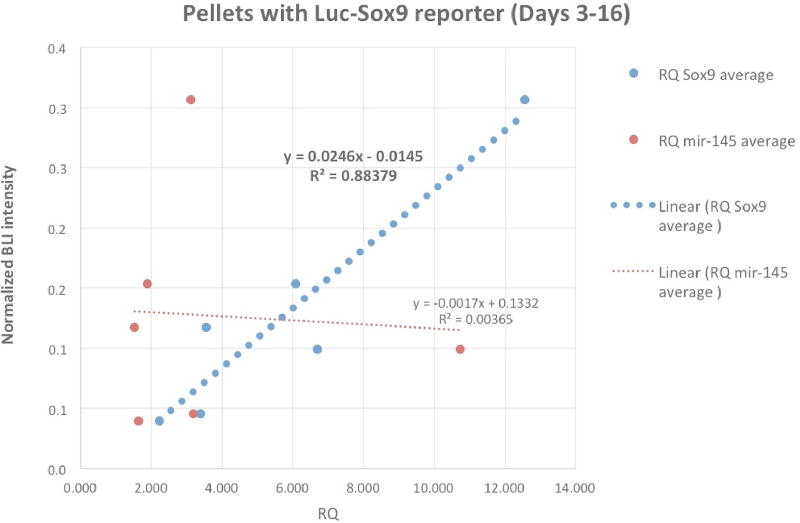
For pmiR-145-Luc pellets, correlation between normalized BLI signal and miR-145 expression up to Day 16 was evaluated using linear regression as shown in Figure 6A. Figure 6B showed the similar linear regression between normalized BLI signal and the level of Sox9 mRNA assayed from the pSox9-Luc pellets along the same time line. Due to the exponential decay of the imaging signals from transiently transfected reporters, normalized signal intensity became seemingly unreliable beyond Day 16 towards the end of the experiment.
Figure 6.
Correlation between the imaging signal (BLI) from using the reporter and its associated endogenous gene expression (PCR) with the dotted lines for linear regression (Days 3 – 16). A) The thick orange dotted line shows regression in pellets transfected with Luc-miR- 145-5p reporter between normalized BLI signal vs. miR-145-5p level from qRT-PCR.
B) The thick blue dotted line showing regression in Luc-Sox9 transfected pellets between normalized BLI signal vs. Sox9 mRNA from qRT-PCR.
Histology
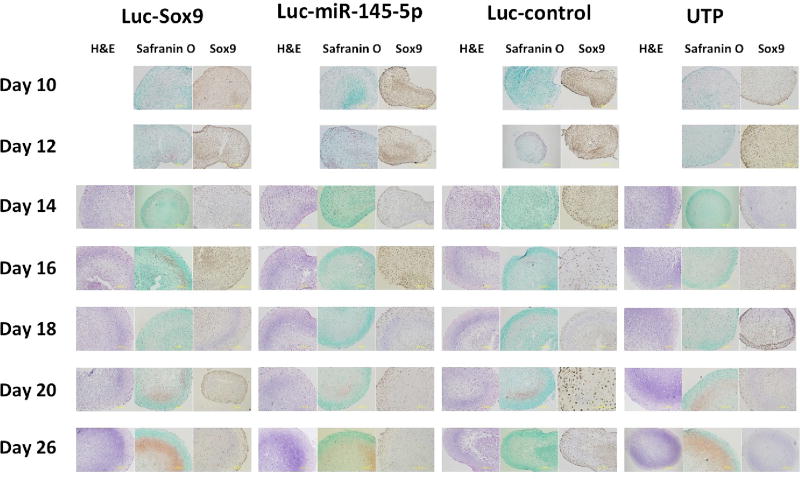
Histology analysis (Figure 7) for pellets collected along the time-line showed similar staining between groups of pellets indicating that the reporter transfection did not significantly alter MSC chondrogenic differentiation potential.
Figure 7.
Collection of histology analyses of reprehensive pellets harvested after imaging at each time point.
Discussion
Cartilage is a specialized connective tissue required for the functioning of a variety of other tissues and is especially important for healthy joint function but has limited self-repair capabilities [13]. TE cartilage would be useful to repair joint surfaces where the native cartilage has been compromised. The key to the success of this repair is to mimic developmental events within MSC in TE cartilage constructs. However, little is known regarding the differences between inherent articular cartilage development and induced MSC chondrogenic differentiation. Currently, methods to evaluate engineered tissue for cartilage repair involve destructive histological-morphological examination and IHC staining for markers such as ACAN, Col2, or Sox9. While histological analysis is capable of characterizing molecular and cellular processes associated with TE cartilage, non-destructive imaging can uniquely supplement these analyses optimizing TE cartilage non-invasively. TE cartilage optimization is an iterative process, and tracking the key molecular and cellular events sequentially with imaging will facilitate this optimization by providing longitudinal analysis during construct maturation and feedback through iterations.
This study was designed to test a reporter construct responsive to endogenous miR-145 expression during MSC chondrogenic differentiation. Baseline MSCs express miR-145-5p [8]. The transcript of the miR-145-5p responsive reporter is therefore targeted and degraded, and the Luc reporter activity was expected to be reduced. The initial low activity in miR-145-5p responsive reporter was indeed observed when miR-145-5p expression in MSC is expected. Subsequently, as cells are prompted to undergo chondrogenesis, endogenous miR-145-5p expression is suppressed [8], and the reporter activity is expected to increase. When the miR-145-5p responsive Luc reporter responds to declining miR-145-5p levels, an increase in Luc activity was observed. This would coincide with increased Sox9 expression [9]. Upon induction of MSC chondrogenic differentiation, Sox9 expression is indeed increased [6] and the luciferase reporter driven by the Sox9 promoter is expected to become more active to drive luciferase expression for increased light output. The comparison of imaging signal intensity and active duration of the traditional Sox9 5’UTR promoter-driven Luc reporter with the new Luc reporter containing the miR-145-5p target cis element at 3’UTR is consistent with these observations and illustrates a dynamic relationship between miR-145-5p and Sox9 expression during the longitudinal measurement of MSC chondrogenic differentiation.
Sox9 and miR-145-5p expressions during MSC chondrogenesis
The Sox9 mRNA has two possible miR-145-5p binding sites shown in Figure S3. Of these two sites, only the second site (at +1385) is functional. This second site has a mirSVR score of − 1.0271. The mirSVR score is based on the empirical distribution of the extent of target downregulation (measured as log-fold change) for miRNA target prediction with a cut-off of −0.1. In addition, the second site has a PhastCons score of 0.5725, which measures the evolutionary conservation of sequence blocks across multiple vertebrates using a phylogenetic hidden Markov model [14], is a default parameter to filter out less-conserved predicted target sites. A cutoff of 0.57 is usually used to select target sites that are conserved in mammals.
However, the results from this study revealed a more intricate relationship between miR-145-5p and Sox9 than expected. Even though miR-145-5p directly targets Sox9 mRNA in the contents of TE cartilage [9], the inverse relationship between the expression of miR-145-5p and Sox9 during MSC chondrogenesis was only marginally demonstrated by qRT-PCR (Figure 5). A complex combination of transcription factors concurrently up-regulate Sox9 while simultaneously down-regulate miR-145-5p during MSC chondrogenesis. It is likely that the existence of these transcriptional regulatory elements renders the direct regulatory effect of miR-145 on Sox9 not as dominant as previously expected. Consistent with this process, miR- 145-5p along with miR-143, miR-212, miR-132 and miR-125b are suppressed by multiple factors including TGF-βs [8,15]. Conversely, TGF-β1 in the chondrogenic medium is known to promote Sox9 expression, driving MSC chondrogenic differentiation [16]. Sox9 expression is controlled by numerous DNA binding factors with seemingly inverse activity on miR-145-5p in the absence of TGF-β or other cytokine stimulation. Likely factors involved in Sox9 activation suppress the expression of miR-145-5p at the same time. Sox9 is not the exclusive target of miR-145-5p. A myriad of other genes are targeted by miR-145-5p and thus, the relationship between miR-145-5p and Sox9 is less direct than originally anticipated. This might explain in part the close correlation between the time courses of BLI profiles (Figure 4) from the two reporters (pSox9-Luc and pmiR-145-5p–Luc) despite a weak inverse relationship between Sox9 and miR-145-5p expression by qRT-PCR (Figure 5). However, it is possible that in the in vitro tissue culture model, the effects of TGF-βs can overwhelm the more subtle endogenous regulatory effects of miR-145-5p on Sox9.
miR-145-5p responsive reporter vs. Sox9 promoter-driven reporter
In pellets transfected with pSox9-Luc reporter, the Sox9 promoter-driven luciferase reporter construct contains no PT miRNA binding sequence, and should not respond to the level of endogenous miR-145-5p. This assumption was confirmed in Figure 6B showing poor correlation between the BLI signals from pSox9-Luc and miR-145-5p expression by qRT-PCR. BLI signal from pSox9-Luc pellets was strongly correlated with Sox9 expression (mRNA level by PCR) from the same pellets up to Day 16 when normalized signal intensity remained reliable. For all transfected pellets, the reporter expression is transient, and standardization (normalization) to Luc control could only correct for the diminishing BLI signals up to certain time points, which limits the correlational analysis. Unexpectedly, while an inverse trend between BLI and miR-145-5p expression was indeed observed, this relationship was insignificant (Figure 6A). Because miRNA target binding can lead to either degradation or sequestration of both the miRNA and the target mRNA, one possible explanation for this poor association is that high levels of reporter transcripts from the pmiR-145-5p–Luc reporter sequestered enough endogenous miR-145-5p copies to limit qRT-PCR detection.
The truncated Sox9 (−193bp) promoter-driven reporter was chosen for tissue independent expression and signal intensity [3]. The high signal intensity from this promoter was still an order of magnitude less than observed from the miR-145-5p–responsive reporter (Figure 4). It is not surprising the strength of a native promoter gene such as Sox9 was not as strong as those of constitutively active viral promoters due to the subtle regulation of endogenous transcription factors. Previously constructed reporter gene systems driven by cartilage-specific marker gene Col2 promoters also yield low signal intensities when used to monitor chondrogenic differentiation of MSCs (Figure S1 in supplementary material).
Since the new reporter was driven by a constitutively active promoter, but is modulated by endogenous miRNA expression, it brings consistency to quantitative analysis of image data since the strength of individual native promoters is no longer a sensitivity issue. Due to the diminishing reporter plasmid expression due to transient transfection, the effective time window was limited to less than three weeks. To track a long-term chondrogenesis in TE cartilage, a more desirable approach would be to use stably integrating lentiviral mediated reporters, which is the subject of ongoing research effortss.
Potential utilities of miR-145-5p responsive reporter
Non-coding RNAs hold great potential for new opportunities in diagnosis and treatment. There have been investigation into the role of specific miRNAs in the process of chondrogenesis. Some work has suggested the identification of specific miRNAs from either synovial fluid or peripheral circulation as novel diagnostic disease biomarkers [17]. Specifically for miR-145-5p, one estimate suggests it targets more than 7,000 mRNA transcripts directly [18] in addition to Sox9 during MSC chondrogenesis. Congruently, miR-145-5p also indirectly suppresses the expression of other genes such as Col2, COMP, MMP13 involved in chondrogenic differentiation through direct suppression of activating transcription factors. A good correlation between the BLI signal profiles (time courses in Figure 4) from the traditional Sox9 reporter-driven reporter and the simpler miR-145-5p responsive reporter was observed during MSC chondrogenesis in this study. If used as an imaging biomarker, the miR-145-5p responsive reporter could provide information regarding the expression and spatial localization of miR-145-5p to reflect the chondrogenesis process of MSCs in a unique way parallel to a sequence of molecular and cellular events regardless of the observed complex relationship with Sox9. Such information certainly complements the measurement of circulating miRNAs.
The real-time feedback of endogenous miRNA expression provided by a miRNA responsive reporter conveys information parallel to marker gene expression dynamics, which is desirable for optimization. For example, timely application of TGF-β3 and BMP-2 in sequence is crucial for successful MSC chondrogenesis [19,20]. In addition, mechanical, electrical, or other material/ structural stimulations can initiate MSC chondrogenesis without the key stimuli such as TGF-βs or other molecules [21–23]. Real-time feedback with the miR-145-5p responsive reporter could help enhance timing of these events/stimuli to potentially facilitate these mechano-dynamic TE cartilage optimizations. The same real-time information on endogenous miRNA expression will improve our understanding of progenitor cell response to stimuli during chondrogenesis and aid in the discovery of new methodology to prevent or delay chondrocyte hypertrophy.
Supplementary Material
Acknowledgments
We thank Don Lennon and Lori Duesler at the Case Center for Multimodal Evaluation of Engineered Cartilage (CCMEEC) for providing cells for this study. The authors acknowledge the assistance of the Cleveland Clinic Lerner Research Institute Imaging Core in providing the IVIS Spectrum CT for imaging services. This work utilized the PerkinElmer IVIS Spectrum CT In Vivo Imager that was purchased with funding from National Institutes of Health (NIH) SIG grant 1S10OD018205-01A1. This work was supported in part by a grant from the NIH/NIBIB, P41 EB021911 (PI: Caplan). The content is solely the responsibility of the authors and does not necessarily represent the official views of the National Institutes of Health.
Footnotes
The authors have no financial relationships that may cause a conflict of interest.
References
- 1.Wu G, Cui Y, Ma L, et al. Repairing cartilage defects with bone marrow mesenchymal stem cells induced by CDMP and TGF-beta1. Cell and tissue banking. 2014;15:51–57. doi: 10.1007/s10561-013-9369-x. [DOI] [PubMed] [Google Scholar]
- 2.Yan C, Wang Y, Shen XY, et al. MicroRNA regulation associated chondrogenesis of mouse MSCs grown on polyhydroxyalkanoates. Biomaterials. 2011;32:6435–6444. doi: 10.1016/j.biomaterials.2011.05.031. [DOI] [PubMed] [Google Scholar]
- 3.Kanai Y, Koopman P. Structural and functional characterization of the mouse Sox9 promoter: implications for campomelic dysplasia. Human molecular genetics. 1999;8:691–696. doi: 10.1093/hmg/8.4.691. [DOI] [PubMed] [Google Scholar]
- 4.Beilharz TH, Humphreys DT, Clancy JL, et al. microRNA-mediated messenger RNA deadenylation contributes to translational repression in mammalian cells. PloS one. 2009;4:e6783. doi: 10.1371/journal.pone.0006783. [DOI] [PMC free article] [PubMed] [Google Scholar]
- 5.Wu L, Fan J. Belasco J G MicroRNAs direct rapid deadenylation of mRNA. Proc Natl Acad Sci. U S A. 2006;103:4034–4039. doi: 10.1073/pnas.0510928103. [DOI] [PMC free article] [PubMed] [Google Scholar]
- 6.Zhao Q, Eberspaecher H, Lefebvre V, et al. Parallel expression of Sox9 and Col2a1 in cells undergoing chondrogenesis. Developmental dynamics : an official publication of the American Association of Anatomists. 1997;209:377–386. doi: 10.1002/(SICI)1097-0177(199708)209:4<377::AID-AJA5>3.0.CO;2-F. [DOI] [PubMed] [Google Scholar]
- 7.Goldring MB, Tsuchimochi K, Ijiri K. The control of chondrogenesis. J Cell Biochem. 2006;97:33–44. doi: 10.1002/jcb.20652. [DOI] [PubMed] [Google Scholar]
- 8.Yang B, Guo H, Zhang Y, et al. MicroRNA-145 regulates chondrogenic differentiation of mesenchymal stem cells by targeting Sox9. PloS one. 2011;6:e21679. doi: 10.1371/journal.pone.0021679. [DOI] [PMC free article] [PubMed] [Google Scholar]
- 9.Martinez-Sanchez A, Dudek KA, Murphy CL. Regulation of human chondrocyte function through direct inhibition of cartilage master regulator SOX9 by microRNA-145 (miRNA-145) The Journal of biological chemistry. 2012;287:916–924. doi: 10.1074/jbc.M111.302430. [DOI] [PMC free article] [PubMed] [Google Scholar]
- 10.Love Z, Wang F, Dennis J, et al. Imaging of mesenchymal stem cell transplant by bioluminescence and PET. J Nucl Med. 2007;48:2011–2020. doi: 10.2967/jnumed.107.043166. [DOI] [PubMed] [Google Scholar]
- 11.Helledie T, Nurcombe V, Cool SM. A simple and reliable electroporation method for human bone marrow mesenchymal stem cells. Stem cells and development. 2008;17:837–848. doi: 10.1089/scd.2007.0209. [DOI] [PubMed] [Google Scholar]
- 12.Zhang Y, Pullambhatla M, Laterra J, et al. Influence of bioluminescence imaging dynamics by D-luciferin uptake and efflux mechanisms. Molecular imaging. 2012;11:499–506. [PMC free article] [PubMed] [Google Scholar]
- 13.Chen FH, Rousche KT, Tuan RS. Technology Insight: adult stem cells in cartilage regeneration and tissue engineering. Nat Clin Pract Rheumatol. 2006;2:373–382. doi: 10.1038/ncprheum0216. [DOI] [PubMed] [Google Scholar]
- 14.Siepel A, Bejerano G, Pedersen JS, et al. Evolutionarily conserved elements in vertebrate, insect, worm, and yeast genomes. Genome research. 2005;15:1034–1050. doi: 10.1101/gr.3715005. [DOI] [PMC free article] [PubMed] [Google Scholar]
- 15.Han J, Yang T, Gao J, et al. Specific microRNA expression during chondrogenesis of human mesenchymal stem cells. International journal of molecular medicine. 2010;25:377–384. doi: 10.3892/ijmm_00000355. [DOI] [PubMed] [Google Scholar]
- 16.Pittenger MF, Mackay AM, Beck SC, et al. Multilineage potential of adult human mesenchymal stem cells. Science. 1999;284:143–147. doi: 10.1126/science.284.5411.143. [DOI] [PubMed] [Google Scholar]
- 17.Murata K, Yoshitomi H, Tanida S, et al. Plasma and synovial fluid microRNAs as potential biomarkers of rheumatoid arthritis and osteoarthritis. Arthritis Res Ther. 2010;12:R86. doi: 10.1186/ar3013. [DOI] [PMC free article] [PubMed] [Google Scholar]
- 18.Betel D, Wilson M, Gabow A, et al. The microRNA.org resource: targets and expression. Nucleic acids research. 2008;36:D149–153. doi: 10.1093/nar/gkm995. [DOI] [PMC free article] [PubMed] [Google Scholar]
- 19.Lin EA, Kong L, Bai XH, et al. miR-199a, a bone morphogenic protein 2-responsive MicroRNA, regulates chondrogenesis via direct targeting to Smad1. The Journal of biological chemistry. 2009;284:11326–11335. doi: 10.1074/jbc.M807709200. [DOI] [PMC free article] [PubMed] [Google Scholar]
- 20.Le LT, Swingler TE, Clark IM. Review: the role of microRNAs in osteoarthritis and chondrogenesis. Arthritis and rheumatism. 2013;65:1963–1974. doi: 10.1002/art.37990. [DOI] [PubMed] [Google Scholar]
- 21.Campbell JJ, Lee DA, Bader DL. Dynamic compressive strain influences chondrogenic gene expression in human mesenchymal stem cells. Biorheology. 2006;43:455–470. [PubMed] [Google Scholar]
- 22.Glennon-Alty L, Williams R, Dixon S, et al. Induction of mesenchymal stem cell chondrogenesis by polyacrylate substrates. Acta Biomaterialia. 2013;9:6041–6051. doi: 10.1016/j.actbio.2012.12.007. [DOI] [PMC free article] [PubMed] [Google Scholar]
- 23.Kwon HJ, Lee GS, Chun H. Electrical stimulation drives chondrogenesis of mesenchymal stem cells in the absence of exogenous growth factors. Scientific Reports. 2016;6:39302. doi: 10.1038/srep39302. [DOI] [PMC free article] [PubMed] [Google Scholar]
Associated Data
This section collects any data citations, data availability statements, or supplementary materials included in this article.


