Abstract
Hypertrophic cardiomyopathy (HCM) stems from mutations in sarcomeric proteins that elicit distinct biophysical sequelae, which in turn may yield radically different intracellular signaling and molecular pathologic profiles. These signaling events remain largely unaddressed by clinical trials that have selected patients based on clinical HCM diagnosis, irrespective of genotype. In this study, we determined how two mouse models of HCM differ, with respect to cellular/mitochondrial function and molecular biosignatures, at an early stage of disease. We show that hearts from young R92W-TnT and R403Q-αMyHC mutation–bearing mice differ in their transcriptome, miRNome, intracellular redox environment, mitochondrial antioxidant defense mechanisms, and susceptibility to mitochondrial permeability transition pore opening. Pathway analysis of mRNA-sequencing data and microRNA profiles indicate that R92W-TnT mutants exhibit a biosignature consistent with activation of profibrotic TGF-β signaling. Our results suggest that the oxidative environment and mitochondrial impairment in young R92W-TnT mice promote activation of TGF-β signaling that foreshadows a pernicious phenotype in young individuals. Of the two mutations, R92W-TnT is more likely to benefit from anti–TGF-β signaling effects conferred by angiotensin receptor blockers and may be responsive to mitochondrial antioxidant strategies in the early stage of disease. Molecular and functional profiling may therefore serve as aids to guide precision therapy for HCM.
Keywords: Cardiology, Cell Biology
Keywords: Cardiovascular disease, Mitochondria, Transcription
Mice expressing the R92W mutation in the Troponin T gene show activation of pro-fibrotic TGF-β signaling before the onset of hypertrophic cardiomyopathy.
Introduction
Hypertrophic cardiomyopathy (HCM) frequently results from mutations in sarcomeric proteins that lead to myocyte hypertrophy, myocyte disarray, fibrosis, and/or arteriolar remodeling (1, 2). HCM predisposes to the development of angina, heart failure, and arrhythmias, and is the most common cause of sudden cardiac death in young individuals (1, 3–6). Biophysical studies have revealed diverse mutation-induced alterations in sarcomeric protein function, which lead to abnormalities in Ca2+ handling (7–12), energy metabolism (13–18) and/or oxidative stress (19–21). This has prompted the testing of L-type Ca2+ channel blockers (e.g., diltiazem) (22, 23), angiotensin II receptor antagonists (e.g., losartan) (24), antioxidants (e.g., N-acetylcysteine) (21, 25, 26), and metabolic modulators (perhexiline) (27) with success in preventing hypertrophy, fibrosis, and adverse cardiac remodeling in animal models. However, neither diltiazem (28), nor losartan (29, 30), nor perhexiline (31) is able to prevent development of the cardiac phenotype in HCM patients. One possible reason for the difference in outcomes between mouse and human studies could be inclusion of patients with a variety of causal HCM mutations in clinical trials.
Two genetic mouse models of HCM that have been well characterized (8, 9, 13, 18, 32–34), namely the R403Q mutation in the α–myosin heavy chain gene (αMyHC; MYH6 gene) (33) and the R92W mutation in the cardiac troponin T gene (TnT; TNNT2 gene) (34), serve as the platform for our comparative studies. Both mutations increase tension cost and lead to energetic stress under high workloads (13, 18). Each model is an example of classic biophysical defects associated with mutations in HCM patients. The R403Q-MyHC mutation in the mouse α-myosin motor domain, which some reports indicate is a molecular gain-of-function mutation with supra-normal ATPase activity, leads to left ventricular (LV) hypertrophy, heart failure, and/or arrhythmias (13, 16, 35, 36). However, another report studying the human cardiac β-myosin motor shows a loss of function in some parameters (37). In contrast, the R92W-TnT mutation confers increased Ca2+ sensitivity to muscle fiber contraction and predisposes to cardiac fibrosis and ventricular arrhythmias/sudden cardiac death at a young age, in the absence of significant hypertrophy (38, 39).
Thus, each HCM mutation elicits distinct biophysical sequelae, which, in turn, may yield radically different intracellular signaling and molecular pathologic profiles. Precision medicine approaches that exploit knowledge of underlying pathophysiology and dysregulation of specific signaling pathways may be needed to prevent or treat the cardiac HCM phenotype. Recently, variation in β-myosin (a common cause of HCM) was analyzed in large cohorts of healthy and HCM patients with a view toward considering precision medicine (40). The ultimate goal of these efforts is to improve long-term prognosis by targeted early interventions in susceptible individuals.
In this study, we show that prior to development of the disease, each genotype perturbs cellular redox and mitochondrial function differently, underpinned by a distinct mRNA/microRNA (miRNA) biosignature. We discuss the implications for precision therapy approaches to HCM.
Results
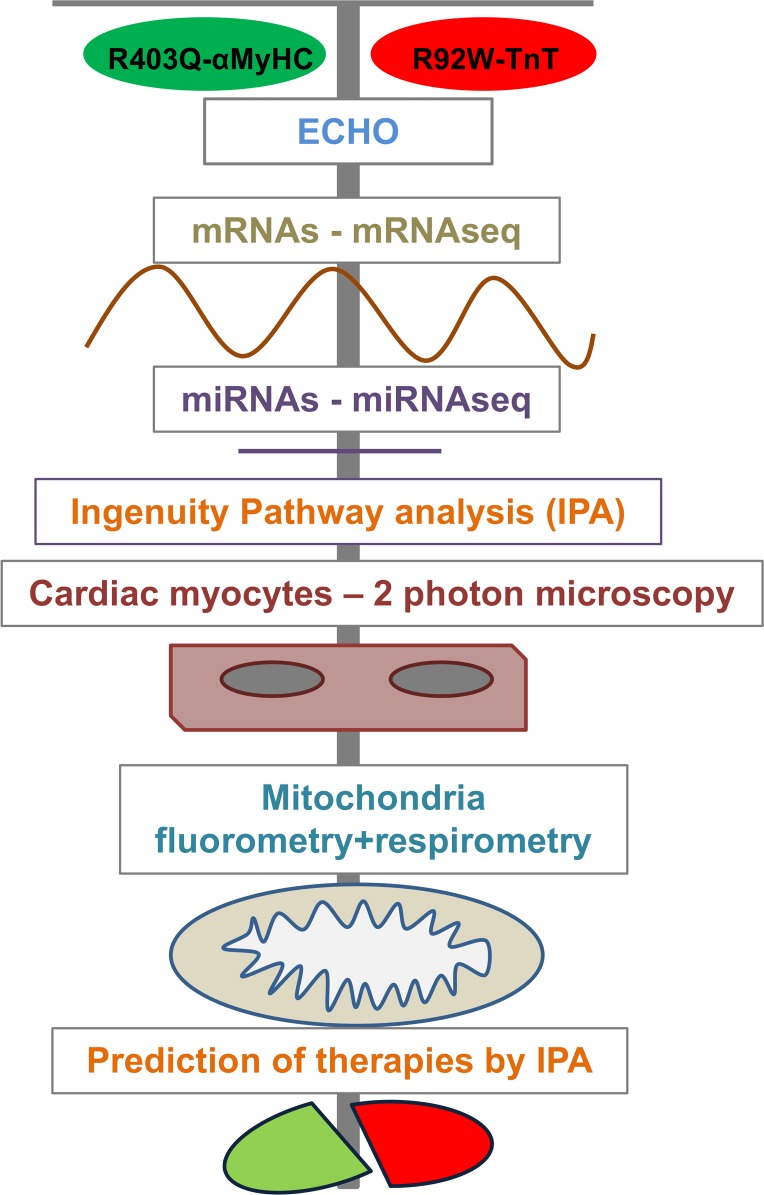
To characterize the differences/similarities in HCM caused by mutations in two different sarcomeric proteins, as well as identify underlying mechanisms, we combined global and targeted approaches in young HCM mice (Figure 1). These mice span the spectrum of human HCM, namely heart failure (1, 3, 41) and arrhythmias (38, 39, 41). Echocardiography and global mRNA and miRNA profiling were performed to obtain an overview of global trends and gene regulatory pathways, and to predict optimal preventive therapies. Studies of mitochondrial function and redox in isolated mitochondria and cardiac myocytes (42–46) were performed to determine the presence of mitochondrial dysfunction (14, 32, 47) and oxidative stress (19, 20), which are implicated in disease pathogenesis.
Figure 1. Overall design of the study.
Phenotypic analysis of HCM mice.
We observed no increase in mortality in mutant mice when compared with littermate controls at 3–5 weeks of age. Previous studies have reported no evidence of hypertrophy or fibrosis in mice carrying the R403Q-MyHC or R92W-TnT mutation before 8 weeks of age (33, 34, 48, 49). Since clinical HCM is often associated with LV hypertrophy, hyperdynamic LV function, and diastolic dysfunction, we performed echocardiography in mutant mice (MyHC and TnT) and littermate controls (control-M and control-T) at 5 weeks of age. None of the mice had evidence of LV hypertrophy by echocardiography, consistent with earlier reports (33, 34). MyHC mutant mice had similar systolic and diastolic function, whereas TnT mutant mice had higher LV ejection fraction and diastolic dysfunction (reflected by lower ratio of mitral early [E] to late [A] filling velocities), when compared with littermate controls (Table 1).
Table 1. Echocardiography results in anesthetized mice.
Allele-specific differences in mRNA expression.
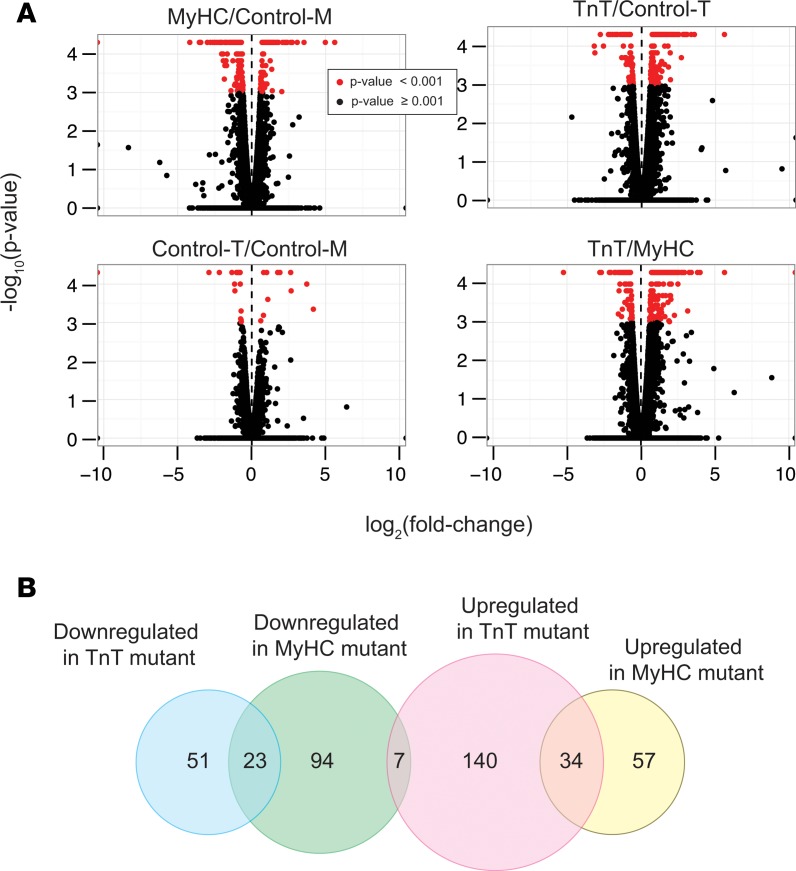
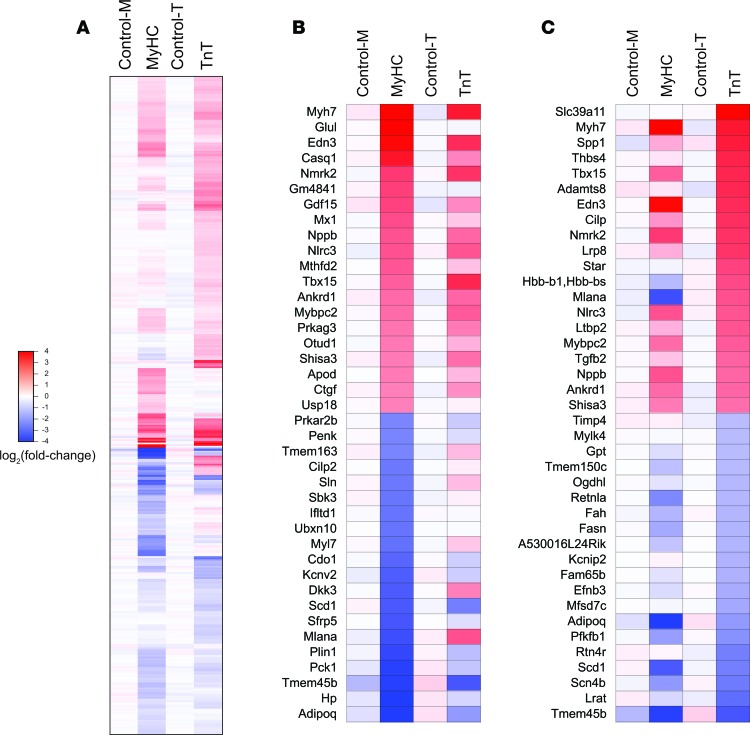
High-throughput sequencing of mRNAs (mRNA-seq) from mouse hearts was performed to examine mutation-specific effects of the R403Q-αMyHC and R92W-TnT mutations on global gene expression in the early stages of HCM (33, 34) (Figure 2 and Supplemental Tables 1 and 2; supplemental material available online with this article; https://doi.org/10.1172/jci.insight.94493DS1). Among the 23,963 annotated nuclear-encoded genes, only 29 mRNAs exhibited differential expression between the 2 controls (control-M and control-T) (P < 0.001, q < 0.05, reflecting an FDR of 5%; fold change > 1.48 or < 0.68) (Figure 2A). In contrast, 223 mRNAs were significantly differentially expressed in MyHC mutants, and 265 mRNAs were significantly differentially expressed in TnT mutants compared with their littermate controls (control-M and control-T respectively) (Figure 2A). Among these differentially expressed mRNAs, only 61 overlapped and exhibited the same directional change between the 2 mutants, indicating that many of the differentially expressed genes were unique to each mutant. In fact, 281 mRNAs were significantly differentially expressed between the MyHC and TnT mutants (Figure 2A, bottom right panel). Heatmap plots of fold changes of the 406 genes that were differentially expressed in either MyHC or TnT mutants compared with their respective littermate controls (except for 14 genes that also exhibited change between the 2 controls) revealed expression patterns unique to each mutant, as well as similarities (Figure 3).
Figure 2. mRNA-seq analysis.
(A) Volcano plots showing the log2(fold change) and –log10(P value) of each mRNA in the pairwise comparison of the 2 mouse genotypes; mRNA data with P < 0.001 (q < 0.05) using 2-sided unpaired Student’s t test (n = 3 biological replicates) is depicted in red. (B) Venn diagram illustrating number of genes that are upregulated or downregulated in MyHC and TnT mutants (total number of genes, 406).
Figure 3. mRNA-seq analysis.
(A) Heatmap illustrating fold-change in abundance of each mRNA relative to the mean of the littermate controls (the mean of control-M and control-T); 406 genes were differentially expressed (P < 0.001, q < 0.05, using 2-sided unpaired Student’s t test [n = 3 biological replicates]) in MyHC or TnT mutants, when compared with their respective littermate controls; differences in expression of 14 genes were observed in the 2 controls. The mRNAs are shown in descending order of fold change in abundance in the TnT mutants. (B and C) Heatmap showing fold change in the abundance of each mRNA relative to the mean of control-M and control-T. The top 20 upregulated and downregulated genes in MyHC (B) and TnT (C) mutants are shown. The mRNAs are shown in descending order of fold change in abundance in MyHC (B) and TnT (C) mutants.
Next, we categorized the 406 differentially expressed genes based on whether they were upregulated or downregulated in each mutant. We observed downregulation of 124 and 74 genes in MyHC and TnT mutants, respectively, with overlap in 23 genes (Figure 2B). We found that 91 and 181 mRNAs were upregulated in MyHC mutants and TnT mutants, respectively, with overlap in 34 genes. Seven mRNAs were downregulated in MyHC mutants but upregulated in TnT mutants. Both mutants exhibited upregulation of previously reported fetal and stress response genes (50), such as the fetal myosin heavy chain isoform Myh7, fast skeletal isoform of myosin binding protein C (Mybpc2), endothelin 3 (Edn3), natriuretic peptide precursor B (Nppb), T-box transcription factor 15 (Tbx15), ankyrin repeat domain–containing protein–1 (Ankrd1), and nicotinamide riboside kinase 2 (Nmrk2), when compared with littermate controls (Figure 3, B and C).
KEGG/GO term enrichment analysis.
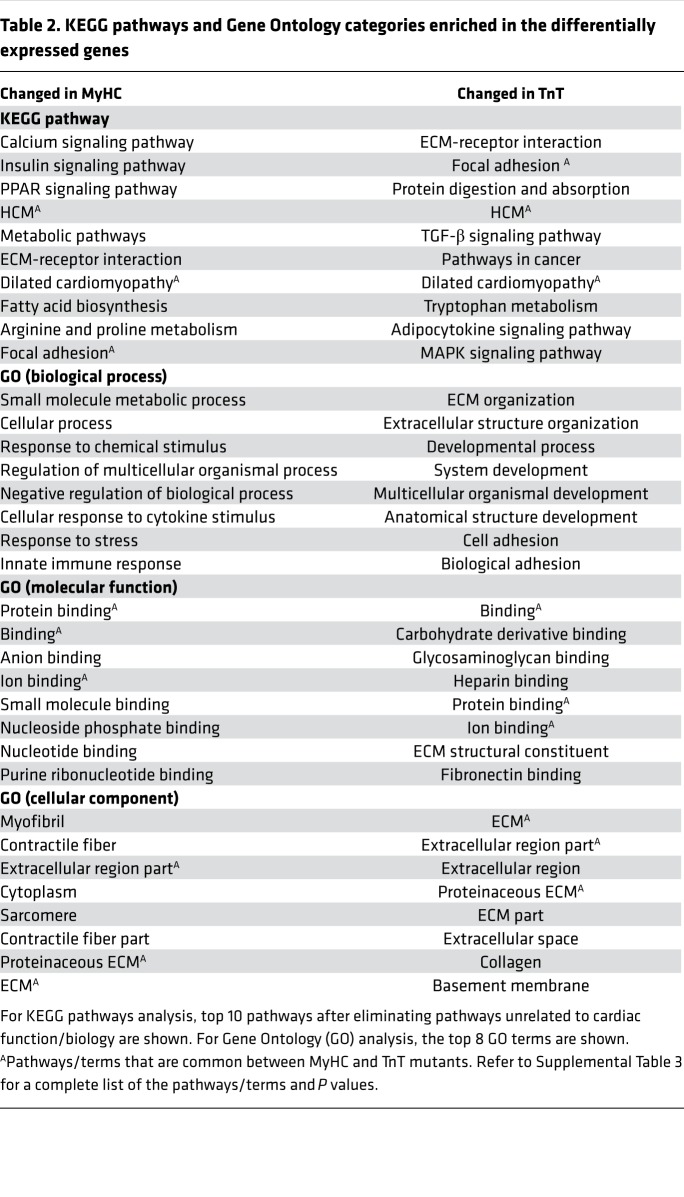
Using the identified differentially expressed genes, we performed KEGG pathway and Gene Ontology (GO) term enrichment analysis to assess similarities and differences in molecular processes affected by the 2 mutations (Table 2 and Supplemental Table 3). KEGG pathway “hypertrophic cardiomyopathy (HCM),” “dilated cardiomyopathy,” and “focal adhesion” were highly enriched in both mutants. MyHC mutants exhibited enrichment of processes involved in “calcium signaling,” “metabolism,” and “immune response,” whereas TnT mutants exhibited enrichment of processes involved in “extracellular matrix structure”/“organization and cell adhesion.” To assess the possibility of metabolic remodeling at an early stage of HCM, we scanned the 406 differentially expressed mRNAs in TnT and MyHC mutants using GO terms related to metabolic processes and found 75 genes that were differentially expressed in mutants (Supplemental Table 4). Prkag3 (regulatory subunit of AMPK) expression was significantly increased in both mutants, and several genes involved in fatty acid metabolism (Adipoq, Ces1d, Fasn, Lrat, Prkar2b, Scd1) and amino acid (Fah) and glucose metabolism (Fbp2, Pck1, Pfkfb1) showed lower expression in both mutants.
Table 2. KEGG pathways and Gene Ontology categories enriched in the differentially expressed genes.
Ingenuity pathway analysis.
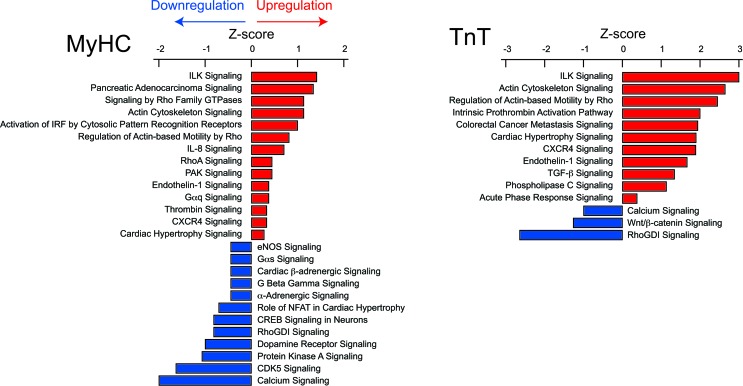
Pathway analysis was performed using ingenuity pathway analysis (IPA). Integrin-linked kinase (ILK), actin cytoskeletal, endothelin-1, CXCR4, and cardiac hypertrophy signaling were upregulated in both mutants (Figure 4 and Supplemental Table 5), whereas calcium and RhoGDI signaling were downregulated in both mutants. Only TnT mutants demonstrated a biosignature consistent with upregulation of TGF-β signaling. Greater upregulation of cardiac hypertrophy signaling and endothelin-1 signaling (reflected by higher Z scores) was predicted in TnT mutants, whereas greater downregulation of calcium signaling (reflected by a lower Z score) was predicted in MyHC mutants.
Figure 4. Ingenuity pathway analysis of mRNA-seq data.
IPA identified pathways that were significantly (P < 0.032) upregulated (Z score > 0) or downregulated (Z score < 0) in MyHC and TnT mutants. All pathways (P < 0.032), including those whose Z scores could not be determined, are shown in Supplemental Table 4.
Taken together, these analyses reveal distinct effects of each mutation on gene expression and signaling pathways at the early stage of HCM in mice.
Allele-specific differences in miRNA expression.
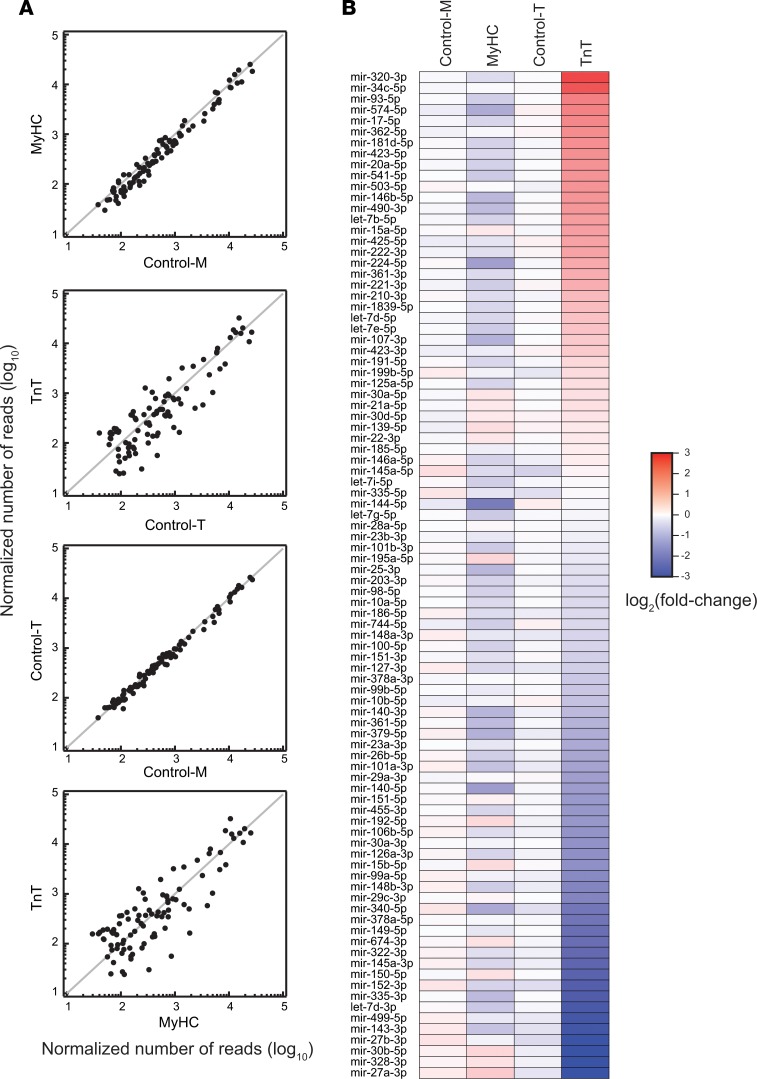
miRNAs are known regulators of many genes and physiologic processes including cardiac hypertrophy and fibrosis (51, 52). Studies of miRNA profiling in HCM patients and transgenic mouse models have identified patterns that are unique to each HCM mutation (53–56), but it is unknown when in the disease process these differences are present. High-throughput sequencing of miRNAs (miRNA-seq) in the young mutant mice and littermate controls (Figure 5 and Supplemental Tables 6 and 7) revealed no difference (none showed >2-fold difference) in miRNA expression between the 2 controls (control-M and control-T), as expected (Figure 5A). Only 5 miRNAs were downregulated more than 2-fold in MyHC mutants and none were upregulated more than 2-fold, when compared with their littermate controls (control-M) (Figure 5A). In contrast, TnT mutants demonstrated significant differences in expression in 48% (44 of 92) of miRNAs: 16 miRNAs were upregulated more than 2-fold and 28 were downregulated more than 2-fold when compared with their littermate controls (control-T) (Figure 5 and Supplemental Figure 2). Several of these differentially expressed miRNAs have been previously implicated in cardiac hypertrophy, cardiac fibrosis, apoptosis, mitochondrial function, and autophagy (Figure 6) (51, 57–59). Thus, our miRNA-seq analysis revealed global changes in miRNA expression in TnT mutants, but only limited changes in MyHC mutants.
Figure 5. miRNA-seq analysis.
(A) Scatter plots illustrate pairwise comparison of the abundance of normalized miRNAs between 2 mouse genotypes. Each dot represents the mean of the normalized number of reads of a unique miRNA (n = 2 biological replicates for TnT, and n = 3 biological replicates for all other mice). Ninety-two miRNAs whose mean abundance was more than 100 reads per million total reads in at least 1 of the 4 mice analyzed are shown. (B) Heatmap depicting fold change of abundance of each miRNA relative to the mean of the littermate controls (the mean of control-M and control-T). The miRNAs are listed so that they are in descending order of fold change in abundance in TnT mutants.
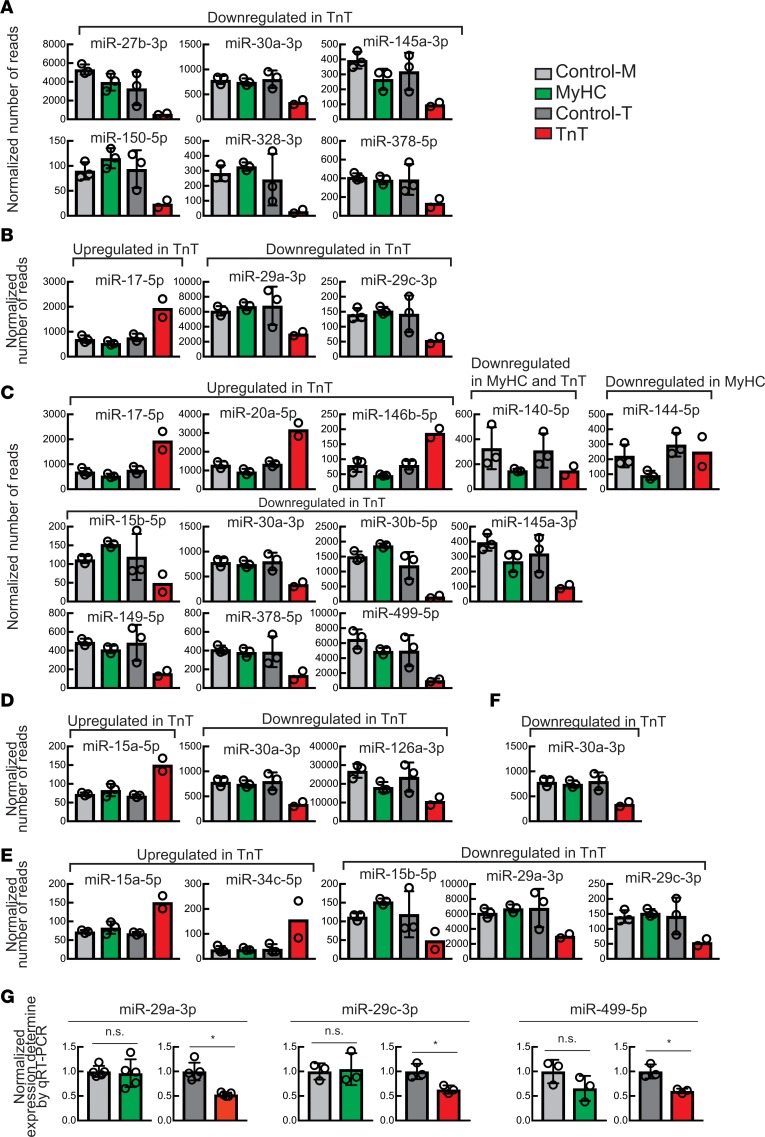
Figure 6. Differentially expressed miRNAs implicated in cardiac disease and mitochondrial function.
(A–F) Abundance (reads per million) of miRNAs that show >2-fold change in MyHC or TnT mutants compared with their littermate controls and have been implicated in (A) cardiac hypertrophy, (B) cardiac fibrosis, (C) cardiac apoptosis, (D) mitochondrial function, (E) myocardial infarction, and (F) autophagy. Mean ± SD (n = 2 biological replicates for TnT, and n = 3 biological replicates for all other mice). (G) Normalized expression of miR-29a-3p, miR-29c-3p, and miR-499-5p determined by qRT-PCR. The miRNA levels were normalized by miR-30a-5p level, which did not show change in the miRNA-seq data (Supplemental Table 7). Expression in MyHC and TnT mutants was normalized to that of their respective littermate controls. Mean ± SD (n = 5 biological replicates for miR-29a-3p, and n = 3 biological replicates for miR-29c-3p and miR-499-5p); *P < 0.05 using 2-sided Student’s t test.
To validate our miRNA-seq results using an independent approach, we selected 3 miRNAs (miR-29a-3p, miR-29c-3p, and miR-499-5p) that were differentially expressed in the miRNA-seq data and performed quantitative real-time PCR (qRT-PCR) assays. Their levels were significantly reduced in TnT mutants but were unchanged in MyHC mutants compared with their respective controls (Figure 6G), consistent with the miRNA-seq results.
Dysregulation of the TGF-β–miR-29–collagen/elastin axis in TnT mutants.
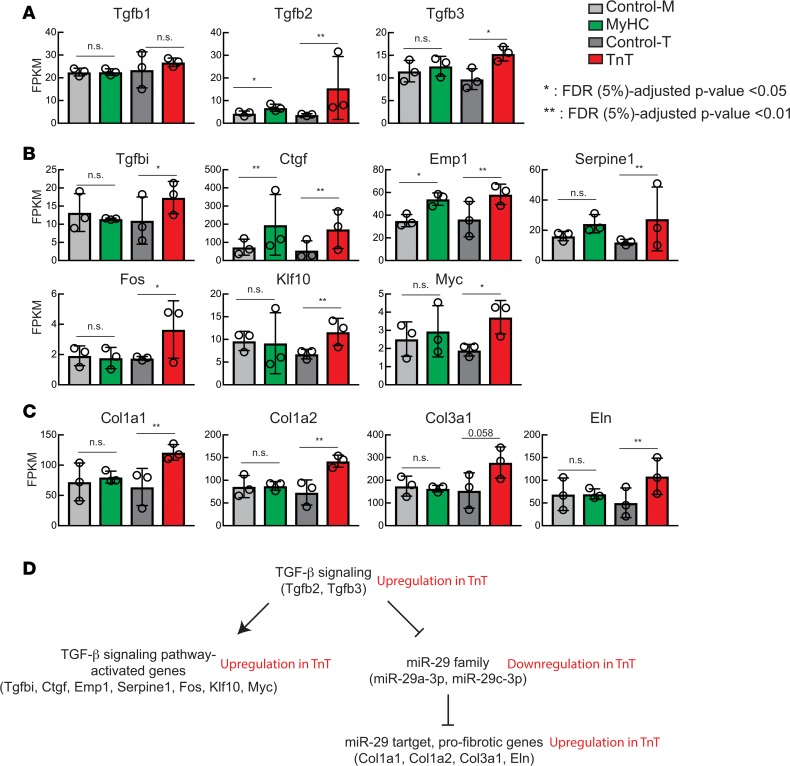
The prediction of upregulated TGF-β signaling in TnT mutants by IPA prompted us to examine expression of TGF-β genes and their targets (Figure 4). We found significantly higher expression of TGF-β3 (Tgfb3) mRNA compared with littermate controls only in TnT mutants (Figure 7A). TGF-β2 mRNA expression was significantly higher in both TnT and MyHC mutants than in littermate controls, with TnT mutants showing markedly higher expression. TGF-β1 mRNA was unchanged in both mutants compared with littermate controls. Consistent with higher expression of TGF-β2 and -β3 mRNAs, we found higher expression of targets of the TGF-β signaling pathway in TnT mutants compared with littermate controls: mRNA levels of TGF-β–induced (Tgfbi), connective tissue growth factor (Ctgf), epithelial membrane protein 1 (Emp1), Serpine1, Fos, Krüppel-like factor 10 (Klf10), and Myc mRNAs were significantly higher in TnT mutants compared with littermate controls (Figure 7B); mRNA levels of Ctgf, Emp1, and Serpine1 were also significantly higher in MyHC mutants than littermate controls.
Figure 7. TGF-β–miR-29–collagen axis.
(A) mRNA levels (fragments per kilobase of exon per million fragments mapped [FPKM]) of TGF-β genes revealed by mRNA-seq. (B) mRNA levels of genes whose transcription is known to be increased by activation of TGF-β signaling. (C) mRNA levels of collagen and elastin genes that are known to be suppressed by the miR-29 family of miRNAs. (D) Summary of TGF-β–miR-29–collagen axis and changes in TnT mutants. Mean ± SD (n = 3 biological replicates); *P < 0.01 and **P < 0.001, using 2-sided Student’s t test.
To identify possible mediators of cardiac fibrosis, we focused on the miR-29 family (60), whose transcription is inhibited by activation of TGF-β signaling (61). The miR-29 family is antifibrotic: it suppresses expression of the profibrotic genes elastin (Eln), collagen type I alpha 1 (Col1a1), collagen type I alpha 2 (Col1a2), and collagen type 3 alpha 1 (Col3a1) (60). We observed lower levels of miR-29a-3p and miR-29c-3p in TnT mutants, but not MyHC mutants, when compared with littermate controls (Figure 6, B, E, and G). Consistent with the lower levels of miR-29a-3p and miR-29c-3p, mRNA levels of these 4 target genes were higher in TnT mutants, but not MyHC mutants, when compared with their littermate controls (Figure 7C). Collectively, these results suggest that upregulation of TGF-β signaling results in downregulation of the miR-29 family, with consequent de-repression of the profibrotic genes Eln, Col1a1, Col1a2, and Col3a1 in TnT mutants, but not MyHC mutants in the early stage of disease (Figure 7D). These results could explain the early propensity for cardiac fibrosis in TnT mutation carriers, thus providing a substrate for reentrant arrhythmias (62, 63). Lack of differences in miR-29 and profibrotic gene expression in MyHC mutants is likely an age-specific phenomenon, since TGF-β has been implicated in generation of fibrosis in older mice carrying the R403Q mutation (64).
Allele-specific differences in cellular redox.
Previous reports have implicated ROS in activation of TGF-β signaling (65) and have suggested a role for mitochondrial dysfunction/oxidative stress in the pathogenesis of the cardiac HCM phenotype (25). Since TGF-β signaling was predicted to be upregulated in TnT mutants at the early stage of HCM in our pathway analysis (Figure 4 and Supplemental Table 5), we investigated redox status and mitochondrial ROS in both mutant mice and littermate controls. We studied isolated cardiac myocytes and isolated cardiac mitochondria. Cardiac myocytes provided information about the cellular redox environment, whereas mitochondrial respiration, redox, ROS generation, and scavenging reflected mitochondrial function (42).
An optimal balance between ROS generation and scavenging is needed to maintain contractile function and cardiac myocyte electrophysiology (44, 66, 67). First, we examined differences in expression of genes involved in ROS generation or scavenging in our mRNA-seq data. We found that expression of most genes involved in ROS generation/scavenging did not show significant difference in either of the mutants compared with littermate controls. Differences in gene expression (P < 0.001 compared with littermate controls) were observed only for extracellular superoxide dismutase (Sod 3) (68) and thioredoxin-interacting protein (Txnip) (69) mRNAs in TnT mutants, and uncoupling protein mRNAs (Ucp1, Ucp3) (70) in MyHC mutants (Supplemental Figure 2 and Supplemental Table 2).
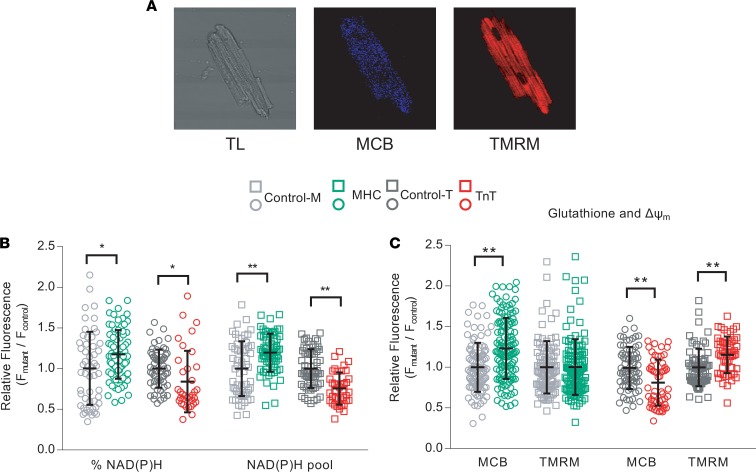
We used 2-photon microscopy to assess NAD(P)H, reduced glutathione (GSH), and mitochondrial membrane potential in isolated cardiac myocytes from TnT and MyHC mutant mice and littermate controls at early stage of disease (Figure 8). Myocytes were labeled with tetramethylrhodamine methyl ester (TMRM) for assessment of mitochondrial membrane potential, and monochlorobimane (MCB) to measure GSH levels (Figure 8A), while cellular autofluorescence was used as an indicator of cellular NAD(P)H (44). When compared with littermate controls, MyHC mutant myocytes exhibited a reduced redox environment characterized by higher levels of NAD(P)H (Figure 8B) and GSH (Figure 8C), but similar mitochondrial membrane potential (Figure 8C). In contrast, TnT mutant myocytes exhibited an oxidized redox environment, characterized by lower NAD(P)H (Figure 8B) and GSH (Figure 8C) when compared with littermate controls; TnT mutant mitochondria were hyperpolarized when compared with littermate controls (Figure 8C). MyHC mutant myocytes had higher NAD(P)H pool levels, in contrast to TnT mutant myocytes which displayed lower NAD(P)H pool levels (Figure 8B, when compared with respective littermate controls.
Figure 8. Isolated myocyte studies.
Two-photon microscopy. Cardiac myocytes were labeled with monochlorobimane (MCB; 50 μM, blue λem 480 ± 20 nm) and tetramethylrhodamine (TMRM; 100nM, red λem 605 ± 25 nm) at 37°C, to simultaneously monitor reduced glutathione (GSH) and mitochondrial membrane potential (ΔΨm), respectively. Data from mutants is presented as fluorescence units normalized to littermate control data. NAD(P)H was assessed in nonlabeled cells by measuring autofluorescence (total fluorescence collected at <490 nm). Potassium cyanide (KCN; 1 mM) and carbonyl cyanide-4-(trifluoromethoxy)phenylhydrazone (FCCP, 5 μΜ) were used to calibrate the NAD(P)H signal, permitting estimation of the NAD(P)H pool. %NAD(P)H calculation was based on NAD(P)H fluorescence units, normalized to the respective NAD(P)H pool. (A) Cell labeling: Representative images of cardiac myocytes with transmitted light (TL) and fluorescence (2-photon) microscopy, labeled with MCB and TMRM. (B) NAD(P)H: Reduced NAD(P)H and NAD(P)H pool were higher in MyHC mutant myocytes, and lower in TnT mutant myocytes, when compared with respective littermate controls. (C) GSH: MyHC mutant myocytes had higher levels of reduced glutathione and similar ΔΨm, whereas TnT mutant myocytes had lower levels of reduced glutathione and more hyperpolarized ΔΨm, when compared to respective littermate controls. Data are presented as mean ± SD. We present results from 3 mouse hearts in each mutant and control group, with n = 20–30 cells from each mouse for NAD(P)H and GSH/ΔΨm measurements, after pooling the 3 datasets (each data point was derived from a single cardiac myocyte). Statistical significance of the difference between each mutant and the respective littermate control was examined using 2-sided unpaired Student’s t test. *P < 0.05; ** P < 0.001.
Allele-specific differences in mitochondrial number and function.
Mitochondria are important regulators of cellular redox. Clinical reports of energetic stress in HCM hearts (14, 15) prompted us to measure mitochondrial respiration, mitochondrial copy number, ROS emission/scavenging, and calcium handling in these 2 HCM mouse models.
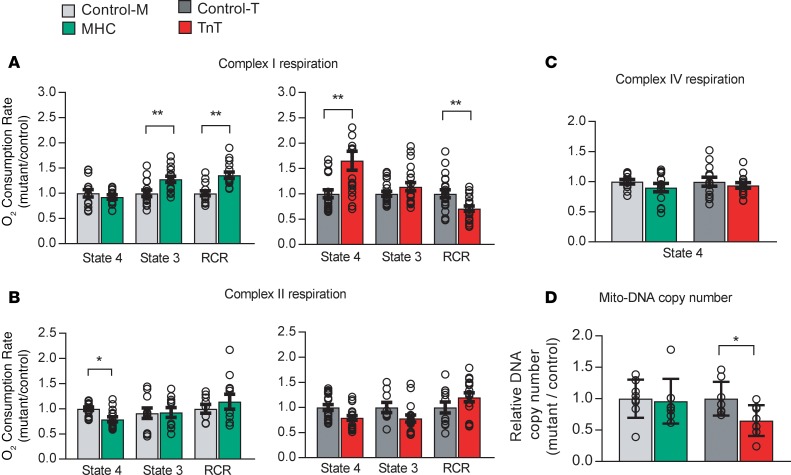
We assessed function of complexes I, II, and IV of the electron transport chain by respirometry. Oxygen consumption rate (OCR) was measured in isolated mitochondria using substrates of complexes I, II, and IV, namely glutamate/malate, succinate, and ascorbate/tetramethyl-p-phenylenediamine (TMPD), respectively, in the presence of ADP (state 3) and in its absence (state 4). Coupling of oxidative phosphorylation (OxPhos) was assessed by computing the respiratory control ratio (RCR) (44). MyHC mutant mitochondria exhibited higher state 3 respiration via complex I and higher RCR when compared with littermate controls (Figure 9A). In contrast, TnT mutant mitochondria displayed higher state 4 respiration, resulting in lower RCR, when compared with littermate controls (Figure 9A). Oligomycin did not affect state 4 respiration in TnT mutants, indicating that complex V was not the source of proton leak, reflected by higher state 4 respiration (data not shown). Both MyHC and TnT mutant mitochondria exhibited lower state 4 respiration via complex II, but complex II RCR was similar in mutants and controls (Figure 9B). Complex IV respiration was not different in mitochondria from mutants and littermate controls (Figure 9C). Together, these results suggest reduced OxPhos coupling at complex I in TnT mutants, when compared with littermate controls.
Figure 9. Mitochondrial studies.
Respirometry: Mitochondria were freshly isolated from mutant and littermate control hearts, in parallel. An XF96 analyzer was used to measure function of complexes I, II, and IV at 37°C. Oxygen consumption rate (OCR) was measured in state 4 (no ADP) and/or state 3 (with 1 mM ADP) using substrates for the electron transport chain (ETC) complex I (5 mM glutamate/malate), complex II (5 mM succinate, in the presence of rotenone, an ETC-complex I inhibitor), and complex IV (0.5 mM TMPD [N,N,N′,N′-tetramethyl-p-phenylenediamine]). Coupling of O2 consumption to ADP phosphorylation was estimated by computing the respiratory control ratio (RCR; state 3/state 4 respiration). (A) Complex I respiration: MyHC mutants had higher state 3 respiration and higher RCR, whereas TnT mutants had higher state 4 respiration and lower RCR, when compared with respective littermate controls. (B) Complex II respiration: MyHC mutants had lower state 4 respiration, but complex II RCR of MyHC mutants was similar to that of controls. No difference was noted between TnT mutants/controls. (C) Complex IV respiration in both mutants was similar to respective littermate controls. Data are presented as mean ± SEM. n = 15 experiments from 5 mitochondrial preparations/10 mice in each group for control-M/MyHC, and n = 21 experiments from 7 mitochondrial preparations/14 mice in each group for control-T/TnT. *P < 0.05, **P < 0.001, using 2-sided unpaired Student’s t test and Bonferroni’s correction for multiple testing. (D) Mitochondrial number: Total DNA was isolated from whole hearts for qRT-PCR of COX-1 (mitochondrial gene) and GAPDH (nuclear gene). Mitochondrial DNA (Mito-DNA) copy number is presented as relative copy number of COX-I/GAPDH. Copy numbers in each mutant were normalized to copy numbers in respective littermate controls. MyHC hearts had similar mitochondrial DNA copy number, whereas TnT mutants had lower mitochondrial DNA copy number, when compared with respective littermate controls. Data are presented as mean ± SD. n = 8 hearts in each group. *P < 0.05, **P < 0.01, using 2-sided unpaired Student’s t test.
To investigate the role of mitochondrial number in cellular energetics and redox, we quantified mitochondrial DNA copy number in mouse hearts, using qPCR. TnT mutants exhibited lower mitochondrial DNA copy number (P = 0.01), whereas no difference was observed in MyHC mutants, when compared with respective littermate controls (Figure 9D).
High metabolic demand of the heart results in continual ROS generation from respiration (71). Hence, ROS scavenging is important for maintain intracellular and mitochondrial redox status and normal cellular function. We used fluorometry to assess NAD(P)H redox status, hydrogen peroxide (H2O2) generation, and ROS scavenging by mitochondria isolated from mutant hearts and littermate controls. Assays were performed in the presence of the NADH-linked substrates glutamate and malate and the FADH2-linked substrate succinate, in both the absence (state 4) and presence of ADP-stimulated respiration (state 3).
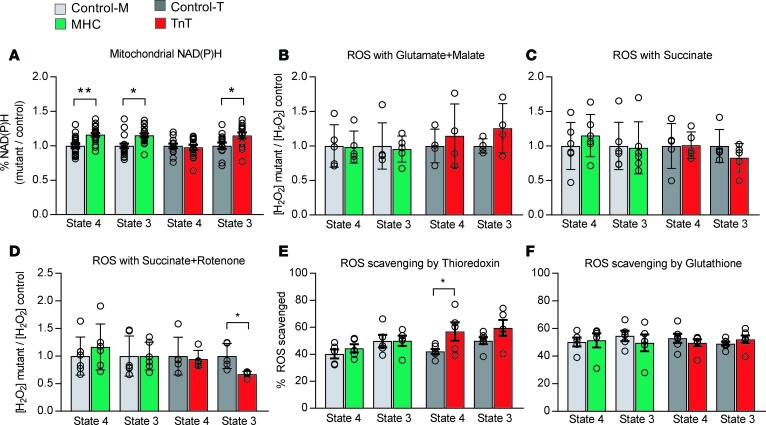
The NAD(P)H signal (autofluorescence) was monitored in isolated mitochondria during state 3 and state 4 respiration, in the presence of the complex I substrates glutamate and malate; the NAD(P)H signal was calibrated by the addition of KCN for maximal reduction, and the uncoupler DNP (2,4 dinitrophenol) for maximal oxidation (Supplemental Figure 3A). MyHC mutant mitochondria maintained higher levels of NAD(P)H during state 4 and 3 respiration, when compared with littermate controls (Figure 10A). TnT mutant mitochondria could maintain NAD(P)H to a similar level as controls during state 4 respiration. However, higher levels of NAD(P)H were observed during state 3 respiration, because of lower oxidation of NAD(P)H during the state 4 to state 3 transition (Figure 10A), suggesting dysfunction of complex I of the mitochondrial electron transport chain in TnT mutant mitochondria.
Figure 10. Isolated mitochondrial studies II — redox.
Mitochondrial redox: Freshly isolated mitochondria from mutants and respective littermate controls were assayed in parallel using a fluorometer. (A) NAD(P)H oxidation (autofluorescence: λexc: 340, λem: 450 nm) was examined in the presence of complex I substrates (5 mM glutamate/malate) during state 4 and state 3 respiration. The NAD(P)H signal was calibrated by adding KCN (2.5 mM) and 2,4-dinitrophenol (DNP, 20 μΜ) at the end of each experiment. MyHC mutants had higher levels of reduced NAD(P)H during state 4 and 3 respiration. TnT mutants had higher levels of reduced NAD(P)H at the end of state 3 respiration when compared with littermate controls, because of lower oxidation of NAD(P)H by complex I during the state 4 to state 3 transition. Data are presented as relative ratios: MyHC/control-M and TnT/control-Tm. n = 21 experiments from 7 mitochondrial preparations/14 mice in control-M/MyHC group; n = 15 experiments from 5 mitochondrial preparations/10 mice in control-T/TnT group. (B–D) ROS emission: Mitochondria were incubated in Amplex Red (10 μΜ) for assessment of H2O2 emission by fluorometry (λexc: 530 nm and λem: 590 nm). H2O2 emission was assessed during state 4 and state 3 respiration, in the presence of glutamate/malate or succinate with/without rotenone at 37°C. H2O2 (100 pM) was used for signal calibration at the end of each experiment. The 2 mutants demonstrated H2O2 emission similar to that of the respective controls. Inhibition of complex I by rotenone led to lower H2O2 emission during state 3 respiration (P = 0.01). n = 5 experiments from 5 mitochondrial preparations/10 mice in each group for control-M/MyHC, and n = 4 experiments from 4 mitochondrial preparations/8 mice in each group for control-T/TnT. (E and F) ROS scavenging: Isolated mitochondria were incubated at 37°C in the presence of Amplex Red to monitor H2O2 during state 4 and state 3 respiration, with glutamate/malate (5/5 mM) and inhibitors of thioredoxin (50 nM auranofin) and/or glutathione (10 μM dinitrochlorobenzene [DNCB]) systems. Lower ROS scavenging by the thioredoxin system during state 4 was observed in TnT mutants. No other differences in ROS scavenging were detected. In A–F, data are presented as mean ± SD. n = 5 experiments from 5 mitochondrial preparations/10 mice in each group for control-M/MyHC and control-T/TnT. *P < 0.05 and **P < 0.001, using 2-sided unpaired Student’s t test.
H2O2 emission from isolated mitochondria was measured using Amplex Red. Mitochondria were assayed during non-ADP-stimulated (state 4) and ADP-stimulated (state 3) respiration (Supplemental Figure 3, B and C). ROS emission was measured during forward electron transport (NADH-oxidizing) with glutamate/malate, and reverse electron transport with succinate (72). Mitochondrial H2O2 resulting from dismutation of superoxide generated in complexes I and III was determined. We found no difference in ROS emission between the 2 mutants and their respective controls during state 3 or state 4 respiration using the complex I substrates glutamate and malate (Figure 10B). Lower ROS emission was observed during state 3 respiration, but not state 4 respiration, in TnT mutant mitochondria in the presence of succinate and rotenone (Figure 10, C and D), suggesting that complex I is the main source of ROS for TnT mutants.
The thioredoxin (Trx) and GSH systems are the main scavengers of H2O2 in the mitochondrial matrix, with NADPH being the main electron donor for these 2 systems (43). We used auranofin, a selective inhibitor of Trx reductase 2 (TrxR2), and 1-chloro-2,4-dinitrobenzene (DNCB), a GSH-depleting agent (73), to assess the ROS scavenging capacity of mutant and control mitochondria (Supplemental Figure 3D). In MyHC mutant mitochondria, ROS scavenging by the Trx system was similar to that of controls during state 3 and state 4 respiration (Figure 10, E and F). In contrast, TnT mutant mitochondria had lower ROS scavenging by the Trx system when compared with littermate controls (Figure 10E), which is consistent with a more oxidized redox environment in TnT mutant myocytes. ROS scavenging by the GSH system in MyHC and TnT mutant myocytes was similar to that of their littermate controls during both state 3 and 4 respiration (Figure 10F).
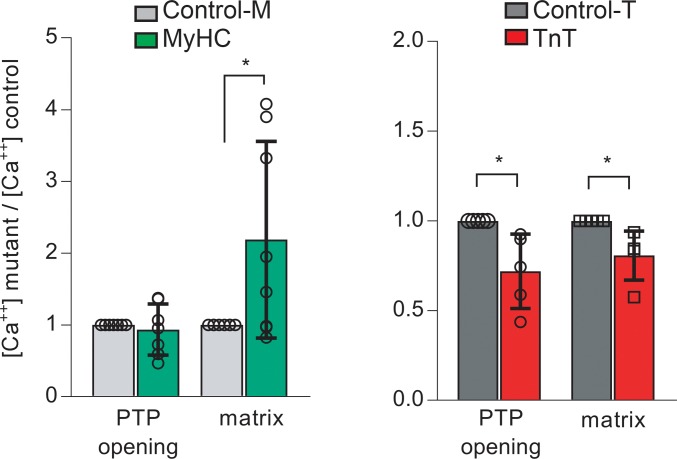
Mitochondria are an important Ca2+ sink in cardiac myocytes. Mitochondrial calcium activates dehydrogenases in the Krebs cycle, which increases NADH generation that fuels the mitochondrial electron transport chain, and stimulates respiration and ATP synthesis (45, 74). Additionally, mitochondrial calcium also influences ROS generation by complexes I and III of the electron transport chain (75) and mitochondrial ROS scavenging (43, 45). Using isolated mitochondria, we measured opening of the mitochondrial permeability transition pore (PTP) and intramitochondrial (matrix) free calcium [Ca2+] by fluorometry. Extramitochondrial and intramitochondrial [Ca2+] were measured simultaneously using Calcium Green-5N and Fura-FF, respectively. Ca2+ additions led to rapid increase in Calcium Green-5N fluorescence followed by a slower decline, consistent with the known buffering capacity of mitochondria to uptake cytosolic Ca2+. When [Ca+2] uptake exceeded a certain threshold, the mitochondrial PTP opened, releasing Ca2+ from mitochondria (Supplemental Figure 3E). The [Ca2+] threshold for PTP opening was similar in MyHC mutant and control mitochondria, but matrix [Ca2+]free in MyHC mutant mitochondria was significantly higher than in littermate controls (Figure 11). In contrast, TnT mutant mitochondria had greater sensitivity to Ca2+, evidenced by PTP opening at ~30% lower [Ca2+] uptake. Notably, matrix [Ca2+]free was also ~20% lower when compared with that of littermate control mitochondria (Figure 11).
Figure 11. Isolated mitochondrial studies III — calcium handling.
Mitochondrial calcium handling: Mitochondria were isolated in parallel from mutant and littermate control hearts. Extra- and intra-mitochondrial [Ca+2] were monitored simultaneously by fluorometry at room temperature, in freshly isolated, energized mitochondria (state 4 respiration with 5 mM glutamate/malate), using 0.1 μM Calcium Green-5N (λexc:505, λem:535 nm) and 20 μM Fura-FF (λexc:340 and 380 nm, λem:510 nm), respectively. Repeated CaCl2 (5 μM) additions were performed until permeability transition pore (PTP) activation was detected. Mutant data were normalized to corresponding littermate control results. MyHC mutants demonstrated higher matrix intramitochondrial [Ca2+]free, but PTP activation occurred at [Ca2+] similar to that of controls. TnT mutants had lower matrix [Ca2+]free and PTP activation at lower [Ca2+] than controls. Data are presented as mean ± SD. n = 8 experiments from 5 mitochondrial preparations/10 mice in each group for control-M/MyHC, and n = 5 experiments from 5 mitochondrial preparations/10 mice in each group for control-T/TnT. *P < 0.05, using 2-sided 1-sample t test.
Next, we looked for differences in expression levels of genes involved in cytosolic and mitochondrial calcium handling in our mRNA-seq data. Only calsequestrin 1 (Casq1) mRNA was significantly higher in both mutants when compared with littermate controls (P < 0.001), suggesting that differences observed in mitochondrial Ca2+handling were probably the result of differences in protein expression and/or posttranslational modifications of mitochondrial proteins involved in mitochondrial Ca2+ uptake, buffering, or efflux (Supplemental Figure 3 and Supplemental Table 2).
Identification of shared and distinct pathways in 2 models of HCM.
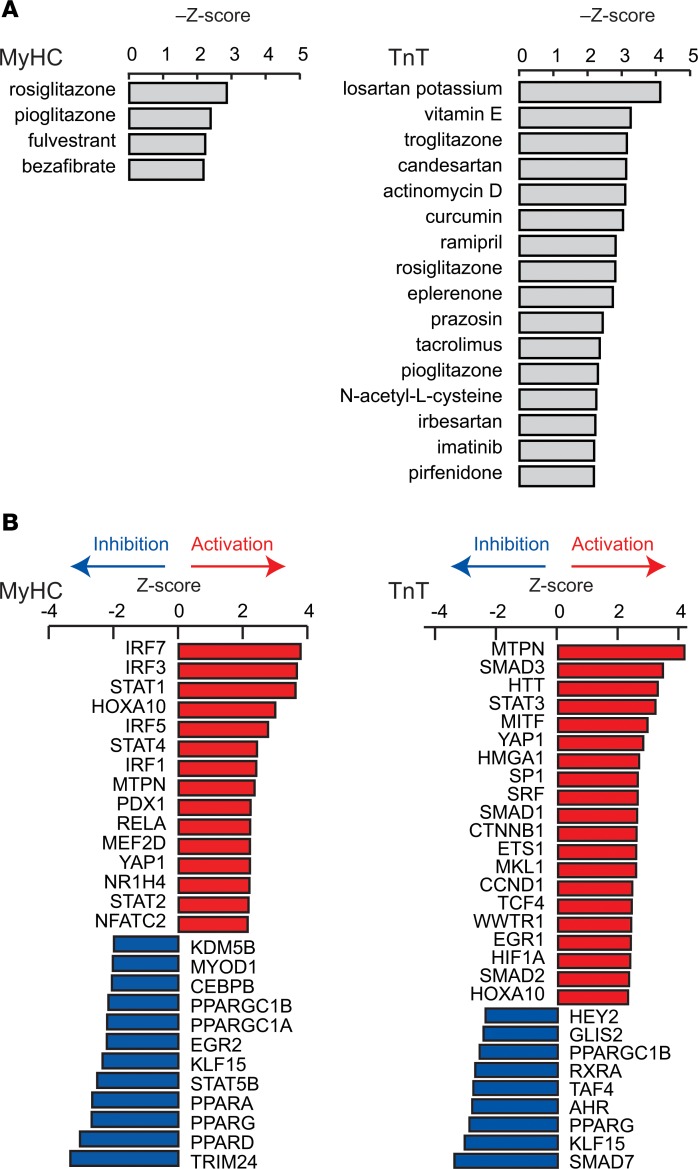
Our functional studies indicate opposing effects of the R403Q-MyHC and R92W-TnT mutations on redox in the early stage of disease, suggesting the need to individualize therapies for prevention of the molecular cardiac phenotype in HCM. To explore this question further, we used IPA to identify potential therapeutic agents (Figure 12A) and upstream transcriptional regulators that could lead to the observed transcriptional profiles (Figure 12B). Compounds were ranked by Z score using a cutoff of >2.19 for brevity. The thiazolidinediones rosiglitazone and pioglitazone, which are PPAR agonists with concomitant antiinflammatory effects (76), were the top hits for MyHC mutants (Z scores –2.87 and –2.40) — this could be explained by predicted inhibition of PPARγ and PPARα and activation of proinflammatory transcriptional regulators in this mutant (Figure 12, A and B). The angiotensin receptor blocker losartan, which is antifibrotic (77) and antihypertrophic (78), was the leading therapeutic candidate for TnT mutants (Figure 12A, Z score –4.14) that have (predicted) upregulation of TGF-β signaling and early evidence of cardiac fibrosis clinically. Antioxidants (e.g., vitamin E, N-acetylcysteine, curcumin) (79–81) were predicted therapies only for TnT mutants, which is concordant with our functional data indicating the presence of an oxidized redox environment in TnT mutants, but not MyHC mutants.
Figure 12. Identification of candidate therapeutics and upstream transcriptional regulators.
(A) Candidate therapeutics that are predicted to revert the dysregulated signaling pathways in the mutants back to that in controls. Candidate therapeutics with –Z scores >2.19 are shown. (B) Predicted change in the activity of transcriptional regulators that can explain dysregulation of the signaling pathways shown in Figure 2 in mutants. Transcriptional regulators with Z scores >2.3 or <–2.3 are shown for MyHC mutants and >2.0 or <–2.0 for TnT mutants
Discussion
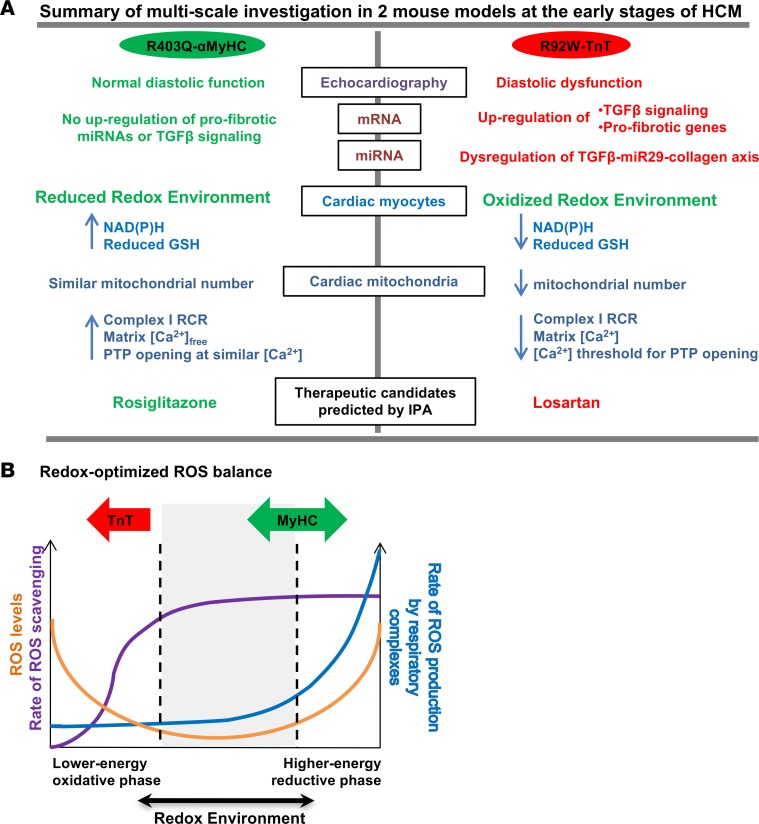
In this study, we used unbiased approaches (mRNA and miRNA profiling), echocardiography, and targeted functional studies in isolated myocytes and mitochondria to demonstrate that HCM mutations cause divergent effects on cellular processes in the early stage of disease. Our results illustrate the impact of changes in sarcomeric protein function on the transcriptome, miRNome, cellular redox, mitochondrial function, and cardiac systolic/diastolic function in the early stages of disease (Figure 13A). Importantly, the presence of an oxidized redox environment, upregulation of profibrotic genes, and downregulation of antifibrotic miRNAs in TnT mutants at an early stage suggests that antioxidant therapy could be beneficial in preventing the cardiac HCM phenotype in R92W-TnT mutation carriers. Notably, IPA of mRNA-seq data also identified antioxidants as potential therapies in the early stage in TnT mutants, but not MyHC mutants. Taken together, our results demonstrate the importance of considering mitochondrial redox and energetics in developing mutation-specific therapies for HCM.
Figure 13. Allele-specific differences in HCM revealed by analysis of transcriptome and mitochondrial function in 2 mouse models — schematic summary.
(A) Summary of multiscale studies performed in R403Q-αMyHC and R92W-TnT mutant mice along with littermate controls at the early stage of HCM. We found differences in cardiac function, mRNA/miRNA expression, mitochondrial number, redox, calcium handling, signaling, and predicted therapies in the 2 mutant mice. (B) Based on our results and the redox-optimized ROS balance hypothesis (42), MyHC mutants appear to reside at an optimal reduced phase, whereas TnT mutants lie in a lower-energy oxidative phase. Figure adapted from ref. 42.j
Allele-specific differences in transcriptome and miRnome.
A remarkable result of our study is the global changes in miRNA expression present in TnT but not in MyHC mutants, many of which involved differentially expressed miRNAs that have been implicated in cardiac hypertrophy, fibrosis, apoptosis, mitochondrial function, and autophagy (51, 57–59). To assess whether differences in miRNA biogenesis could underlie our results in TnT mutants, we examined mRNA levels of factors involved in miRNA processing, including Drosha, DGCR8, Exportin-5, Dicer, TRBP, PACT, and Argonaute, and found no significant changes in either of the mutants, when compared with littermate controls (Supplemental Table 2). Therefore, we speculate that the biophysical effects of these 2 mutations lead to differences in miRNA transcription.
The R92W-TnT mutation has been demonstrated to increase Ca2+ sensitivity of myofilament activation ~2.2 fold (82), which could lead to differences in cellular Ca2+ levels and thus influence gene transcription. On the other hand, the R403Q-MyHC mutation was shown to influence actin-activated ATPase activity (83, 84) and increase energy expenditure for contraction. Since miRNA transcription in MyHC mutants was similar to that in controls, we speculate that compensatory cellular mechanisms elicited in response to the mutation are sufficient to prevent global changes in miRNA transcription in the prehypertrophic stage.
The most significant result of our global transcriptome and miRNome analyses in mice carrying the TnT mutation was higher levels of profibrotic gene mRNAs and lower levels of antifibrotic miR-29. Mechanistically, these results can be linked to a more oxidized redox environment leading to activation of TGF-β signaling (60, 61), with consequent suppression of miR-29 and upregulation of profibrotic gene expression. Upregulation of profibrotic genes would be expected to result in development of cardiac fibrosis, which predisposes to reentrant arrhythmias (38). Previous studies in mice have showed that fibrosis develops earlier in R92W mutation than in the R403Q mutation carriers (33–35). In humans, the R92W mutation in TnT is associated with cardiac fibrosis and sudden death in young individuals (38, 39) in the absence of significant cardiac hypertrophy. In contrast, patients with the R403Q mutation in MyHC are often asymptomatic in the prehypertrophic stage of disease, and in our clinical experience (16) often develop heart failure requiring heart transplant in middle age (85). Our transcriptome analysis in MyHC mutants revealed higher expression of profibrotic mRNAs, TGF-β2, and CTGF, but pathway analysis (IPA) did not predict activation of TGF-β signaling at this time point. This could explain the later onset of cardiac fibrosis in R403Q-MyHC mutation carriers (16, 48, 64, 86).
Allele-specific differences in redox.
Five-week-old MyHC and TnT mutants exhibited opposite cellular redox status. These findings can be illustrated in terms of the redox-optimized ROS balance hypothesis, which was developed by Aon and colleagues (Figure 13B) (42). We hypothesize that these 2 mutants drive cardiac myocytes in different directions along the “redox axis.” Lower NAD(P)H and reduced GSH levels could reduce ROS scavenging, thus resulting in an oxidized redox environment and impairment of energetics in TnT mutants at the early stage of disease. In contrast, MyHC mutants have preserved levels of reduced GSH and NAD(P)H, leading to an optimal redox environment and energetics at an early stage of disease. These differences could explain higher susceptibility to arrhythmias in young patients carrying the R92W-TnT mutation, but lack of arrhythmias in R403Q-MyHC mutation carriers who lack hypertrophy (36).
The mechanisms underlying differences in redox could involve differences in gene expression as well as translational and/or posttranslational changes in proteins involved in ROS generation/scavenging. We did not detect higher ROS emission by mutant TnT mitochondria, when compared with littermate controls, despite observing an oxidized redox environment. There are 2 possible reasons for these results: (i) we measured hydrogen peroxide in our assays, whereas the main ROS species generated by the mitochondrial electron transport chain is superoxide (42, 43). Reduced dismutation of superoxide to hydrogen peroxide could underestimate ROS generation by mitochondria, using the Amplex Red assay (42); (ii) we did not test ROS generation and scavenging in the cytoplasm, which could contribute to the observed differences in redox environment.
Higher Txnip expression in TnT mutant hearts could underlie the reduced ROS scavenging by the Trx system (87) observed in our functional studies. Our mRNA-seq data also revealed significantly lower expression of uncoupling proteins UCP1 and UCP3 in MyHC mutant hearts, and our functional studies revealed better OxPhos coupling in MyHC mutant mitochondria, reflected by a higher RCR when compared with littermate controls. Since UCP1 and UCP3 expression promotes mitochondrial uncoupling (88), lower expression of these uncoupling proteins in MyHC mutant hearts could have contributed to the higher RCR determined in MyHC mutant mitochondria when compared with littermate controls.
Mitochondrial Ca2+ is another determinant of mitochondrial ROS scavenging capacity. Calcium uptake by mitochondria stimulates 3 key enzymes in the tricarboxylic acid (TCA) cycle that harness the decarboxylation of acetyl-CoA to yield NADH. NADH is converted to NADPH, which plays a critical role in maintaining mitochondrial antioxidant capacity (89, 90). Higher levels of free Ca2+ in the mitochondrial matrix in MyHC mutant mitochondria would be expected to stimulate ATP generation by OxPhos and could contribute to the reduced redox environment exhibited by isolated mitochondria. In the case of TnT mutant mitochondria, a lower Ca2+ threshold for PTP opening could lead to cell death and replacement fibrosis, and predispose to arrhythmias.
Previous studies by Lucas et al. in R403Q-MyHC mutant mice reported a reduction in complex I and IV activities (32). This contrasts with our study, which revealed better OxPhos coupling and a reduced redox environment. We attribute this difference to the use of older animals with established hypertrophy in their study compared with ours, which was performed at the prehypertrophic stage.
Translational implications.
The R92W-TNT mutation predisposes to the development of cardiac fibrosis and ventricular arrhythmias early in disease course (in young individuals), in the absence of significant hypertrophy by clinical imaging (38, 39, 62). Our study in mice at 5 weeks of age, which corresponds to adolescence in humans, indicates an early impact of this mutation on mitochondrial function/number, redox, signaling pathways, and profibrotic gene expression (34). Since there is no evidence of cardiac fibrosis by histopathology at this time point, other mechanisms, namely, Ca2+ handling and/or energetic abnormalities, could underlie diastolic dysfunction detected by echocardiography. Our results and the redox-optimized ROS balance hypothesis (42) (Figure 13B) led us to postulate that mitochondrial dysfunction and lower mitochondrial number could lead to energy and redox stress under high workload, such as during exercise, predisposing to fatal arrhythmias in the absence of significant LV hypertrophy. Since ROS can activate profibrotic TGF-β signaling (65), early treatment with agents that boost ROS scavenging may prevent development of fibrosis and arrhythmias in R92W-TNT mutation carriers.
The R403Q-MyHC mutants demonstrated preserved mitochondrial function and a reduced redox environment at this early stage, which could underlie the asymptomatic status of mutation carriers in the prehypertrophic stage (35). Our results also suggest that therapies with antioxidants may not be helpful at the prehypertrophic stage in R403Q-MyHC mutation carriers.
Limitations.
Direct clinical translation of our results is limited by the need to obtain heart tissue prior to tailoring therapies. Here, all studies were performed in mouse models in the early stage of disease. Hence, our study design does not permit us to conclude whether differences are mutation-specific or specific to the sarcomeric protein carrying the causal mutation (91). It is possible that mutation-specific differences present in 5-week-old mice, at the early stage, are not maintained following establishment of overt disease. Functional studies in 24-week-old mice presenting evidence of the cardiac HCM phenotype are needed to address this question.
This proof-of-principle study in 2 mouse models was designed to demonstrate differences in disease pathophysiology. Given the differences in physiology between mouse and human hearts, studies in human cardiac myocytes are needed to confirm mutation-specific differences in disease pathophysiology. A co-clinical trial model that combines molecular cardiac imaging/blood biomarkers (for preclinical risk stratification, molecular phenotyping) and studies in human cardiac myocytes derived from induced pluripotent stem cells (to assess disease mechanisms) in families with known/unknown causal HCM mutations is needed to implement targeted therapies in HCM.
We used isoflurane, which is known to depress systolic function during echocardiography. Use of isoflurane and Simpson’s method (which was used to compute ejection fraction) could explain the lower ejection fractions in our study, when compared with previous studies in HCM mice by other groups (12, 64, 92). Notwithstanding this limitation, we believe that the differences observed are valid, since we used the same protocol for induction/maintenance of anesthesia in all animals, which is reflected by similar heart rates in the groups studied.
Last, we did not perform rhythm monitoring, stress testing, or electrophysiologic studies. Hence, we were unable to directly examine the relationship between abnormalities in metabolism/redox and ventricular arrhythmias in these 2 HCM mouse models.
Conclusions.
To our knowledge, this is the first study of its kind to directly compare effects of causal HCM mutations in 2 distinct sarcomeric proteins using a combination of expression analyses and focused functional studies in the early stage of disease. We found mutation-specific effects in the transcriptome, miRNome, systolic/diastolic function, redox, mitochondrial Ca2+handling, respiration, ROS scavenging, and expression of profibrotic genes/miRNA. Based on our results we advocate consideration of a pathophysiology-centric approach for prevention of the HCM phenotype.
Methods
See Supplemental Materials for detailed methods.
Statistics.
Data are represented as mean ± SD unless otherwise noted. Fluorometry data were analyzed using Origin8 software (OriginLab). Graphs were generated using GraphPad Prism 7.02 software. Two-tailed Student’s t test was used to compare data from each mutant to that of its respective littermate control. Correction for multiplicity of testing was performed by applying Bonferroni’s correction when multiple measurements were performed in a sample. A P value less than 0.05 was considered significant.
Study approval.
All procedures involving the handling of animals were approved by the Animal Care and Use Committee of the Johns Hopkins University and adhered to NIH Public Health Service guidelines.
High-throughput RNA sequencing data.
The Sequence Read Archive (SRA) accession number for the mRNA-seq and miRNA-seq libraries reported herein is SRP083078.
Author contributions
SV designed, performed, and analyzed functional studies. RF designed, performed, and analyzed mRNA-seq and miRNA-seq data. DBF performed IPA. LS and TPA performed and analyzed echocardiography studies. YG and KW maintained the mouse colonies; CGT, YG, and YL performed myocyte isolation. YL performed miR–qRT-PCR and pathology. RPR assisted with data analysis. MAA, TL, and BOR provided advice on mitochondrial study design/data analysis and access to equipment. JCT and LAL provided transgenic mouse breeders. MRA, SV, and RF were responsible for overall study design and data analysis. SV, RF, MRA, MAA, LAL, and DBF were involved in manuscript preparation. All authors reviewed and approved the manuscript.
Supplementary Material
Acknowledgments
We are grateful to Liliana D. Florea of the Johns Hopkins Institute of Genetic Medicine for advice/help with analysis of high-throughput sequencing data. This study was supported by the John Taylor Babbitt (JTB) foundation; NIH grant R01HL092985; startup funds from the UCSF Division of Cardiology to MRA; 15SDG23220028 from the American Heart Association to RF; R01GM116841 from the National Institute of General Medical Sciences (NIGMS) to RF; and startup funds from the Johns Hopkins University Department of Biological Chemistry to RF. SV was supported in part by a fellowship from the Hellenic Cardiology Society, KW by an NIH Diversity Supplement, and YG by a grant from Wuxi Mei-Yuan Hospital, China. LAL is supported by NIH HL11738.
Version 1. 03/22/2018
Electronic publication
Footnotes
MAA’s present address is: National Institute on Aging, NIH, Baltimore Maryland, USA.
CGT’s present address is: Department of Translational Medical Sciences, Federico II University, Naples, Italy.
Conflict of interest: LAL is a founder and shareholder of MyoKardia Inc.
Reference information: JCI Insight. 2018;3(6):e94493. https://doi.org/10.1172/jci.insight.94493.
Contributor Information
Styliani Vakrou, Email: stella.vakrou@gmail.com.
Ryuya Fukunaga, Email: fukunaga@jhmi.edu.
D. Brian Foster, Email: dbrianfoster@jhmi.edu.
Lars Sorensen, Email: Larslindholmsoerensen@gmail.com.
Yamin Liu, Email: yliu181@jhmi.edu.
Yufan Guan, Email: yufanguan9@gmail.com.
Kirubel Woldemichael, Email: woldemichaek@gmail.com.
Roberto Pineda-Reyes, Email: repineda1@gmail.com.
Ting Liu, Email: tliu11@jhmi.edu.
Carlo G. Tocchetti, Email: carlogabriele.tocchetti@unina.it.
Miguel A. Aon, Email: maon1@jhmi.edu.
M. Roselle Abraham, Email: mabraha3@jhmi.edu.
References
- 1.Maron BJ. Hypertrophic cardiomyopathy: a systematic review. JAMA. 2002;287(10):1308–1320. doi: 10.1001/jama.287.10.1308. [DOI] [PubMed] [Google Scholar]
- 2.Ho CY, et al. Myocardial fibrosis as an early manifestation of hypertrophic cardiomyopathy. N Engl J Med. 2010;363(6):552–563. doi: 10.1056/NEJMoa1002659. [DOI] [PMC free article] [PubMed] [Google Scholar]
- 3.Maron BJ, Maron MS. Hypertrophic cardiomyopathy. Lancet. 2013;381(9862):242–255. doi: 10.1016/S0140-6736(12)60397-3. [DOI] [PubMed] [Google Scholar]
- 4.Maron BJ, Gardin JM, Flack JM, Gidding SS, Kurosaki TT, Bild DE. Prevalence of hypertrophic cardiomyopathy in a general population of young adults. Echocardiographic analysis of 4111 subjects in the CARDIA Study. Coronary Artery Risk Development in (Young) Adults. Circulation. 1995;92(4):785–789. doi: 10.1161/01.CIR.92.4.785. [DOI] [PubMed] [Google Scholar]
- 5.Vakrou S, Abraham MR. Hypertrophic cardiomyopathy: a heart in need of an energy bar? Front Physiol. 2014;5:309. doi: 10.3389/fphys.2014.00309. [DOI] [PMC free article] [PubMed] [Google Scholar]
- 6.Maron BJ, et al. Clinical profile of stroke in 900 patients with hypertrophic cardiomyopathy. J Am Coll Cardiol. 2002;39(2):301–307. doi: 10.1016/S0735-1097(01)01727-2. [DOI] [PubMed] [Google Scholar]
- 7.Robinson P, Griffiths PJ, Watkins H, Redwood CS. Dilated and hypertrophic cardiomyopathy mutations in troponin and alpha-tropomyosin have opposing effects on the calcium affinity of cardiac thin filaments. Circ Res. 2007;101(12):1266–1273. doi: 10.1161/CIRCRESAHA.107.156380. [DOI] [PubMed] [Google Scholar]
- 8.Guinto PJ, Haim TE, Dowell-Martino CC, Sibinga N, Tardiff JC. Temporal and mutation-specific alterations in Ca2+ homeostasis differentially determine the progression of cTnT-related cardiomyopathies in murine models. Am J Physiol Heart Circ Physiol. 2009;297(2):H614–H626. doi: 10.1152/ajpheart.01143.2008. [DOI] [PMC free article] [PubMed] [Google Scholar]
- 9.Gao WD, Pérez NG, Seidman CE, Seidman JG, Marbán E. Altered cardiac excitation-contraction coupling in mutant mice with familial hypertrophic cardiomyopathy. J Clin Invest. 1999;103(5):661–666. doi: 10.1172/JCI5220. [DOI] [PMC free article] [PubMed] [Google Scholar]
- 10.Szczesna-Cordary D, Guzman G, Ng SS, Zhao J. Familial hypertrophic cardiomyopathy-linked alterations in Ca2+ binding of human cardiac myosin regulatory light chain affect cardiac muscle contraction. J Biol Chem. 2004;279(5):3535–3542. doi: 10.1074/jbc.M307092200. [DOI] [PubMed] [Google Scholar]
- 11.Blanchard E, Seidman C, Seidman JG, LeWinter M, Maughan D. Altered crossbridge kinetics in the alphaMHC403/+ mouse model of familial hypertrophic cardiomyopathy. Circ Res. 1999;84(4):475–483. doi: 10.1161/01.RES.84.4.475. [DOI] [PubMed] [Google Scholar]
- 12.Fatkin D, et al. An abnormal Ca(2+) response in mutant sarcomere protein-mediated familial hypertrophic cardiomyopathy. J Clin Invest. 2000;106(11):1351–1359. doi: 10.1172/JCI11093. [DOI] [PMC free article] [PubMed] [Google Scholar]
- 13.Spindler M, et al. Diastolic dysfunction and altered energetics in the alphaMHC403/+ mouse model of familial hypertrophic cardiomyopathy. J Clin Invest. 1998;101(8):1775–1783. doi: 10.1172/JCI1940. [DOI] [PMC free article] [PubMed] [Google Scholar]
- 14.Crilley JG, et al. Hypertrophic cardiomyopathy due to sarcomeric gene mutations is characterized by impaired energy metabolism irrespective of the degree of hypertrophy. J Am Coll Cardiol. 2003;41(10):1776–1782. doi: 10.1016/S0735-1097(02)03009-7. [DOI] [PubMed] [Google Scholar]
- 15.Blair E, et al. Mutations in the gamma(2) subunit of AMP-activated protein kinase cause familial hypertrophic cardiomyopathy: evidence for the central role of energy compromise in disease pathogenesis. Hum Mol Genet. 2001;10(11):1215–1220. doi: 10.1093/hmg/10.11.1215. [DOI] [PubMed] [Google Scholar]
- 16.Abraham MR, et al. Creatine kinase adenosine triphosphate and phosphocreatine energy supply in a single kindred of patients with hypertrophic cardiomyopathy. Am J Cardiol. 2013;112(6):861–866. doi: 10.1016/j.amjcard.2013.05.017. [DOI] [PMC free article] [PubMed] [Google Scholar]
- 17.Javadpour MM, Tardiff JC, Pinz I, Ingwall JS. Decreased energetics in murine hearts bearing the R92Q mutation in cardiac troponin T. J Clin Invest. 2003;112(5):768–775. doi: 10.1172/JCI15967. [DOI] [PMC free article] [PubMed] [Google Scholar]
- 18.He H, Javadpour MM, Latif F, Tardiff JC, Ingwall JS. R-92L and R-92W mutations in cardiac troponin T lead to distinct energetic phenotypes in intact mouse hearts. Biophys J. 2007;93(5):1834–1844. doi: 10.1529/biophysj.107.107557. [DOI] [PMC free article] [PubMed] [Google Scholar]
- 19.Nakamura K, et al. Relationship between oxidative stress and systolic dysfunction in patients with hypertrophic cardiomyopathy. J Card Fail. 2005;11(2):117–123. doi: 10.1016/j.cardfail.2004.05.005. [DOI] [PubMed] [Google Scholar]
- 20.Dimitrow PP, Undas A, Wołkow P, Tracz W, Dubiel JS. Enhanced oxidative stress in hypertrophic cardiomyopathy. Pharmacol Rep. 2009;61(3):491–495. doi: 10.1016/S1734-1140(09)70091-X. [DOI] [PubMed] [Google Scholar]
- 21.Lombardi R, et al. Resolution of established cardiac hypertrophy and fibrosis and prevention of systolic dysfunction in a transgenic rabbit model of human cardiomyopathy through thiol-sensitive mechanisms. Circulation. 2009;119(10):1398–1407. doi: 10.1161/CIRCULATIONAHA.108.790501. [DOI] [PMC free article] [PubMed] [Google Scholar]
- 22.Semsarian C, et al. The L-type calcium channel inhibitor diltiazem prevents cardiomyopathy in a mouse model. J Clin Invest. 2002;109(8):1013–1020. doi: 10.1172/JCI14677. [DOI] [PMC free article] [PubMed] [Google Scholar]
- 23.Westermann D, et al. Diltiazem treatment prevents diastolic heart failure in mice with familial hypertrophic cardiomyopathy. Eur J Heart Fail. 2006;8(2):115–121. doi: 10.1016/j.ejheart.2005.07.012. [DOI] [PubMed] [Google Scholar]
- 24.Lim DS, et al. Angiotensin II blockade reverses myocardial fibrosis in a transgenic mouse model of human hypertrophic cardiomyopathy. Circulation. 2001;103(6):789–791. doi: 10.1161/01.CIR.103.6.789. [DOI] [PMC free article] [PubMed] [Google Scholar]
- 25.Marian AJ, Senthil V, Chen SN, Lombardi R. Antifibrotic effects of antioxidant N-acetylcysteine in a mouse model of human hypertrophic cardiomyopathy mutation. J Am Coll Cardiol. 2006;47(4):827–834. doi: 10.1016/j.jacc.2005.10.041. [DOI] [PMC free article] [PubMed] [Google Scholar]
- 26.Wilder T, Ryba DM, Wieczorek DF, Wolska BM, Solaro RJ. N-acetylcysteine reverses diastolic dysfunction and hypertrophy in familial hypertrophic cardiomyopathy. Am J Physiol Heart Circ Physiol. 2015;309(10):H1720–H1730. doi: 10.1152/ajpheart.00339.2015. [DOI] [PMC free article] [PubMed] [Google Scholar]
- 27.Gehmlich K, et al. Changes in the cardiac metabolome caused by perhexiline treatment in a mouse model of hypertrophic cardiomyopathy. Mol Biosyst. 2015;11(2):564–573. doi: 10.1039/C4MB00594E. [DOI] [PubMed] [Google Scholar]
- 28.Ho CY, et al. Diltiazem treatment for pre-clinical hypertrophic cardiomyopathy sarcomere mutation carriers: a pilot randomized trial to modify disease expression. JACC Heart Fail. 2015;3(2):180–188. doi: 10.1016/j.jchf.2014.08.003. [DOI] [PMC free article] [PubMed] [Google Scholar]
- 29.Axelsson A, et al. Efficacy and safety of the angiotensin II receptor blocker losartan for hypertrophic cardiomyopathy: the INHERIT randomised, double-blind, placebo-controlled trial. Lancet Diabetes Endocrinol. 2015;3(2):123–131. doi: 10.1016/S2213-8587(14)70241-4. [DOI] [PubMed] [Google Scholar]
- 30.Axelsson A, et al. Functional effects of losartan in hypertrophic cardiomyopathy-a randomised clinical trial. Heart. 2016;102(4):285–291. doi: 10.1136/heartjnl-2015-308343. [DOI] [PubMed] [Google Scholar]
- 31.Abozguia K, et al. Metabolic modulator perhexiline corrects energy deficiency and improves exercise capacity in symptomatic hypertrophic cardiomyopathy. Circulation. 2010;122(16):1562–1569. doi: 10.1161/CIRCULATIONAHA.109.934059. [DOI] [PubMed] [Google Scholar]
- 32.Lucas DT, Aryal P, Szweda LI, Koch WJ, Leinwand LA. Alterations in mitochondrial function in a mouse model of hypertrophic cardiomyopathy. Am J Physiol Heart Circ Physiol. 2003;284(2):H575–H583. doi: 10.1152/ajpheart.00619.2002. [DOI] [PubMed] [Google Scholar]
- 33.Vikstrom KL, Factor SM, Leinwand LA. Mice expressing mutant myosin heavy chains are a model for familial hypertrophic cardiomyopathy. Mol Med. 1996;2(5):556–567. [PMC free article] [PubMed] [Google Scholar]
- 34.Ertz-Berger BR, et al. Changes in the chemical and dynamic properties of cardiac troponin T cause discrete cardiomyopathies in transgenic mice. Proc Natl Acad Sci USA. 2005;102(50):18219–18224. doi: 10.1073/pnas.0509181102. [DOI] [PMC free article] [PubMed] [Google Scholar]
- 35.Geisterfer-Lowrance AA, et al. A molecular basis for familial hypertrophic cardiomyopathy: a beta cardiac myosin heavy chain gene missense mutation. Cell. 1990;62(5):999–1006. doi: 10.1016/0092-8674(90)90274-I. [DOI] [PubMed] [Google Scholar]
- 36.Epstein ND, Cohn GM, Cyran F, Fananapazir L. Differences in clinical expression of hypertrophic cardiomyopathy associated with two distinct mutations in the beta-myosin heavy chain gene. A 908Leu----Val mutation and a 403Arg----Gln mutation. Circulation. 1992;86(2):345–352. doi: 10.1161/01.CIR.86.2.345. [DOI] [PubMed] [Google Scholar]
- 37.Nag S, et al. Contractility parameters of human β-cardiac myosin with the hypertrophic cardiomyopathy mutation R403Q show loss of motor function. Sci Adv. 2015;1(9):e1500511. doi: 10.1126/sciadv.1500511. [DOI] [PMC free article] [PubMed] [Google Scholar]
- 38.Moolman JC, et al. Sudden death due to troponin T mutations. J Am Coll Cardiol. 1997;29(3):549–555. doi: 10.1016/S0735-1097(96)00530-X. [DOI] [PubMed] [Google Scholar]
- 39.Watkins H, et al. Mutations in the genes for cardiac troponin T and alpha-tropomyosin in hypertrophic cardiomyopathy. N Engl J Med. 1995;332(16):1058–1064. doi: 10.1056/NEJM199504203321603. [DOI] [PubMed] [Google Scholar]
- 40.Homburger JR, et al. Multidimensional structure-function relationships in human β-cardiac myosin from population-scale genetic variation. Proc Natl Acad Sci USA. 2016;113(24):6701–6706. doi: 10.1073/pnas.1606950113. [DOI] [PMC free article] [PubMed] [Google Scholar]
- 41.Gersh BJ, et al. 2011 ACCF/AHA Guideline for the Diagnosis and Treatment of Hypertrophic Cardiomyopathy: a report of the American College of Cardiology Foundation/American Heart Association Task Force on Practice Guidelines. Developed in collaboration with the American Association for Thoracic Surgery, American Society of Echocardiography, American Society of Nuclear Cardiology, Heart Failure Society of America, Heart Rhythm Society, Society for Cardiovascular Angiography and Interventions, and Society of Thoracic Surgeons. J Am Coll Cardiol. 2011;58(25):e212–e260. doi: 10.1016/j.jacc.2011.06.011. [DOI] [PubMed] [Google Scholar]
- 42.Aon MA, Cortassa S, O’Rourke B. Redox-optimized ROS balance: a unifying hypothesis. Biochim Biophys Acta. 2010;1797(6–7):865–877. doi: 10.1016/j.bbabio.2010.02.016. [DOI] [PMC free article] [PubMed] [Google Scholar]
- 43.Aon MA, et al. Glutathione/thioredoxin systems modulate mitochondrial H2O2 emission: an experimental-computational study. J Gen Physiol. 2012;139(6):479–491. doi: 10.1085/jgp.201210772. [DOI] [PMC free article] [PubMed] [Google Scholar]
- 44.Tocchetti CG, et al. GSH or palmitate preserves mitochondrial energetic/redox balance, preventing mechanical dysfunction in metabolically challenged myocytes/hearts from type 2 diabetic mice. Diabetes. 2012;61(12):3094–3105. doi: 10.2337/db12-0072. [DOI] [PMC free article] [PubMed] [Google Scholar]
- 45.Liu T, et al. Inhibiting mitochondrial Na+/Ca2+ exchange prevents sudden death in a Guinea pig model of heart failure. Circ Res. 2014;115(1):44–54. doi: 10.1161/CIRCRESAHA.115.303062. [DOI] [PMC free article] [PubMed] [Google Scholar]
- 46.Cortassa S, O’Rourke B, Aon MA. Redox-optimized ROS balance and the relationship between mitochondrial respiration and ROS. Biochim Biophys Acta. 2014;1837(2):287–295. doi: 10.1016/j.bbabio.2013.11.007. [DOI] [PMC free article] [PubMed] [Google Scholar]
- 47.Ashrafian H, Redwood C, Blair E, Watkins H. Hypertrophic cardiomyopathy:a paradigm for myocardial energy depletion. Trends Genet. 2003;19(5):263–268. doi: 10.1016/S0168-9525(03)00081-7. [DOI] [PubMed] [Google Scholar]
- 48.Kim JB, et al. Polony multiplex analysis of gene expression (PMAGE) in mouse hypertrophic cardiomyopathy. Science. 2007;316(5830):1481–1484. doi: 10.1126/science.1137325. [DOI] [PubMed] [Google Scholar]
- 49.Geisterfer-Lowrance AA, et al. A mouse model of familial hypertrophic cardiomyopathy. Science. 1996;272(5262):731–734. doi: 10.1126/science.272.5262.731. [DOI] [PubMed] [Google Scholar]
- 50.Burke MA, et al. Molecular profiling of dilated cardiomyopathy that progresses to heart failure. JCI Insight. 2016;1(6):e94382. doi: 10.1172/jci.insight.86898. [DOI] [PMC free article] [PubMed] [Google Scholar]
- 51.Wang J, Liew OW, Richards AM, Chen YT. Overview of microRNAs in cardiac hypertrophy, fibrosis, and apoptosis. Int J Mol Sci. 2016;17(5):749. doi: 10.3390/ijms17050749. [DOI] [PMC free article] [PubMed] [Google Scholar]
- 52.Small EM, Olson EN. Pervasive roles of microRNAs in cardiovascular biology. Nature. 2011;469(7330):336–342. doi: 10.1038/nature09783. [DOI] [PMC free article] [PubMed] [Google Scholar]
- 53.Bagnall RD, Tsoutsman T, Shephard RE, Ritchie W, Semsarian C. Global microRNA profiling of the mouse ventricles during development of severe hypertrophic cardiomyopathy and heart failure. PLoS ONE. 2012;7(9):e44744. doi: 10.1371/journal.pone.0044744. [DOI] [PMC free article] [PubMed] [Google Scholar]
- 54.Kuster DW, et al. MicroRNA transcriptome profiling in cardiac tissue of hypertrophic cardiomyopathy patients with MYBPC3 mutations. J Mol Cell Cardiol. 2013;65:59–66. doi: 10.1016/j.yjmcc.2013.09.012. [DOI] [PubMed] [Google Scholar]
- 55.Leptidis S, et al. A deep sequencing approach to uncover the miRNOME in the human heart. PLoS ONE. 2013;8(2):e57800. doi: 10.1371/journal.pone.0057800. [DOI] [PMC free article] [PubMed] [Google Scholar]
- 56.Roncarati R, et al. Circulating miR-29a, among other up-regulated microRNAs, is the only biomarker for both hypertrophy and fibrosis in patients with hypertrophic cardiomyopathy. J Am Coll Cardiol. 2014;63(9):920–927. doi: 10.1016/j.jacc.2013.09.041. [DOI] [PubMed] [Google Scholar]
- 57.Srinivasan H, Das S. Mitochondrial miRNA (MitomiR): a new player in cardiovascular health. Can J Physiol Pharmacol. 2015;93(10):855–861. doi: 10.1139/cjpp-2014-0500. [DOI] [PubMed] [Google Scholar]
- 58.Duarte FV, Palmeira CM, Rolo AP. The Role of microRNAs in Mitochondria: Small Players Acting Wide. Genes (Basel) 2014;5(4):865–886. doi: 10.3390/genes5040865. [DOI] [PMC free article] [PubMed] [Google Scholar]
- 59.Boon RA, Dimmeler S. MicroRNAs in myocardial infarction. Nat Rev Cardiol. 2015;12(3):135–142. doi: 10.1038/nrcardio.2014.207. [DOI] [PubMed] [Google Scholar]
- 60.van Rooij E, et al. Dysregulation of microRNAs after myocardial infarction reveals a role of miR-29 in cardiac fibrosis. Proc Natl Acad Sci USA. 2008;105(35):13027–13032. doi: 10.1073/pnas.0805038105. [DOI] [PMC free article] [PubMed] [Google Scholar]
- 61.Zhou L, Wang L, Lu L, Jiang P, Sun H, Wang H. Inhibition of miR-29 by TGF-beta-Smad3 signaling through dual mechanisms promotes transdifferentiation of mouse myoblasts into myofibroblasts. PLoS ONE. 2012;7(3):e33766. doi: 10.1371/journal.pone.0033766. [DOI] [PMC free article] [PubMed] [Google Scholar]
- 62.Varnava AM, Elliott PM, Baboonian C, Davison F, Davies MJ, McKenna WJ. Hypertrophic cardiomyopathy: histopathological features of sudden death in cardiac troponin T disease. Circulation. 2001;104(12):1380–1384. doi: 10.1161/hc3701.095952. [DOI] [PubMed] [Google Scholar]
- 63.Knollmann BC, et al. Familial hypertrophic cardiomyopathy-linked mutant troponin T causes stress-induced ventricular tachycardia and Ca2+-dependent action potential remodeling. Circ Res. 2003;92(4):428–436. doi: 10.1161/01.RES.0000059562.91384.1A. [DOI] [PubMed] [Google Scholar]
- 64.Teekakirikul P, et al. Cardiac fibrosis in mice with hypertrophic cardiomyopathy is mediated by non-myocyte proliferation and requires Tgf-β. J Clin Invest. 2010;120(10):3520–3529. doi: 10.1172/JCI42028. [DOI] [PMC free article] [PubMed] [Google Scholar]
- 65.Jain M, et al. Mitochondrial reactive oxygen species regulate transforming growth factor-β signaling. J Biol Chem. 2013;288(2):770–777. doi: 10.1074/jbc.M112.431973. [DOI] [PMC free article] [PubMed] [Google Scholar]
- 66.Bhatt NM, et al. Restoring redox balance enhances contractility in heart trabeculae from type 2 diabetic rats exposed to high glucose. Am J Physiol Heart Circ Physiol. 2015;308(4):H291–H302. doi: 10.1152/ajpheart.00378.2014. [DOI] [PMC free article] [PubMed] [Google Scholar]
- 67.Aon MA, Tocchetti CG, Bhatt N, Paolocci N, Cortassa S. Protective mechanisms of mitochondria and heart function in diabetes. Antioxid Redox Signal. 2015;22(17):1563–1586. doi: 10.1089/ars.2014.6123. [DOI] [PMC free article] [PubMed] [Google Scholar]
- 68.Zelko IN, Mariani TJ, Folz RJ. Superoxide dismutase multigene family: a comparison of the CuZn-SOD (SOD1), Mn-SOD (SOD2), and EC-SOD (SOD3) gene structures, evolution, and expression. Free Radic Biol Med. 2002;33(3):337–349. doi: 10.1016/S0891-5849(02)00905-X. [DOI] [PubMed] [Google Scholar]
- 69.Zhou R, Tardivel A, Thorens B, Choi I, Tschopp J. Thioredoxin-interacting protein links oxidative stress to inflammasome activation. Nat Immunol. 2010;11(2):136–140. doi: 10.1038/ni.1831. [DOI] [PubMed] [Google Scholar]
- 70.Akhmedov AT, Rybin V, Marín-García J. Mitochondrial oxidative metabolism and uncoupling proteins in the failing heart. Heart Fail Rev. 2015;20(2):227–249. doi: 10.1007/s10741-014-9457-4. [DOI] [PubMed] [Google Scholar]
- 71.Balaban RS, Nemoto S, Finkel T. Mitochondria, oxidants, and aging. Cell. 2005;120(4):483–495. doi: 10.1016/j.cell.2005.02.001. [DOI] [PubMed] [Google Scholar]
- 72.Treberg JR, Quinlan CL, Brand MD. Evidence for two sites of superoxide production by mitochondrial NADH-ubiquinone oxidoreductase (complex I) J Biol Chem. 2011;286(31):27103–27110. doi: 10.1074/jbc.M111.252502. [DOI] [PMC free article] [PubMed] [Google Scholar]
- 73.Stanley BA, et al. Thioredoxin reductase-2 is essential for keeping low levels of H(2)O(2) emission from isolated heart mitochondria. J Biol Chem. 2011;286(38):33669–33677. doi: 10.1074/jbc.M111.284612. [DOI] [PMC free article] [PubMed] [Google Scholar]
- 74.Balaban RS. The role of Ca(2+) signaling in the coordination of mitochondrial ATP production with cardiac work. Biochim Biophys Acta. 2009;1787(11):1334–1341. doi: 10.1016/j.bbabio.2009.05.011. [DOI] [PMC free article] [PubMed] [Google Scholar]
- 75.Görlach A, Bertram K, Hudecova S, Krizanova O. Calcium and ROS: A mutual interplay. Redox Biol. 2015;6:260–271. doi: 10.1016/j.redox.2015.08.010. [DOI] [PMC free article] [PubMed] [Google Scholar]
- 76.Cuzzocrea S, et al. Rosiglitazone, a ligand of the peroxisome proliferator-activated receptor-gamma, reduces acute inflammation. Eur J Pharmacol. 2004;483(1):79–93. doi: 10.1016/j.ejphar.2003.10.056. [DOI] [PubMed] [Google Scholar]
- 77.Díez J, Querejeta R, López B, González A, Larman M, Martínez Ubago JL. Losartan-dependent regression of myocardial fibrosis is associated with reduction of left ventricular chamber stiffness in hypertensive patients. Circulation. 2002;105(21):2512–2517. doi: 10.1161/01.CIR.0000017264.66561.3D. [DOI] [PubMed] [Google Scholar]
- 78.Devereux RB, et al. Regression of hypertensive left ventricular hypertrophy by losartan compared with atenolol: the Losartan Intervention for Endpoint Reduction in Hypertension (LIFE) trial. Circulation. 2004;110(11):1456–1462. doi: 10.1161/01.CIR.0000141573.44737.5A. [DOI] [PubMed] [Google Scholar]
- 79.Traber MG, Atkinson J. Vitamin E, antioxidant and nothing more. Free Radic Biol Med. 2007;43(1):4–15. doi: 10.1016/j.freeradbiomed.2007.03.024. [DOI] [PMC free article] [PubMed] [Google Scholar]
- 80.Menon VP, Sudheer AR. Antioxidant and anti-inflammatory properties of curcumin. Adv Exp Med Biol. 2007;595:105–125. doi: 10.1007/978-0-387-46401-5_3. [DOI] [PubMed] [Google Scholar]
- 81.De Vries N, De Flora S. N-acetyl-l-cysteine. J Cell Biochem Suppl. 1993;17F:270–277. doi: 10.1002/jcb.240531040. [DOI] [PubMed] [Google Scholar]
- 82.Chandra M, Tschirgi ML, Tardiff JC. Increase in tension-dependent ATP consumption induced by cardiac troponin T mutation. Am J Physiol Heart Circ Physiol. 2005;289(5):H2112–H2119. doi: 10.1152/ajpheart.00571.2005. [DOI] [PubMed] [Google Scholar]
- 83.Tyska MJ, Hayes E, Giewat M, Seidman CE, Seidman JG, Warshaw DM. Single-molecule mechanics of R403Q cardiac myosin isolated from the mouse model of familial hypertrophic cardiomyopathy. Circ Res. 2000;86(7):737–744. doi: 10.1161/01.RES.86.7.737. [DOI] [PubMed] [Google Scholar]
- 84.Moore JR, Leinwand L, Warshaw DM. Understanding cardiomyopathy phenotypes based on the functional impact of mutations in the myosin motor. Circ Res. 2012;111(3):375–385. doi: 10.1161/CIRCRESAHA.110.223842. [DOI] [PMC free article] [PubMed] [Google Scholar]
- 85.Bravo PE, et al. PET/CT assessment of symptomatic individuals with obstructive and nonobstructive hypertrophic cardiomyopathy. J Nucl Med. 2012;53(3):407–414. doi: 10.2967/jnumed.111.096156. [DOI] [PubMed] [Google Scholar]
- 86.Olsson MC, Palmer BM, Leinwand LA, Moore RL. Gender and aging in a transgenic mouse model of hypertrophic cardiomyopathy. Am J Physiol Heart Circ Physiol. 2001;280(3):H1136–H1144. doi: 10.1152/ajpheart.2001.280.3.H1136. [DOI] [PubMed] [Google Scholar]
- 87.Chutkow WA, Patwari P, Yoshioka J, Lee RT. Thioredoxin-interacting protein (Txnip) is a critical regulator of hepatic glucose production. J Biol Chem. 2008;283(4):2397–2406. doi: 10.1074/jbc.M708169200. [DOI] [PubMed] [Google Scholar]
- 88.Boudina S, et al. UCP3 regulates cardiac efficiency and mitochondrial coupling in high fat-fed mice but not in leptin-deficient mice. Diabetes. 2012;61(12):3260–3269. doi: 10.2337/db12-0063. [DOI] [PMC free article] [PubMed] [Google Scholar]
- 89.Liu T, O’Rourke B. Regulation of the Na+/Ca2+ exchanger by pyridine nucleotide redox potential in ventricular myocytes. J Biol Chem. 2013;288(44):31984–31992. doi: 10.1074/jbc.M113.496588. [DOI] [PMC free article] [PubMed] [Google Scholar]
- 90.Aon MA, Cortassa S, Maack C, O’Rourke B. Sequential opening of mitochondrial ion channels as a function of glutathione redox thiol status. J Biol Chem. 2007;282(30):21889–21900. doi: 10.1074/jbc.M702841200. [DOI] [PMC free article] [PubMed] [Google Scholar]
- 91.Green EM, et al. A small-molecule inhibitor of sarcomere contractility suppresses hypertrophic cardiomyopathy in mice. Science. 2016;351(6273):617–621. doi: 10.1126/science.aad3456. [DOI] [PMC free article] [PubMed] [Google Scholar]
- 92.Stypmann J, Engelen MA, Troatz C, Rothenburger M, Eckardt L, Tiemann K. Echocardiographic assessment of global left ventricular function in mice. Lab Anim. 2009;43(2):127–137. doi: 10.1258/la.2007.06001e. [DOI] [PubMed] [Google Scholar]
Associated Data
This section collects any data citations, data availability statements, or supplementary materials included in this article.


