Abstract
In diffusion governed by Fick’s law, the diffusion coefficient represents the phenomenological material parameter and is, in general, a constant. In certain cases of diffusion through porous media, the diffusion coefficient can be variable (i.e. non-constant) due to the complex process of solute displacements within microstructure, since these displacements depend on porosity, internal microstructural geometry, size of the transported particles, chemical nature, and physical interactions between the diffusing substance and the microstructural surroundings. In order to provide a simple and general approach of determining the diffusion coefficient for diffusion through porous media, we have introduced mass release curves as the constitutive curves of diffusion. The mass release curve for a selected direction represents cumulative mass (per surface area) passed in that direction through a small reference volume, in terms of time. We have developed a methodology, based on numerical Finite Element (FE) and Molecular Dynamics (MD) methods, to determine simple mass release curves of solutes through complex media from which we calculate the diffusion coefficient. The diffusion models take into account interactions between solute particles and microstructural surfaces, as well as hydrophobicity (partitioning). We illustrate the effectiveness of our approach on several examples of complex composite media, including an imaging-based analysis of diffusion through pancreatic cancer tissue. The presented work offers an insight into the role of mass release curves in describing diffusion through porous media in general, and further in case of complex composite media such as biological tissue.
Keywords: diffusion, porous material, biological tissue, mass release curve, equivalent diffusion coefficient, multiscale model, numerical homogenization
1. Introduction
Diffusion as a process of material transport which occurs in soils and porous rocks [1–4], in technological processes [5, 6] and biological systems [7, 8], has been thoroughly investigated. Distribution of transported material (solute) inside the pores, filled with fluid, is defined by the concentration field c(x,t), where x is a spatial position within the continuum and t is time. We consider diffusion governed by the concentration gradient, with the fundamental relation expressed by Fick’s law,
| (1) |
where Ji is the mass flux in direction xi, and Di is the corresponding diffusion coefficient. For practical applications, diffusion coefficients are specified for three orthogonal directions and can have different values. The coefficients Di are the macro-scale constitutive material parameters for diffusion. They reflect the complex micro-scale and atomic processes occurring within the pores which govern motion of solute particles [9–11]. Generally, diffusion coefficients are taken to be functions of the current concentration at a point of the continuum.
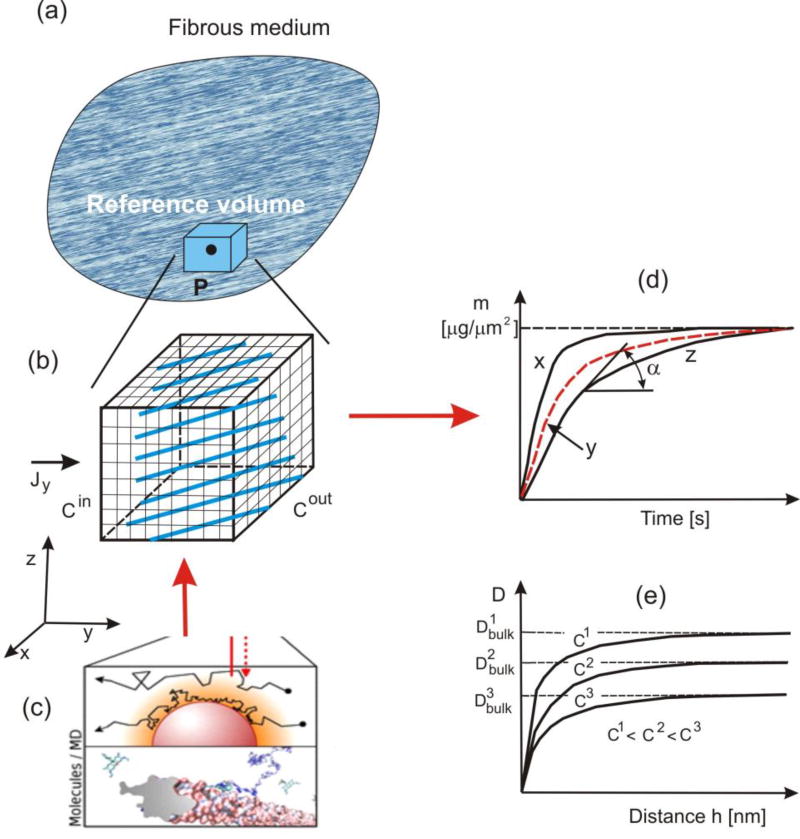
In our further presentation, we will use microscopic models where we model in detail microstructure of the medium, with solids and pores. It is taken that in these models concentration represent the mass of solute per unit volume of pores, and that Fick’s law (1) is applicable, with diffusion coefficients corresponding to diffusion within pore space. The FE integration domain includes the pore space only. Next we define release curves at a material point of a continuum for diffusion through a porous medium (Fig. 1). In order to eliminate the dependence of mass release on the surface size through which the mass is passing, we consider the mass passing through the unit area of the continuum, and call these normalized curves the mass release curves m(t) with dimension, say [M/m2] or [kg/m2]. Hence, at a given time, the rate of the mass release curve represents the mass flux [M/(m2s)]. Now we formulate the following fundamental statement: diffusion properties of a porous medium (as a continuum) are characterized by the mass release curves. These phenomenological curves are also the constitutive curves for determination of the diffusion coefficients. This statement is applicable to “any” complex transport process at lower scales, as long as it results into a diffusion governed by the concentration gradient (more details about the generality are given in the discussion of selected examples). It can be considered that there is a complete analogy between this definition of the mass release curves in diffusion and mechanics, where the stress-strain phenomenological curve represents a result of the complex microstructural deformations. From Fig. 1(d) follows that the tangent to a mass release curve (normalized with respect to the area) geometrically determines the mass flux at a considered time,
| (2) |
and then, for a given gradient (dc/dx)i,
| (3) |
Note that dm has dimension mass/(unit area) and dt is time (in seconds), hence tanα is the mass flux in eq. (2), in, say [µg / µm2s].
Fig. 1.
Mass release curves at a point of a continuum determined computationally. (a) Composite medium and small (reference volume RV) around a point P. (b) Schematics of microstructure and FE model for diffusion, with boundary conditions. (c) Molecular dynamics (MD) schematics of calculation of the effective diffusion coefficient. (d) Mass release curves obtained using FE model of RV, normalized to the inlet/outlet surface area, in, say, [µg/µm2]. (e) Change of diffusion coefficient with the distance from solid surface for three concentrations (distance is of nanometer size; Dbulk is diffusion coefficient far from surface).
The mass release curves can be determined numerically [10], or experimentally: in [3] and [4] experiments were performed in which the mass flux from a sample of porous rock was measured and diffusion coefficients calculated, while in [12] mass release was measured from a drug delivery system. Mass release constitutive curves have an additional important property with respect to traditional approaches of calculation of the equivalent diffusion coefficients [13–17]: they provide information about the diffusion characteristics over a selected range of concentration, rather than for one concentration value.
The aim of this work is to introduce mass release curves for any porous medium and then to show that they can be used for diffusive transport of molecules through biological tissue composed of cells and extracellular space, with the emphasis to the problems of drug transport within tumors. The extracellular space is a porous medium filled with biological liquid, with fibers and various proteins as solids, while cells are bounded by membranes with specific transport properties. Biochemical interactions between transported molecules and solids are incorporated through surface effect and partitioning as a measure of hydrophobicity.
Before presenting a numerical procedure for calculation of mass release curves (and consequently the diffusion coefficients), we notify that evaluation of the diffusion coefficients of a porous medium has been carried out by homogenization procedures, mainly in analytical form, or numerically [18, 19]. Generally, such procedures have limitations due to special assumptions regarding microstructure (e.g. periodicity, scale separation), and also because they rely on various asymptotic expansions and analytic forms [14, 20–27]. Implementation of these procedures to various porous media is given in [13–16, 28, 29] and to biological media in [30–40]. These procedures are not readily generalizable.
2. Computational procedure
In Fig. 1 we schematically illustrate our general concept of how the mass release curves can be determined numerically. We select a small volume (infinitesimal with respect to the diffusion domain, but finite in size and large enough to appropriately represent the microstructure) surrounding a material point, and discretize the space by finite elements. It is possible to have a detailed FE mesh such that it captures the internal microstructural geometry very closely (Fig. 1(b)). For generality, we assume that physico-chemical interactions occur between diffusing particles and surfaces of internal microstructure. To account for these interactions, we use MD (schematics shown in Fig. 1(c)) to evaluate the effective diffusion coefficient as a function of concentration and distance from the solid surface (Fig. 1(e)).
Here, it is worth mentioning that diffusion at the microscale, which is captured by MD simulations, shows deviations from classical Fickian behavior. The interactions of diffusion molecules with the surroundings at the interface of solids lead to reduced diffusivity [9, 41, 42], which was also confirmed experimentally [43, 44]. The consequence of this non-Fickian behavior of molecules at microscale was recognized as the cause of mass release deviations from the expected Fickian behavior [10, 42, 45, 46]. By using our current methodology and concepts, we were able to rationalize Fickian and non-Fickian transport in nanoconfined diffusion transport [11].
Diffusion coefficients can be calculated in the local coordinates system ξ, η, ζ of a solid surface, where the first local axis is normal to the surface and the other two lie in the tangential surface plane. These local diffusion coefficients Dξ, Dη, Dζ can be transformed to the global system [47],
| (4) |
where T is the transformation matrix containing cosines of angles between local and global (x,y,z) coordinate system. Hence, Eq. (4) gives the spatial field of the diffusion tensor. Boundary conditions are as follows: it is assumed that concentrations at the inlet and outlet surfaces, Cin and Cout, are prescribed functions of time. The simplest practical approach is to change these concentrations in a way that the difference Cin(t) − Cout(t) is kept constant, hence the concentration gradient [Cin(t) − Cout(t)]/Li remains constant; here Li is the length in the direction of diffusion of the reference volume (RV). The curve m(t) represents the mass release normalized to the inlet/outlet surface area of RV (see Fig. 1(d) and caption of Fig. 1).
Regarding the computation, in case of evaluating diffusion coefficient with the surface interaction effects within the microstructure, we performed MD simulations [10] using NAMD 2.6 [48] with a TIP3P water model [49] and NVT ensembles, with CHARMM compatible force field [50]. The mean square displacement <r2>, <r2>=<|r(t)−r(0)|2>, of molecules were calculated along the surface normal and in the tangential plane. The diffusion coefficients D was calculated from the averaged <r2> slope in an appropriate time window (e.g. 20 ps window for t ~ 5–20 ps), as:
| (5) |
D values, as a function of distance from solid surface, were fitted with the function y=a(1−exp(−bx2)).
For the continuum, we solve the fundamental mass conservation equation, which includes Fick’s law (Eq. (1)),
| (6) |
where c is concentration and qV is a source term; and i=1,2,3 denote Cartesian coordinates. This equation is transformed into the FE incremental equation of balance [51]
| (7) |
where CJ and ΔCJ are nodal concentrations and increments of concentrations, CtJ is the nodal concentration at the start of time step, Δt is the time step size, and i represents the equilibrium iteration counter; and are the element external and volumetric nodal fluxes, respectively; expressions for the diffusion matrix KIJ, updated over iterations, and the “mass” matrix MIJ are given elsewhere [51]. The expressions for the matrices KIJ and MIJ are:
| (8) |
where NI are interpolation functions, and V is the finite element volume. Note that the coefficients Di can be concentration dependent, i. e. Di= Di(c), as in Fig. 1(e) (see also caption of Fig. 1).
In our incremental-iterative scheme we always have adopted implicit scheme, i.e. we use variable parameters, such as diffusion coefficient, corresponding to the end of time step and the last computed value: for the iteration ‘i’. The implicit scheme provides the best accuracy of solution and suppress error propagation [52]. Also, the meshes used for detailed models in order to calculate mass release curves are very fine due to complexity of the microstrures, and the solution accuracy has been tested using different meshes. On the other hand, our methodology has been verified by comparing with experiments (Refs. [10] and [47]); the mass release curves obtained by detailed models and with using the equivalent diffusion coefficients are practically the same.
We next summarize a computational scheme for taking into account the phenomenon known as partitioning. It occurs when transported particles display hydrophobicity with respect to certain solvents, as, for example in case of drug molecules which are hydrophobic and prefer organic phase over water [53, 54]. Then, the transport law based on concentration gradient is violated. It is well known that partitioning phenomenon has a thermodynamic origin [55]. The partitioning coefficient P as the material parameter is defined phenomenologically as:
| (9) |
where Coil is the concentration of molecules in oil, and Cwater is the concentration in water, at the oil-water interface. In practice, partitioning of molecules is tested in octanol-1/water system and is expressed by a logarithm of P, logP. The logP is a common property of drug molecules used to characterize hydrophobicity of compounds. The partitioning effects within the FE computational scheme can be included as follows [53]. Namely, the ratio between the number of particles passing the boundary between two media during a time step is a constant P,
| (10) |
where ΔNs and ΔNf are the numbers at the two sides, and, consequently, the same ratio is applicable to the concentration increments, ΔCs and ΔCf:
| (11) |
where, p=1/P is used because it is computationally more convenient. The relation (10) is further used to accordingly modify the matrices on the left side and nodal vectors on the right side of equation (7), for nodes at the interface between two media, before assembling equation (7) into the global system of balance for the entire diffusion domain. In case that at a node J there is the partitioning effect, factorization by a p-value is as follows. The modified terms of the left-hand side matrix in (7) is
| (12) |
while the modified right hand side of (7) is calculated using
| (13) |
We define the diffusion coefficient for a reference volume (RV) according to Fick’s law. It can be calculated for a current time step, i.e. for the current concentration, as
| (14) |
where Δm is the increment of mass release over the time step Δt. We solve Eq. (7) under steady-state conditions to avoid transient effects. With the calculated diffusion coefficients we model a homogenous continuum under the same boundary conditions and find that the mass release curves are the same; therefore, the calculated diffusion coefficients provide the same diffusion properties of the true porous medium (with diffusion through the pores within microstructure) and the equivalent homogenous continuum in the considered small volume RV. Mass release curves, and the diffusion coefficients, can be obtained for three orthogonal directions, hence anisotropic diffusion parameters can be determined too. Calculated for various points within the diffusion domain, the mass release curves capture non-homogeneity of the medium.
3. Numerical examples
We first present three examples which demonstrate that the mass release curves are the constitutive curves, i.e. the diffusion parameters computed from these curves only depend on material properties of the solvent and solute, porosity, interactions between the solute particles and microstructure, including effects such as hydrophobicity, and on internal microstructural geometry. The last example represents implementation of mass release curves to model diffusive transport through tumor tissue of a pancreatic cancer. All examples are solved using our FE program PAK [56] where the described approach of numerical homogenization is incorporated. We have included data for each model at the figure caption to show that very fine meshes are required to capture complex internal geometry.
1. Porous medium with spheres as microstructure
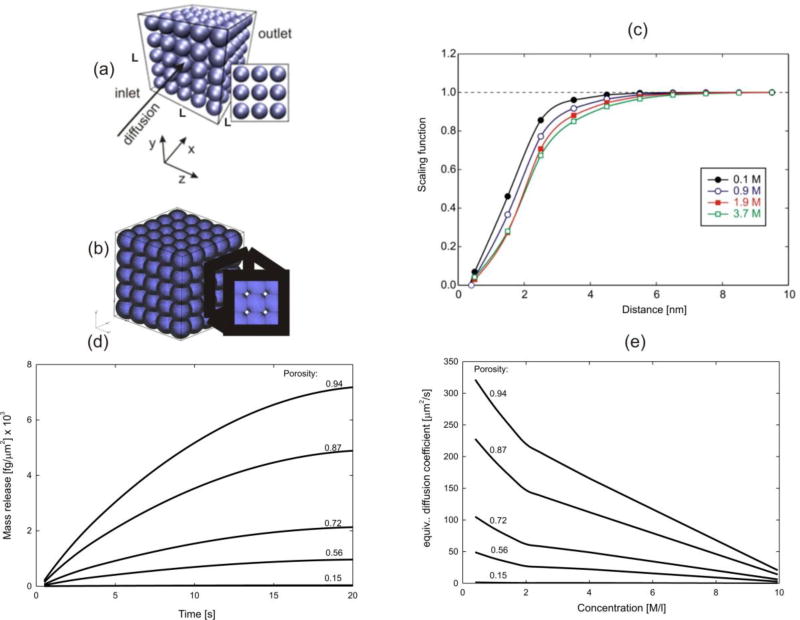
We consider a porous medium with microstructure composed of silica nanospheres, with diffusion of glucose molecules through water. The silica-glucose interactions and diffusion coefficients were evaluated using the MD modeling and the scaling functions are obtained (Fig. 2 (c)) [9–11, 42], where glucose-silica interactions realize reversible binding [9]. It is taken that the bulk diffusion coefficient, Dbulk, corresponding to free diffusion in water, linearly changes with concentration: c=0M, Dbulk= 690µm2/s, and c=10M, Dbulk=50 µm2/s. The mass release curves and equivalent diffusion coefficients are given in Figs. 2(c) and 2(e) for several porosities. Note that there are two slopes in the curves in Fig. 2(e). This is due to changes between scaling functions with concentration in Fig. 2(c); for concentrations lower than 3.7M we interpolate values of scaling functions among the curves, while after concentration greater than (or equal) 3.7M we use the lowest curve in the figure. The purpose of this example is to include small porosities with the small pore size and diffusion termed as anomalous [11].
Fig. 2.
Mass release curve for diffusion of glucose molecules through porous medium with silica spheres as solids [47]. (a) Larger porosity. (b) Small porosity of 15% and complex geometry of pores. (c) Scaling functions for glucose-silica interaction; diffusion coefficient is D(h,c)=f Dbulk, where h is distance from solid surface and f is the scaling function. (d) Mass release curves for several porosities. (e) Equivalent diffusion coefficient in terms of concentration. Model size: 125,000 3D finite elements, 132,651 nodes.
2. Diffusion through agarose polymer gel
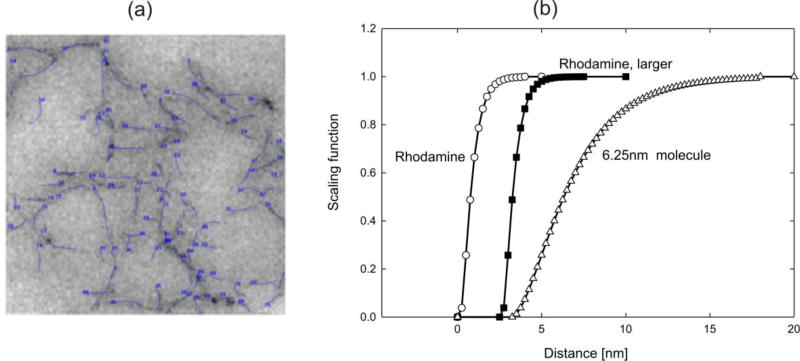
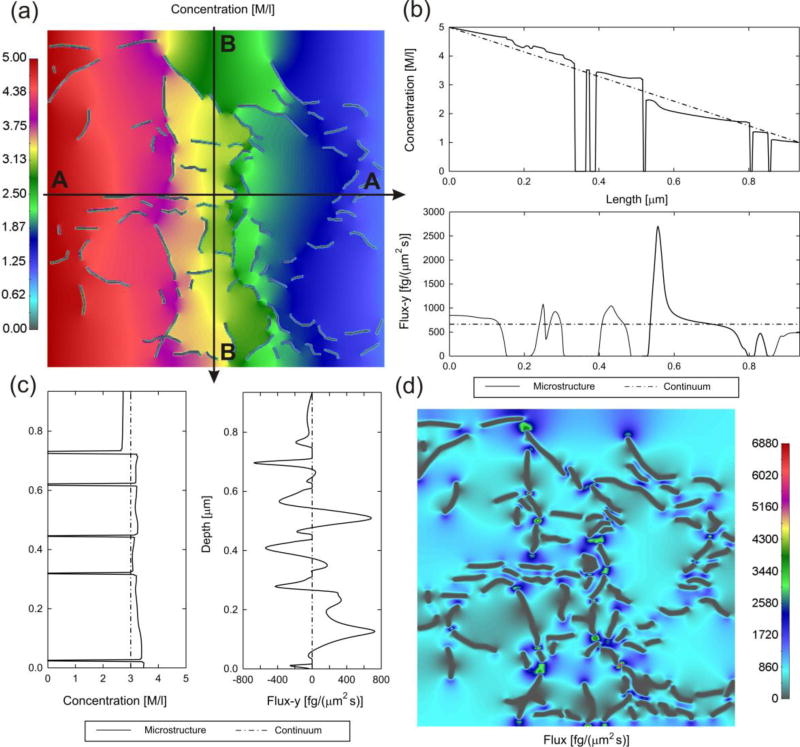
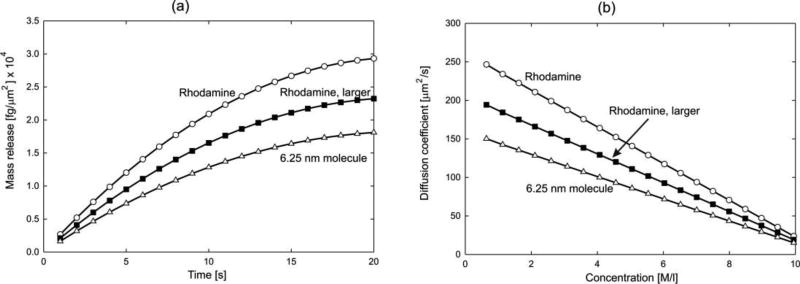
Here, diffusion of rhodamine 6G (R6G) molecules through an agarose polymer gel is modeled. The internal structure of the gel, obtained by imaging [57], is shown in Fig. 3(a) with discretized agarose fibers and porosity of 97%. We have taken three molecules to diffuse: Rhodamine (diameter d= 0.5 nm), a larger size Rhodamine (interactions like for Rhodamine; d= 5 nm) and a particle of size 6.25nm. Scaling functions are shown in Fig. 3(b). The 6.25nm particle is used to emphasize effects of the molecule size. Namely, the molecule cannot pass through a pore smaller than 6.25nm and concentration in that pore is equal to zero. It is taken a linear dependence of the bulk diffusion coefficient on concentration: c=0, Dbulk= 286 µm2/s; c=10M, Dbulk = 50µm2/s. The size of the RV (0,934 × 0.934 µm) is large enough so that the overall characteristics are the same in the two directions. Solutions for concentration and mass flux are shown in Fig. 4, while the mass release curves and equivalent diffusion coefficients are displayed in Fig. 5. The mass release curves are continuous, while the true distribution of fluxes are highly irregular, affected not only by chemical interactions, but also by the molecule size; this observation is of particular importance in diffusion through complex porous media as rocks ([3, 4]) Accuracy of the prediction of the mass release using the equivalent diffusion coefficient was verified experimentally [47].
Fig. 3.
Agarose polymer gel model-1. (a) The internal structure obtained by imaging, and computational model of fibers (according to Ref. [47]). (b) Scaling functions for three molecules. Model size: 90,000 2D finite elements, 90,601 nodes.
Fig. 4.
Agarose polymer gel model-2, with flux in x direction (AA) due to prescribed concentration difference between left and right boundary of the model (according to Ref. [47]). (a) Distribution of concentration at time t=1s, microstructural model; zero-values correspond to fibers. (b) Distribution of concentration and mass flux-x along line AA, microstructural (full line) and continuum (dashed) solution. (c) Distribution of concentration and mass flux-y along line BB, microstructural (full line) and continuum (dashed) solution. (d) Mass flux-x distribution at time t= 1s. Molecule of 6.25nm, linear dependence of bulk diffusion coefficient within gel.
Fig. 5.
Agarose polymer gel model-3. (a) Mass release curves. (b) Equivalent diffusion coefficient.
3. A simplified model of drug transport through tissue
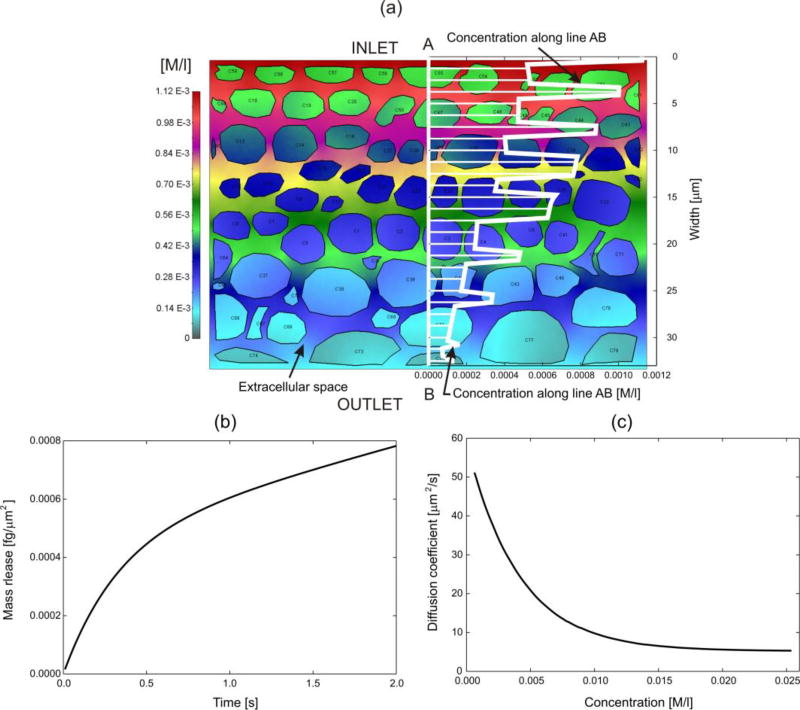
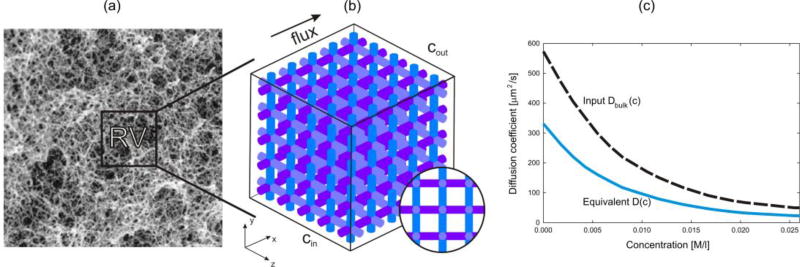
We have selected a tissue domain (2D RV model) with a typical cell shapes and distribution as shown in Fig. 6(a). The cell membrane is considered as a biological barrier, with partitioning properties between membrane and extracellular space with respect to a drug (here doxorubicin). Extracellular space is a complex fibrous porous medium, with extracellular matrix and other solid entities as proteins (Fig. 7(a)).
Fig. 6.
Reference volume for a typical composition of tissue. The domain includes extracellular space, cell membranes and cell interior. Boundary conditions: Concentrations at inlet outlet are increased from zero to 1M with small concentration gradient, while there is no flux though lateral surfaces. (a) Concentration field in the RV and graph of concentration along a line AB. (b) Mass release curve. (c) Diffusion coefficient for the equivalent homogenous continuum. Model size: 34,000 2D finite elements, 1684 fictitious 1D element, 34,281 nodes.
Fig. 7.
Extracellular space of skin. (a) Fibrous structure according to [60]. (b) A simplified RV model. (c) Diffusion coefficient for free diffusion in the liquid (Dbulk) and equivalent diffusion coefficient. Model size: 125,000 3D finite elements, 132,651 nodes.
The computational RV model includes extracellular domain, cell membranes and intracellular space. Diffusion coefficient for the extracellular space was calculated from the mass release curve (not shown) of the RV (Figs. 7(a,b)), is given in Fig. 7(c); in this calculation, chemical interactions between diffusing molecules (DOX) and fibrous structure was included using the corresponding scaling functions (MD models). Diffusion through cell membrane was modeled by employing fictitious 1D elements [58], which take into account diffusive properties of the membrane. Also, hydrophobicity at the cell membrane was included by partitioning parameter (here taken P=10), which imposes a discontinuous concentration field (as in [59]); the discontinuity can be seen from the graph in Fig. 6(a). It is assumed that the cell interior is a homogenous medium with diffusion coefficient 0.1µm2/s. Results for the tissue model are shown in Figs. 6 (b), (c).
4. Diffusion in pancreatic tumor
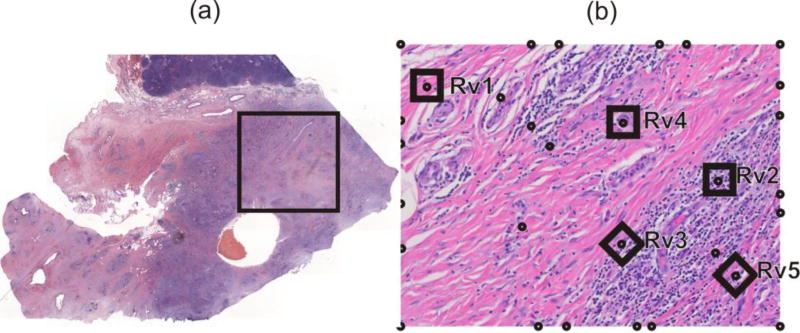
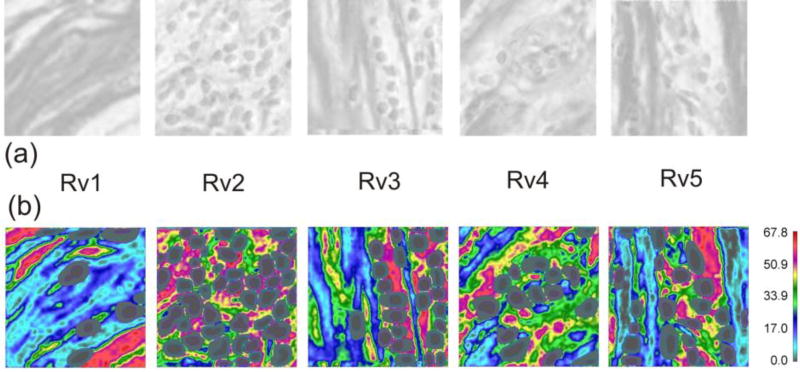
Here we implement the mass release curves to model diffusive transport within a pancreatic tumor. Data are obtained from a patient who underwent resection of a localized adenocarcinoma of the pancreas under an Institutional Review Board approved protocol [61], and we used to establish only a realistic domain of transport. We have taken a typical Hematoxylin and Eosin image of the pancreatic tumor taken at 4× (Fig. 8a) and consider 2D diffusion within a selected domain at 40× magnification (Fig.8b) of three molecules: oxygen (O2), a small molecule and a protein. Some of the reference volumes modeled in detail are shown as (RV1-RV5), while the others denoted by circles are used for interpolation of material parameters in the entire domain.
Fig. 8.
Image of a cross-section of pancreatic tumor. (a) Image with the selected domain for computational model. (b) The selected domain with collagen stained in red color, while cell nuclei are in dark. Five reference volumes (RV1-RV5) are modeled to determine mass release curves and equivalent diffusion coefficients. Small circles indicate points used for interpolation of equivalent diffusion coefficients.
Estimation of diffusion coefficients within the RVs is performed according to 8-bit grayscale data file for collagen density created with color deconvolution in Fiji [62]: the darker - the more collagen in that area. Each pixel (px) in 8-bit files has values in the range 0 (black) – 255 (white). The darkest areas in these figures are at 180 and brightest at 255, Fig. 9a. We have re-scaled the linearly a nominal diffusion coefficient (D255) of extracellular space by collagen content and the results are shown in Table 1, while the field of diffusion coefficient for protein molecule is displayed in Fig. 9b. The diffusion coefficients were estimated based on representative values [63]. Partitioning coefficients have arbitrary values to simulate complexity, but they still correspond to a realistic example because some drug, like doxorubicin, accumulates in cell nuclei [64].
Fig. 9.
(a) Collagen presence in reference volumes RV1-RV5. (b) Computed field of diffusion coefficient for protein. Model size: minimum size model RV1-48,474 2D elements, 952 fictitious 1D elements, 49,665 nodes; maximum size model RV2-196,048 2D elements, 3,846 fictitious 1D elements, 200,769 nodes.
Table 1.
Diffusion coefficient [µm2/s] calculated from collagen content, and partitioning coefficient used for RV modeling. D255 - diffusion in water-like media, aka nominal, and D180 - diffusion across fibers.
| / | Extracellular space | Cell membrane | Cytoplasm | Nucleus | |||
|---|---|---|---|---|---|---|---|
| D255 | D180 | Partitioning | DMem [µm/s] | DCell | Partitioning | DNucleus | |
| O2 | 2000 | 200 | 1 | 20000 | 400 | 1 | 2000 |
| Small molecule | 100 | 0.1 | 100 | 1000 | 10 | 10 | 10 |
| Protein | 70 | 7 E-5 | 1 | 700 | 0.7 | 0 | 0 |
Cells are modeled using diffusion within cell and within nucleus as a separate domain. Also, transport through cell and nucleus membranes are computed using membrane transport coefficients DMem, with unit [µm/s], since it relates the flux through membrane (unit [µg/(µm2s)]) and difference in concentration at the membrane sides (unit [µg/µm3]), and partitioning, with data given in Table 1.
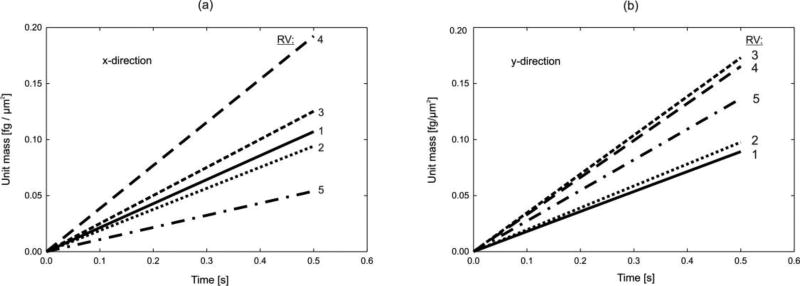
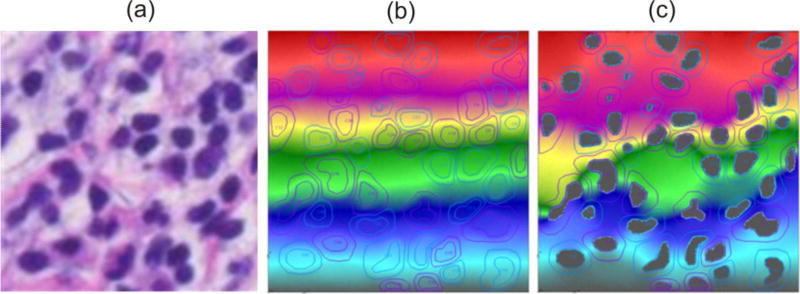
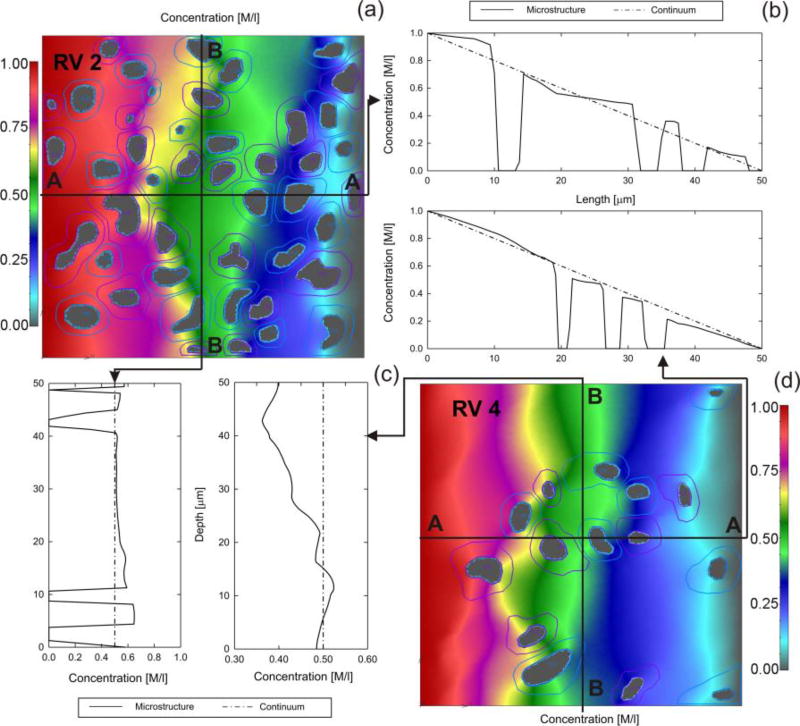
Mass release curves are calculated for the RVs and are shown in Fig. 10. The curves are straight lines since diffusion coefficients and partitioning do not depend on concentration, but they are different in the x- and y-direction, and different among RVs due to difference in the RV composition. We used concentration equal 1 on one side and zero at the opposite side (with no diffusion through lateral boundaries). Concentration distributions within the RV2 are shown in Fig. 11 for oxygen and protein molecule. The emphasis of this figure is to show that there is a significant difference in concentrations because diffusion coefficient within nuclei for protein is very small with high partitioning at the nucleus membrane. Detailed concentration distributions within two RVs are shown in Fig. 12. As in case of other examples, concentration distribution is very irregular, while the equivalent model has a constant concentration gradient. Equivalent diffusion coefficients for the RVs are given in Table 2. A notable difference can be seen between diffusion coefficients among RVs and between values for x- and y-direction.
Fig. 10.
Mass release curves (normalized to the volume of RV) for x and y direction for five RVs.
Fig. 11.
Concentration field within RV 2 at time t=1s. (a) Image of the RV. (b) Small molecule. (c) Protein molecule.
Fig. 12.
(a) and (d) Concentration field at time t=1s for RV2 and RV4. (b) Distribution of concentration along x-direction, and (c) along y-direction. Microstructural (full line) and equivalent continuum (dashed) solution.
Table 2.
Equivalent diffusion coefficient for each RV obtained using mass release curves
| Molecule \ RV | RV1 | RV2 | RV3 | RV4 | RV5 | |
|---|---|---|---|---|---|---|
| O2 | Dx [µm2/s] | 624.79 | 887.89 | 797.27 | 867.19 | 602.71 |
| Dy [µm2/s] | 585.00 | 884.40 | 856.56 | 852.39 | 764.58 | |
| Small molecule | Dx [µm2/s] | 20.715 | 34.034 | 30.229 | 34.926 | 13.846 |
| Dy [µm2/s] | 18.215 | 32.000 | 34.436 | 33.637 | 29.368 | |
| Protein | Dx [µm2/s] | 10.708 | 9.417 | 12.528 | 19.229 | 5.398 |
| Dy [µm2/s] | 8.911 | 9.763 | 17.302 | 16.531 | 13.655 | |
| Cell Fraction | [%] | 14.61 | 54.49 | 29.49 | 23.41 | 28.65 |
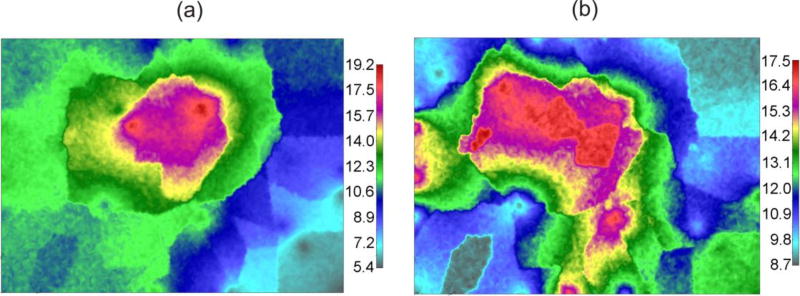
We have interpolated values for the equivalent diffusion coefficients Dx and Dy from the RV results and used additional points which have close structures with the selected five RVs (denoted by circles in Fig. 8b). The interpolated fields of the Dx and Dy are shown in Fig. 13 for the entire domain, for the protein molecule. A significant variation of Dx and Dy is the result of very heterogenous composition of the tumor tissue. Finally, the concentration field for the entire domain is shown in Fig. 14. It can be seen a non-symmetric and non- homogenous character to a certain extent.
Fig. 13.
Diffusion coefficient field for protein molecule, in [µm2/s]. (a) X-direction (DXmax = 19.2, DXmin = 5.4). (b) Y-direction (DYmax = 17.5, DYmin = 8.7). Model size: 35,418 2D elements, 35,418 nodes.
Fig. 14.
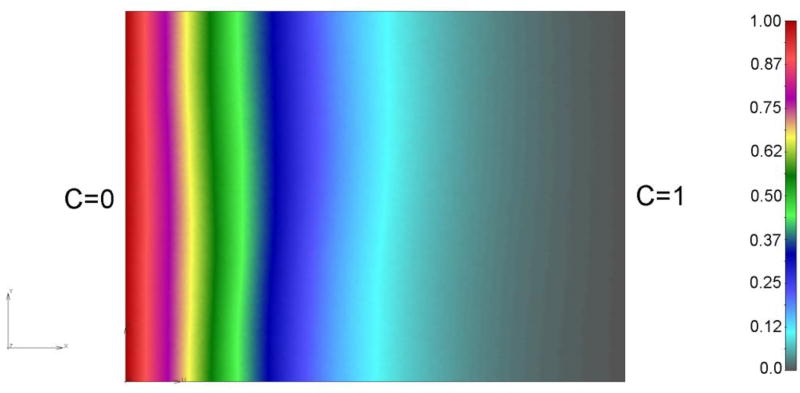
Concentration distribution of the Small molecule in the selected domain of tumor at time t=1s. Concentration is prescribed at two boundaries, while the other two are impermeable.
4. Concluding remarks
In summary, we have shown that the mass release curves can be used as the material characteristic for diffusion through a porous medium. These curves are the constitutive curves for diffusion coefficients of porous media considered as a continuum. Examples are selected to demonstrate that the role of the mass release curves is applicable to “any” transport process in the lower scales, as long as it results in diffusion on the continuum level which is governed by the concentration gradient. This role of the mass release curves and possible limitations of applicability can be further investigated in view of other mathematical formulations of diffusion, such as based on fractional diffusion equation approach [65–67], in case of coupling diffusion with convective transport [59, 68]; or, when considering different time and length scales (a review of experimental investigations is given in [69]). The first example includes conditions in pores which can be termed as anomalous diffusion; the second example considers not only chemical interactions particle-microstructure but also the particle size; the third example includes hydrophobicity effects; and the last example represents the application of mass release curves to model molecular transport within a tumor (pancreatic tumor, data obtained by imaging). Mass release curves can be determined experimentally and may include conditions within microstructure which can hardly be expressed analytically. This description of diffusion through porous media offers a new insight into the diffusion process within complex microstructures, like soil, biological tissues or any other heterogeneous or simple porous medium.
Acknowledgments
The authors acknowledge the Texas Advanced Computing Center (TACC) at The University of Texas at Austin for providing HPC resources that have contributed to the research results reported within this paper. This project has been partially supported with the Methodist Research Institute, by the grants OI 174028 and III 41007 of the Serbian Ministry of Education and Science, and City of Kragujevac - Serbia. Authors also acknowledge partial supports from the following funding sources: the Ernest Cockrell Jr. Distinguished Endowed Chair (M.F.), US Department of Defense (W81XWH-09-1-0212) (M.F.), National Institute of Health (U54CA143837, U54CA151668) (M.F.).
References
- 1.Boving TB, Grathwohl P. Tracer diffusion coefficients in sedimentary rocks: correlation to porosity and hydraulic conductivity. J. Contam. Hydrol. 2001;53(1–2):85–100. doi: 10.1016/s0169-7722(01)00138-3. [DOI] [PubMed] [Google Scholar]
- 2.Zhang H, Selim HM. Second-order modeling of arsenite transport in soils. J. Contam. Hydrol. 2011;126:121–129. doi: 10.1016/j.jconhyd.2011.08.002. [DOI] [PubMed] [Google Scholar]
- 3.Patriarche D, et al. Diffusion as the main process for mass transport in very low water content argillites: 1. Chloride as a natural tracer for mass transport—Diffusion coefficient and concentration measurements in interstitial water. Water Resources Research. 2004;40(W01516):1–19. [Google Scholar]
- 4.Patriarche D, et al. Diffusion as the main process for mass transport in very low water content argillites: 2. Fluid flow and mass transport modeling. Water Resources Research. 2004;40(W01517):1–15. [Google Scholar]
- 5.Cao H, Y Z, Wang J, Tegenfeldt J, Austin R, Chen E, Wu W, Chou S. Fabrication of 10 nm enclosed nanofluidic channels. Applied Physics Letters. 2002;81 [Google Scholar]
- 6.Gardeniers H, Berg A. Micro-and nanofluidic devices for environmental and biomedical applications. Int. J. Envir. Analyt. Chemistry. 2004;84(11):809–819. [Google Scholar]
- 7.Desai TA, et al. Nanopore technology for biomedical applications. Biomed. Microdev. 1999;2(1):11–40. [Google Scholar]
- 8.Alber F, et al. Determining the architectures of macromolecular assemblies. Nature. 2007;450(7170):683–694. doi: 10.1038/nature06404. [DOI] [PubMed] [Google Scholar]
- 9.Ziemys A, et al. Confinement Effects on Monosaccharide Transport in Nanochannels. The Journal of Physical Chemistry B. 2010;114(34):11117–11126. doi: 10.1021/jp103519d. [DOI] [PubMed] [Google Scholar]
- 10.Ziemys A, et al. Hierarchical modeling of diffusive transport through nanochannels by coupling molecular dynamics with finite element method. Journal of Computational Physics. 2011;230(14):5722–5731. [Google Scholar]
- 11.Ziemys A, et al. Interfacial effects on nanoconfined diffusive mass transport regimes. Physical Review Letters. 2012;108(23):5. doi: 10.1103/PhysRevLett.108.236102. [DOI] [PMC free article] [PubMed] [Google Scholar]
- 12.Lassalle V, Ferreira ML. PLGA based drug delivery systems (DDS) for the sustained release of insulin: insight into the protein/polyester interactions and the insulin release behavior. J. Chem. Technol. Biotechnol. 2010;85:1588–1596. [Google Scholar]
- 13.Sangani AS. An application of an homogenization method to a model of diffusion in glassy polymers. J. Polymer Sc: Part B: Polymer Physics. 1986;24:563–575. [Google Scholar]
- 14.Auriault J-L, Lewandowska J. Effective diffusion coefficient: from homogenization to experiment. Transp. Porous Media. 1997;27(2):205–223. [Google Scholar]
- 15.Boutin C, Geindreau C. Periodic homogenization and consistent estimates of transport parameters through sphere and polyhedron packings in the whole porosity range. Physical Review E. 2010;82:036313, 1–18. doi: 10.1103/PhysRevE.82.036313. [DOI] [PubMed] [Google Scholar]
- 16.Eitelberger J, Hofstetter K. Prediction of transport properties of wood below the fiber saturation point – A multiscale homogenization approach and its experimental validation. Part II: Steady state moisture diffusion coefficient. Composites Sci. Technology. 2011;71:145–151. [Google Scholar]
- 17.Vassal J-P, et al. Upscaling the diffusion equations in particulate media made of highly conductive particles. II. Application to fibrous materials. Physical Review E. 2008;77(1):011303. doi: 10.1103/PhysRevE.77.011303. [DOI] [PubMed] [Google Scholar]
- 18.Larsson F, Runesson K, Su F. Variationally consistent computational homogenization of transient heat flow. Int. J. Numer. Meth. Engng. 2010;81:1659–1686. [Google Scholar]
- 19.Masoud H, Alexeev A. Permeability and diffusion through mechanically deformed random polymer networks. Macromolecules. 2010;43:10117–10122. [Google Scholar]
- 20.Allaire G, Pankratova I, Piatnitski A. Homogenization and concentration for a diffusion equation with large convection in a bounded domain. J. Funct. Anal. 2012;262(1):300–330. [Google Scholar]
- 21.Auriault J-L. Upscaling heterogeneous media by asymptotic expansions. J. Eng. Mechanics. 2002:817–822. [Google Scholar]
- 22.Auriault J-L, Lewandowska J. Homogenization analysis od diffusion and adsorption macrotransport in porous media: macrotransport in the absence of advection. Geotechnique. 1993;43(3):457–469. [Google Scholar]
- 23.Auriault J-L, Lewandowska J. Upscaling: Cell symmetries and scale separation. Transport in Porous Media. 2001;43:473–485. [Google Scholar]
- 24.Benssousan JL, Papanicoulau G. Asymptotic Analysis for Periodic Structures. Amsterdam North-Holland: 1978. [Google Scholar]
- 25.Ferrari M. Composite homogenization via the poly-inclusion approach. Composites Eng. 1994;4(1):37–45. [Google Scholar]
- 26.Hornung U. Homogenization and Porous Media. Berlin: Springer-Verlag; 1997. [Google Scholar]
- 27.Nicolas MO, et al. Simplified methods and a posteriori error estimation for the homogenization of representative volume elements (RVE) Comput. Methods Appl. Mech. Engrg. 1999;176:265–278. [Google Scholar]
- 28.Vassal J-P, et al. Physical Review E. 2008;77:011303, 1–13. doi: 10.1103/PhysRevE.77.011303. [DOI] [PubMed] [Google Scholar]
- 29.Horas JA, Toso JP. Diffusion in glassy polymers: A model using a homogenization method and the effective medium theory. J. Polymer Sci.: Part B Polymer Physics. 1992;30:127–131. [Google Scholar]
- 30.Chen KC, Nicholson C. Changes in brain cell shape create residual extracellular space volume and explain tortuosity behavior during osmotic challenge. PNAS. 2000;97(15):8306–8311. doi: 10.1073/pnas.150338197. [DOI] [PMC free article] [PubMed] [Google Scholar]
- 31.Rohan E. Modeling large-deformation-induced microflow in soft biological tissues. Theor. Comput. Fluid Dyn. 2006;20:251–276. [Google Scholar]
- 32.Shorten PR, Sneyd J. A mathematical analysis of obstructed diffusion within skeletal muscle. Bioph. Journal. 2009;96:4764–4778. doi: 10.1016/j.bpj.2009.02.060. [DOI] [PMC free article] [PubMed] [Google Scholar]
- 33.Chapman SJ, Shipley RJ, Jawad R. Multiscale modeling of fluid transport in tumors. Bull. Math. Biology. 2008;70:2334–2357. doi: 10.1007/s11538-008-9349-7. [DOI] [PubMed] [Google Scholar]
- 34.Chen Y, Zhou S, Li Q. Microstructure design of biodegradable scaffold and its effect on tissue regeneration. Biomaterials. 2011;32:5003–5014. doi: 10.1016/j.biomaterials.2011.03.064. [DOI] [PubMed] [Google Scholar]
- 35.Sanz-Herrera JA, Garcia-Aznar JM, Doblare M. A mathematical model for bone tissue regeneration inside a specific type of scaffold. Biomech. Model. Mechanobiol. 2008;7:355–366. doi: 10.1007/s10237-007-0089-7. (A mathematical model for bone tissue regeneration inside a specific type of scaffold) [DOI] [PubMed] [Google Scholar]
- 36.Higgins ER, et al. Modelling calcium microdomains using homogenisation. J. Theor. Biology. 2007;247:623–644. doi: 10.1016/j.jtbi.2007.03.019. [DOI] [PMC free article] [PubMed] [Google Scholar]
- 37.Novak IL, Kraikivski P, Slepchenko BM. Diffusion in cytoplasm: effects of excluded volume due to internal membranes and cytoskeletal structures. Bioph. Journal. 2009;97:758–767. doi: 10.1016/j.bpj.2009.05.036. [DOI] [PMC free article] [PubMed] [Google Scholar]
- 38.Muha I, et al. Effective diffusivity in membranes with tetrakaidekahedral cells and implications for the permeability of human stratum corneum. J. Membrane Science. 2011;368:18–25. [Google Scholar]
- 39.Rim JE, Pinsky PM, Osdol WWv. Using the method of homogenization to calculate the effective diffusivity of the stratum corneum with permeable corneocytes. J. Biomechanics. 2008;41:788–796. doi: 10.1016/j.jbiomech.2007.11.011. [DOI] [PubMed] [Google Scholar]
- 40.Marciniak-Czochra A, Ptashnyk M. Derivation of a macroscopic receptor-based model using homogenization techniques. SIAM J. Math. Anal. 2008;40(1):215–237. [Google Scholar]
- 41.Mahadevan T, et al. Mechanisms of Reduced Solute Diffusivity at Nanoconfined Solid-Liquid Interface. Chemical Physics. 2013 [Google Scholar]
- 42.Ziemys A, Ferrari M, Cavasotto CN. Molecular Modeling of Glucose Diffusivity in Silica Nanochannels. Journal of Nanoscience and Nanotechnology. 2009;9:6349–6359. doi: 10.1166/jnn.2009.1822. [DOI] [PubMed] [Google Scholar]
- 43.Hosoda M, Sakai K, Takagi K. Measurement of anisotropic Brownian motion near an interface by evanescent light-scattering spectroscopy. Physical Review E. 1998;58(5):6275–6280. [Google Scholar]
- 44.Topgaard D, Söderman O. Diffusion of water absorbed in cellulose fibers studied with 1H-NMR. Langmuir. 2001;17(9):2694–2702. [Google Scholar]
- 45.Grattoni A, et al. Gated and Near-Surface Diffusion of Charged Fullerenes in Nanochannels. ACS Nano. 2011 doi: 10.1021/nn2037863. [DOI] [PubMed] [Google Scholar]
- 46.Fine D, et al. A robust nanofluidic membrane with tunable zero-order release for implantable dose specific drug delivery. Lab on a Chip. 2010 doi: 10.1039/c0lc00013b. [DOI] [PubMed] [Google Scholar]
- 47.Kojic M, et al. A multiscale MD–FE model of diffusion in composite media with internal surface interaction based on numerical homogenization procedure. Comput. Methods Appl. Mech. Engrg. 2014;269:123–138. doi: 10.1016/j.cma.2013.11.010. [DOI] [PMC free article] [PubMed] [Google Scholar]
- 48.Phillips JC, et al. Scalable molecular dynamics with NAMD. Journal of computational chemistry. 2005;26(16):1781. doi: 10.1002/jcc.20289. [DOI] [PMC free article] [PubMed] [Google Scholar]
- 49.Jorgensen WL, et al. Comparison of simple potential functions for simulating liquid water. Journal of Chemical Physics. 1983;79(2):926–935. [Google Scholar]
- 50.Cruz-Chu ER, Aksimentiev A, Schulten K. Water-silica force field for simulating nanodevices. J Phys Chem B. 2006;110(43):21497–21508. doi: 10.1021/jp063896o. [DOI] [PMC free article] [PubMed] [Google Scholar]
- 51.Kojic M, et al. Computer Modeling in Bioengineering - Theoretical Background, Examples and Software. Chichester, England: John Wiley and Sons; 2008. [Google Scholar]
- 52.Kojić M, Bathe KJ. Inelastic analysis of solids and structures. Springer Verlag; 2005. [Google Scholar]
- 53.Kojic M, et al. Mass partitioning effects in diffusion transport. Physical Chemistry Chemical Physics. 2015;17(32):20630–20635. doi: 10.1039/c5cp02720a. [DOI] [PMC free article] [PubMed] [Google Scholar]
- 54.Ruiz-Esparza GU, et al. Polymer Nanoparticles Encased in a Cyclodextrin Complex Shell for Potential Site-and Sequence-Specific Drug Release. Advanced Functional Materials. 2014;24(30):4753–4761. [Google Scholar]
- 55.Leo A, Hansch C, Elkins D. Partition coefficients and their uses. Chemical Reviews. 1971;71(6):525–616. [Google Scholar]
- 56.Kojic M, et al. PAK - Finite Element Program for Linear and Nonlinear Analysis, 1998. University of Kragujevac, R&D Center for Bioengineering Kragujevac; Serbia: 2010. [Google Scholar]
- 57.Griess GA, Guiseley KB, Serwer P. The relationship of agarose gel structure to the sieving of spheres during agarose gel electrophoresis. Biophys. Journal. 1993;65:138–148. doi: 10.1016/S0006-3495(93)81072-5. [DOI] [PMC free article] [PubMed] [Google Scholar]
- 58.Kojic M, et al. A multi-scale FE model for convective-diffusive drug transport within tumor and large vascular networks. Comput. Methods Appl. Mech. Engrg. 2015;294:100–122. [Google Scholar]
- 59.Ramirez JM, et al. A generalized Taylor-Aris formula and skew diffusion. Multiscale Model. Simul. 2006;5(3):786–801. [Google Scholar]
- 60.Ma PX, Zhang R. Synthetic nano-scale fibrous extracellular matrix. J. Biomed. Mater. Res. 1998;46:60–72. doi: 10.1002/(sici)1097-4636(199907)46:1<60::aid-jbm7>3.0.co;2-h. [DOI] [PubMed] [Google Scholar]
- 61.Koay EJ, et al. Transport properties of pancreatic cancer describe gemcitabine delivery and response. The J. Clinical Investigation. 2014;124(4):1525–1536. doi: 10.1172/JCI73455. [DOI] [PMC free article] [PubMed] [Google Scholar]
- 62.Schindelin J, et al. Fiji: an open-source platform for biological-image analysis. Nature Methods. 2012;9(7):676–682. doi: 10.1038/nmeth.2019. [DOI] [PMC free article] [PubMed] [Google Scholar]
- 63.Cussler E. Diffusion: Mass transfer in fluid systems. Cambridge Univ Pr; 1997. [Google Scholar]
- 64.Yokoi K, et al. Liposomal doxorubicin extravasation controlled by phenotype-specific transport properties of tumor microenvironment and vascular barrier. Journal of Controlled Release. 2015;217:293–299. doi: 10.1016/j.jconrel.2015.09.044. [DOI] [PMC free article] [PubMed] [Google Scholar]
- 65.O'Shaughnessy B, Procaccia I. Analytical solutions for diffusion on fractal objects. Phys. Rev. Letters. 1985;54(5):455–458. doi: 10.1103/PhysRevLett.54.455. [DOI] [PubMed] [Google Scholar]
- 66.Metzler R, Klafter J. The random walk's guide to anomalous diffusion: A fractional dynamics approach. Physics Reports. 2000;339:1–77. [Google Scholar]
- 67.Wang S, Ma Z, Yao H. Fractal diffusion model used for diffusion in porous material within limited volume of stiff container. Chemical Eng. Science. 2009;64:1318–1325. [Google Scholar]
- 68.Haggerty R, Gorelick SM. Multiple-rate mass transfer for modeling diffusion and surface reactions in media with pore-scale heterogeneity. Water Res. Research. 1995;31(10):2383–2400. [Google Scholar]
- 69.Haggerty R, et al. What controls the apparent timescale of solute mass transfer in aquifers and soils? A comparison of experimental results. Water Res. Research. 2004;40:1–13. [Google Scholar]


