Abstract
Brain Computer Interfaces (BCIs) offer restoration of communication to those with the most severe movement impairments, but performance is not yet ideal. Previous work has demonstrated that latency jitter, the variation in timing of the brain responses, plays a critical role in determining BCI performance.
In this study, we used Classifier-Based Latency Estimation (CBLE) and a wavelet transform to provide information about latency jitter to a second-level classifier. Three second-level classifiers were tested: least squares (LS), step-wise linear discriminant analysis (SWLDA), and support vector machine (SVM). Of these three, LS and SWLDA performed better than the original online classifier. The resulting combination demonstrated improved detection of brain responses for many participants, resulting in better BCI performance. Interestingly, the performance gain was greatest for those individuals for whom the BCI did not work well online, indicating that this method may be most suitable for improving performance of otherwise marginal participants.
Keywords: Brain-Computer Interfaces (BCIs), P300 Speller, Classifier Based Latency Estimation (CBLE)
1. Introduction
Brain-Computer Interfaces (BCIs) use brain signals to provide a direct method of interaction with computers and other devices [1]. BCIs can help to restore communication for people with severe movement impairments such as amyotrophic lateral sclerosis (ALS), neuromuscular disease (NMD), brainstem stroke, cerebral palsy, and spinal cord injury [2]. One of the most common BCI applications is the P300 or P3 Speller indroduced by Farwell and Donchin [3], which uses event-related potentials (ERPs), including the P300 – a positive deflection approximately 300ms post-stimulus. In classical P3 Speller implementations, a grid matrix of 6× 6 or more characters and commands are presented to the user. Subsets of the matrix, usually rows and columns, are flashed in a random order (c.f. [4]). The probability of the flashed row/column containing the target character is 1/6, which creates a rare event that will elicit a P300 response. A classifier can detect those elicited P300 responses and identify target characters [5]. With a few exceptions (e.g. [6, 7]), classifiers must be trained on data from each participant, as all event-related potentials (ERPs) including the P300 are participant-specific.
Researchers have tried different feature extraction and classification methods for the P3 Speller in search of better performance (see e.g. [8]). Early research used step-wise linear discriminant analysis (SWLDA) and showed that SWLDA performed well as a P3 Speller classifier [9, 10, 11]. For the 2003 BCI competition data, support vector machines (SVM) [12, 13] outperformed other classifiers, though the performance was dependent on proper tuning parameters. Other recent works used Bayesian Linear Discriminant Analysis (BLDA) and Fisher’s Linear Discriminant Analysis (FLDA) [14] and Convolutional Neural Network (CNN) [15] for classification. All these above-mentioned works reported some improvement on performance compared with prior studies.
Early research on the P300 found that P300 latency and reaction time varies between people [16, 17]. Magliero found that the latency of the P300 depends on the stimulus evaluation process [18]. These and other studies have shown that P300 latency varies, and that this variation is related to age, cognitive disabilities and other factors [19, 20]. Latency varies within-user, within the same session [21, 22] and even trial to trial [23]. Hence, P300 latency can affect classifier performance and BCI speed [24]. Though P300 latency is an important factor for the P3 Speller, only a few very recent studies have attempted to explicitly calculate or correct for P300 latency. Researchers used Bayesian methods [25] and spatiotemporal filtering methods [26] to estimate properties of single-trial event-related potentials (ERPs), including latency estimates. But, surprisingly only one study has been found in the literature which attempted to correct latency jitter [27], using a maximum-likelihood estimation (MLE) method. In [22], we proposed a classifier-based latency estimation (CBLE) method to estimate the P300 latency. In that work, the latency estimates were primarily used to predict BCI performance from small datasets.
In this study, we used a wavelet transform of the CBLE scores as input features to another classifier, improving overall BCI performance. Like the CBLE method it relies upon, this new technique should be helpful regardless of classifier used. The new technique should dynamically account for latency variation on a per-flash basis, unlike previous work such as [28], which showed improved BCI performance from a static correction for the average latency in different tasks.
2. Experimental Data and Methods
2.1. Data Description
An earlier study by Thompson et al., demonstrated a classifier-based latency estimation technique to estimate and predict BCI accuracy from small datasets [22], which will be discussed later in section 2.3. Some of the data used here were previously reported in [22, 29], and all other data were taken using the same protocol. This protocol involved three separate visits (sessions) for each participant. There are three data files per session, with an additional training file in the first session. This study includes data from all files from sessions one, two and three. Results are shown separately for the average for files from session one and the average for files from sessions two and three combined. The participants included 9 people with ALS, 4 people with NMD, and 20 control participants with no motor impairments. Only people who completed the study are included.
EEG data were collected using a 16-electrode cap from ElectroCap International, with mastoid reference and ground. The electrodes were fixed in the cap at F3, Fz, F4, T7, T8, C3, Cz, C4, Cp3, Cp4, P3, Pz, P4, PO7, PO8, and Oz according to the 10–20 electrode placement system. The data were amplified and digitized at 256 Hz using a g.USBamp (Guger Technologies). Stimulus presentation and recording was controlled through the BCI2000 software platform.
Online classification was performed using least squares (LS). The training file was used to create a participant-specific classifier that was used in all three sessions. A heuristic based on training accuracy was used to set the number of times each row and column flashed (sequences). Each data file contains at least 23 characters of BCI typing; users corrected mistakes using a backspace selection within the BCI, so the number of characters varies between files. For additional details, see [22].
2.2. Classifier Basics and Terminology
Perhaps because classifiers and machine learning techniques have broad application domains, their terminology is not yet perfectly standardized. In this work, we will be discussing three classifiers - Least Squares (LS), Step-Wise Linear Discriminant Analysis (SWLDA), and Support Vector Machine (SVM). Each method is a linear classifier, meaning that it works by taking a weighted sum of the inputs (features). This weighted sum will be called a ”score.” This process is done once per ”observation” or measurement, in our case once per ”flash.” In typical binary classification tasks, the sign function is applied to the score for each observation, in order to estimate the class ”label” - whether the observation in question belongs to the positive or negative class.
The classifiers we use differ primarily in how the weights (which then are used to calculate the score) are chosen. The score, ŷ, is calculated using the following equations [30]:
| (1) |
| (2) |
| (3) |
P3 Spellers are unusual among binary classification tasks, because each row and column is flashed multiple times while the user is trying to produce a single output character. The sign function is therefore not used, and instead the scores (ŷ) for the multiple observations of each row and column are averaged. Then the maximum-scoring row and column are chosen. Note that as these three classifiers are all linear (we used a linear kernel for the SVM), this process is equivalent to averaging the features from multiple observations prior to classification.
2.3. CBLE
Traditional P300 classification uses a single time window locked to the stimulus presentation, for example, the EEG signal 0 to 800 ms post-stimulus [8]. Classifier based latency estimation (CBLE) creates many copies of that time window, each offset by an integral number of amplifier samples; for example, if the sampling rate was 1kHz, one window might be −1 to 799 ms, and another 1 to 801 ms. The ”first-level classifier” (here, LS) is applied to the data in each window, producing a score as described above. Thus, the method produces a vector of scores, with one element per time shift used.
In [22], the time shift that produced the maximum score was used as an estimate for the latency difference between the new P300 response and the average P300 response from training data. The variance of that latency difference estimate on target characters was used to predict BCI performance. The vector of scores was not used directly, although we did note that there are strong differences in the shape of the scores for target and non-target characters. In this work, by contrast, we wanted to use the full vector of scores directly, to aid in detection of the P300 response.
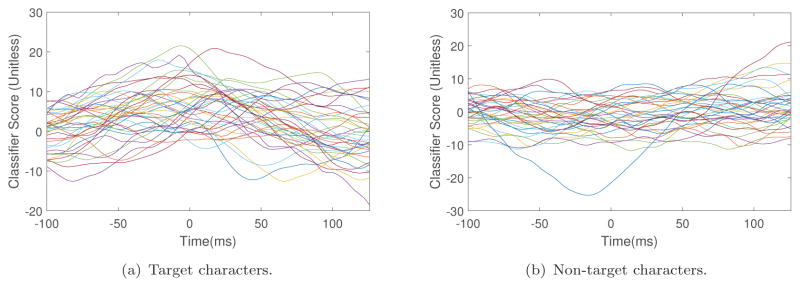
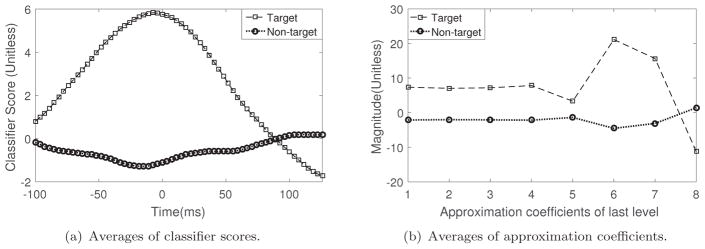
Figure 1 shows the CBLE scores as a function of time shift from a participant with ALS, for several representative flashes. Figure 2(a) shows the average across all flashes, which reflects the overall shape of the responses to target flashes. The CBLE scores from most target flashes show a peak near 0 time shift; different flashes produce different peak times. This is an indication of latency jitter and also shows how latency jitter can affect the P300 classifier performance. For non-target characters there are no visible peaks which is also expected behavior in this paradigm. A few naive approaches were to (i) align all the single-trials based on CBLE and use the aligned trials to train a second-level classifier, (ii) use the CBLE outputs along with the non-aligned trials as extra features for a second-level classifier and (iii) use the CBLE scores alone to train a second-level classifier. We tested each of these approaches on pilot data and found the third approach more useful than the others. However, latency jitter is still visible in the fact that the CBLE scores peak at non-zero time shift; we wanted to reduce the number of features for the end classifier and also reduce the latency jitter. Given the characteristic shape of the CBLE scores for target flashes, we thought a frequency domain transform such as wavelets would be valuable.
Figure 1.
Sample classifier scores as function of time shift of participant K143 (participant with ALS).
Figure 2.
Averages of classifier scores which are shown in Fig. 1(a) & Fig. 1(b) and wavelet approximation coefficient for target and non-target characters.
2.4. Wavelet Transforms
Wavelet transforms are generally used for decomposing signals into multiple time-frequency domains. However, they also can be used for feature reduction. We accomplished both purposes by computing the wavelet approximation coefficients of CBLE scores. For a signal with N – 1 samples, x(t) = {x(1), …, x(N – 1)}, the approximation coefficients can be calculated from equation 4 [31]:
| (4) |
There are many wavelet families; we applied different mother wavelet transformations on session 1 data for several participants, and that found the daubechies-4 mother wavelet, particularly the 5 level wavelet decomposition, produced good results while significantly reducing the number of features. To find the approximation coefficients of last level we used MATLAB default appcoef.m fuction. Figure 2(b) shows the averages of approximation coefficients of CBLE score vectors, for target and non-target flashes.
2.5. Second-level Classifier
Wavelets reduced the dimensionality of the CBLE scores while still showing a difference between target and non-target characters, but a classifier is still needed to make decisions based on the wavelet coefficients. We investigated three classifiers (LS, SWLDA, and SVM) as ”second-level” classifiers, which were given only the wavelet coefficients as input features. The scores from these second-level classifiers were used in the typical P3 Speller fashion - each flash was scored by the second-level classifier, and the scores for each row and column were averaged individually. The row and column with the highest average score was designated as the selected output character. Both first- and second-level classifiers were trained using only the training data file.
2.6. Performance Measurement
Because the goal of this work is improving communication accuracy and speed, a performance metric capturing throughput was chosen. Although Information Transfer Rate is often used for the P3 Speller, we have chosen BCI Utility [32], in line with the suggestions in [33, 34]. BCI Utility is calculated using the formula of equation 5:
| (5) |
Where c is the time per selection, and p is the probability of correctly selecting a symbol or character in the interface. We calculated this probability by assuming it was constant for all characters and within the duration of each file. Backspaces, if required to produce correct text, were counted as correct selections for calculating accuracy. These accuracies were then averaged together if multiple files were used (as an example, if we report average session 1 accuracy).
BCI Utility is a useful metric in that it correctly calculates the rate of corrected characters per unit time. In other words, BCI Utility is a measure of ”corrected typing speed,” or how quickly a person can produce corrected text.
3. Results
Table 1 shows the online accuracies and accuracies after the proposed method for a subset of participants to demonstrate how BCI Utility changes with the change of accuracies. For readability, we limited the table to only participants with ALS as they come from a potential end-user population. Bolded participant identifiers indicate consistent improvement across sessions, which was found for the five of the six participants with online accuracies at or below 90%.
Table 1.
Performance in different sessions for participants with ALS. Bolded participants show consistent improvement.
| participants | K143 | K145 | K146 | K147 | K152 | K155 | K156 | K158 | K160 | |
|---|---|---|---|---|---|---|---|---|---|---|
| Average Accuracy | Online | 91.61 | 58.89 | 96.3 | 95.15 | 90.26 | 59.9 | 93.05 | 88 | 70.57 |
| in Session 1 (%) | Wavelet | 92.85 | 63.33 | 95.37 | 93.86 | 91.34 | 65.2 | 93.05 | 87.97 | 72.5 |
| Corresponding Utility change(%) | 2.97 | 30.77 | −2.00 | −2.84 | 2.67 | 62.69 | 0.00 | −0.08 | 9.4 | |
| Average Accuracy | Online | 92.15 | 77.94 | 89.7 | 88.65 | 50 | 59.09 | 86.98 | 61.91 | 30.08 |
| in Session 2 & 3 (%) | Wavelet | 93.05 | 80.1 | 88.35 | 90.43 | 53.4 | 62.99 | 88.16 | 62.86 | 36.37 |
| Corresponding Utility change(%) | 2.14 | 7.76 | −3.40 | 4.62 | 157.1 | 18.19 | 3.17 | 6.97 | NE1 |
NE: Utility does not exists.
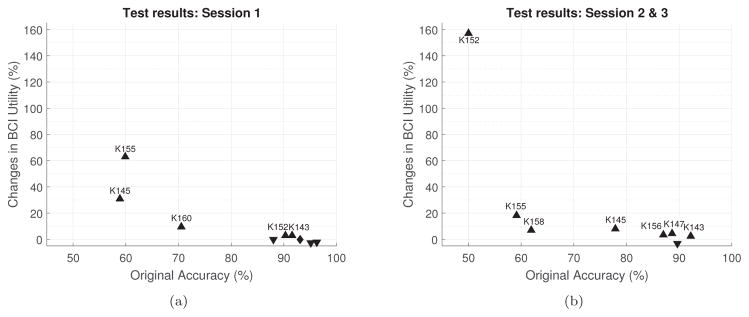
Figure 3 shows the improvement of BCI Utility for participants with amyotrophic lateral sclerosis (ALS) after using the proposed technique. The technique shows greater improvement for participants with lower online accuracy. Improvement of performance is also consistent in other sessions as shown in figure 3(b). Note participant K160 is not plotted in figure 3(b) despite the improvement shown in Table 1 because this participant’s online utility was zero and the percentage change become mathematically undefined. Mean change in BCI Utility in session 1 is 11.5% and in session 2 & 3 is 24.57%.
Figure 3.
Changes in BCI Utility for participants with ALS versus online test accuracy in different sessions. Upper-triangle and lower-triangle indicates the BCI Utility increased and decreased, respectively. The diamond indicates no change. Participant IDs are shown only for improved performance, to allow the reader to assess consistency of improvement.
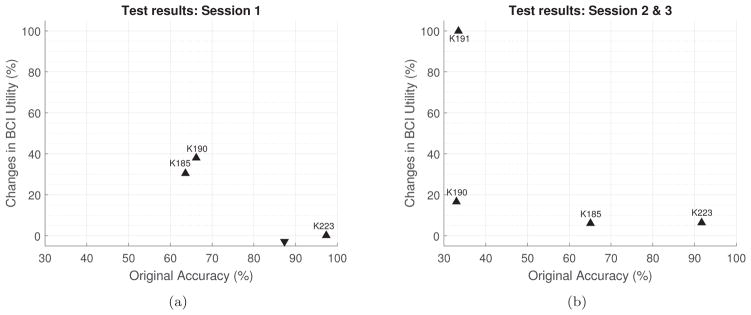
Figure 4 shows the improvement for participants with neuromuscular disease (NMD). Again, larger benefit is shown for individuals with lower online accuracy. In session 2 & 3, the performance improved for all four participants, but are larger in value for lower online accuracies. Mean BCI Utility change for session 1 is 16.35% and for session 2 & 3 is 32.29%.
Figure 4.
Changes in BCI Utility for participants with NMD versus online test accuracy in different sessions. Upper-triangle and lower-triangle indicates the BCI Utility increased and decreased, respectively. Participant IDs are shown only for improved performance, to allow the reader to assess consistency of improvement.
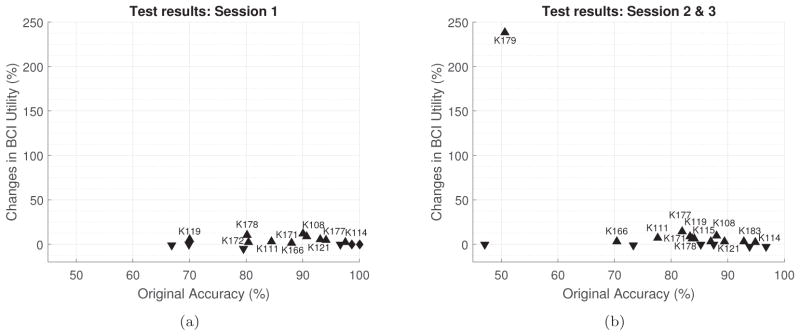
Figure 5 shows the effect of the proposed technique on 21 control participants. Unlike participants with ALS and NMD, there is no obvious pattern. Mean BCI Utility change in session 1 is 2.03% and in session 2 & 3 is 16.59%.
Figure 5.
Changes in BCI Utility for control participants versus online test accuracy in different sessions. Upper-triangle and lower-triangle indicates the BCI Utility increased and decreased, respectively. Diamonds indicate unchanged performance. Participant IDs are shown only for improved performance, to allow the reader to assess consistency of improvement.
Overall we had data from 33 participants. In session 1, 18 participants showed improved performance with the new method, with a mean of 13% increase in BCI Utility. Nine participants showed decreased performance, with a mean decrease of −2.89% in BCI Utility. Five participants had no change in performance. Among these five, one participant had very low online accuracy and the other four had online accuracies around 98%. Overall mean change in BCI Utility for session 1 for all participants is 6.5%.
In session 2 & 3, two participants (K118, K160) had original accuracies of 32% and 30%. While their accuracy improved by 2 and 6 percentage points, neither showed non-zero BCI Utility with or without the new method. Twenty-three additional participants showed increased performance, with mean BCI Utility changes of 27.5%. Seven participants’ performance worsened with a mean of −1.6% utility change. Overall mean of utility changes in session 2 & 3 is 20.75%.
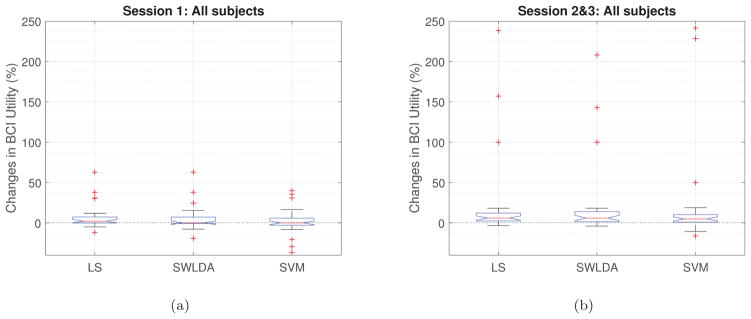
We have also compared the performance of LS, SWLDA and SVM binary classifiers as the second-level classifier. The results are shown in Figure 6. In session 1, both LS and SWLDA classifiers have median change above 0, and first quartile at or very near 0, indicating that approximately 75% of the subjects experienced improvement or at least no decrease. For SVM on session 1, the median is nearer to zero but the quartile is below zero. On session 2 & 3, the box plots are more similar between classifiers.
Figure 6.
Box plots of the BCI Utility changes for LS, SWLDA and SVM on different sessions.
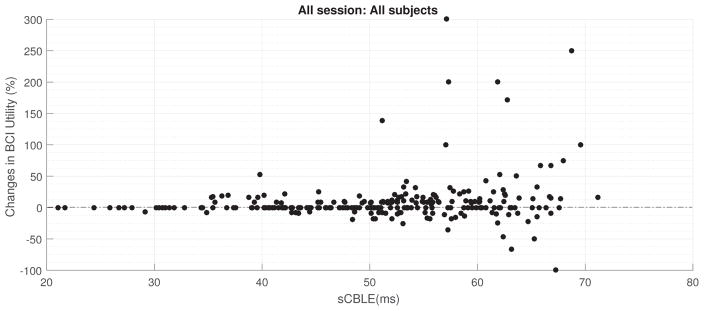
Finally, Figure 7 shows the changes in BCI Utility versus the standard deviation of CBLE-estimated latency for all 288 files. The figure demonstrates that the changes in performance are located at areas with higher estimated latency jitter.
Figure 7.
Changes in BCI Utility versus sCBLE (the standard deviation of CBLE-estimated P300 latency from target flashes).
Here, we have reported data for 32 participants overall. Modeling performance change as a binomial random variable with ”success” being increased performance, the maximum likelihood estimate (MLE) of increased performance probability is 0.67 with 95% confidence interval of [0.54 0.78]. This can be interpreted as the technique being more likely to help than do nothing or decrease performance. Using the two-sided p-value gives us .
If we define success more generously, as improving or at least not changing performance, the MLE is 0.75 with 95% confidence interval of [0.63 0.85]. Two-sided p-value in this case are given by .
4. Discussion
From previous studies, it is obvious that P300 latency varies between individuals, between sessions for the same individual, and most importantly between trials even for the same individual and session [16, 17, 21, 22, 23]. The effect of latency variations between individuals can be compensated by using subject-specific classification, and training on the same day can address some of the between-session variations. But trial-to-trial variations in latency make the classification task difficult and also affect BCI performance. This motivated us to find a technique to correct latency variation and thus minimize the effect of latency jitter on performance. Previously, the classifier-based latency estimation (CBLE) method has been used to predict BCI performance [22]. Here, CBLE-estimated latency has been used to improve BCI performance.
At the beginning of the investigation, we used CBLE-estimated latency to ”correct” for latency jitter on a trial-by-trial basis, and used the corrected trials as the ”second-level” classifier’s features. However, the improvement in performance was not significant enough to merit reporting - without knowledge of the class labels, correcting for latency had the unfortunate effect of maximizing the classifier score for examples that did not contain P300’s, leading in many cases to less separable score distributions. Further investigations using feature reduction techniques, such as wavelet transforms, provided better results. We found that wavelet approximation coefficients of CBLE scores are also different for target and non-target characters (Fig. 2(b)). That findings motivated us to use wavelet approximation coefficients as features for our ”second-level” classifier. For that ”second-level” classifier, we have compared LS, SWLDA and SVM. Though the performance for all three classifiers was almost equal, it is notable that a comparitively simple classification technique, LS, was found to be equally or more effective than SWLDA and SVM. This provides an insight that using better feature transformation methods may give better results even while using simple classification techniques.
The proposed technique appears to be helpful only for participants with lower accuracies and higher estimated latency jitter, which are strongly correlated [22]. The largest improvements were found among participants with ALS and NMD. Part of this is because the BCI Utility metric highlights the importance of relatively small absolute changes in accuracy when the accuracy is low. For example, one participant with ALS had an increase of accuracy of 4.4%, resulting in a 30.76% improvement in BCI Utility. However, BCI Utility is measuring the capability of a person to produce corrected text - in other words, it is an ecologically valid measure of communication throughput. While the accuracy changes are small, for users who struggle with the BCI (accuracies in the 50–70% range), even small changes can show large improvements in usability.
The two-sided p-value we have found demonstrates that the proposed technique statistically improves BCI performance. It should be noted that for some subjects, the performance was already good enough that there was no need or room for improvement in accuracy. In this case, it is desirable that our performance improvement technique would not decrease performance for these individuals. Hence, we have also computed the two-sided p-value for the performance improving or at least not changing the performance. That p-value was also statistically significant and demonstrates that this method is more likely to help or do nothing than to hurt performance.
While the improvements here are not large in magnitude (and not the orders of magnitude of improvement that are necessary to e.g. restore natural speech), it is notable that the improvements are much larger in our pool of participants from potential user populations. The method does not completely compensate for the effects of latency jitter found in [22], and significant improvement is still required beyond this work to bring all users to equal performance.
We believe the power of this method lies in its ability to correct for latency variation. Our previous work has shown that latency variation as measured by CBLE is strongly inversely correlated to BCI performance [22]. This has a compounding effect for individuals with high online accuracies. If the online accuracy was near 100%, not only is there little room for improvement in an absolute sense, but the participant almost certainly demonstrated little latency variation. Since this method provides improvement by removing latency variation, these individuals will see little benefit from this method. However, it should be noted that target populations for BCI often experience lower performance than controls, so this is not a critical weakness of this method.
Finally, it is noted that on this dataset LS appears to perform better than SWLDA, even without CBLE. This is in contrast with [8], and may be due to the fact that the number of stimulus presentations for each participant was chosen based on LS performance.
5. Limitations
CBLE itself has been demonstrated to be at least partially classifier independent [22]. Therefore, it is possible that this boosting method could be applied with other first-level classifiers being used to estimate the latency. However, we have not tested this claim here. We did use a SWLDA-based CBLE with this approach, but the results were not different enough to merit inclusion.
This is an offline analysis of existing data, and the method is not yet ready for online implementation.
6. Conclusion
This work demonstrates an improvement in information throughput using a technique that can be used with many classifiers, including the relatively simple LS classifier used here. Interestingly, the improvement is the largest for participants with marginal accuracies, those for whom the typical techniques produced some communication but not ideal performance. This suggests that the technique helps to offset, but does not eliminate, the negative effect of latency jitter on classification. Further work on removing latency jitter should continue providing improved performance for individuals for whom current-generation BCIs do not perform well.
Acknowledgments
The authors would like to thank all individuals involved in early stages of this investigation, especially Carmela Lee and Robert Trotter who performed the bulk of the data collection.
Funding
This work was supported in part by the National Institute of Child Health and Human Development (NICHD), the National Institutes of Health (NIH) under grant R21HD054697 and by the National Institute on Disability and Rehabilitation Research (NIDRR) in the Department of Education under grant H133G090005. The opinions and conclusions are those of the authors, not the respective funding agencies.
References
- 1.Wolpaw JR, Birbaumer N, McFarland DJ, et al. Brain–computer interfaces for communication and control. Clinical neurophysiology. 2002;113(6):767–791. doi: 10.1016/s1388-2457(02)00057-3. [DOI] [PubMed] [Google Scholar]
- 2.McFarland DJ, Wolpaw JR. Brain-computer interfaces for communication and control. Communications of the ACM. 2011;54(5):60–66. doi: 10.1145/1941487.1941506. [DOI] [PMC free article] [PubMed] [Google Scholar]
- 3.Farwell LA, Donchin E. Talking off the top of your head: toward a mental prosthesis utilizing event-related brain potentials. Electroencephalography and clinical Neurophysiology. 1988;70(6):510–523. doi: 10.1016/0013-4694(88)90149-6. [DOI] [PubMed] [Google Scholar]
- 4.Townsend G, LaPallo B, Boulay C, et al. A novel p300-based brain–computer interface stimulus presentation paradigm: moving beyond rows and columns. Clinical Neurophysiology. 2010;121(7):1109–1120. doi: 10.1016/j.clinph.2010.01.030. [DOI] [PMC free article] [PubMed] [Google Scholar]
- 5.Fabiani M, Gratton G, Karis D, et al. Definition, identification, and reliability of measurement of the p300 component of the event-related brain potential. Advances in psychophysiology. 1987;2(S1):78. [Google Scholar]
- 6.Kindermans PJ, Schreuder M, Schrauwen B, et al. True zero-training brain-computer interfacing–an online study. PloS one. 2014;9(7):e102504. doi: 10.1371/journal.pone.0102504. [DOI] [PMC free article] [PubMed] [Google Scholar]
- 7.Kindermans PJ, Tangermann M, Müller KR, et al. Integrating dynamic stopping, transfer learning and language models in an adaptive zero-training erp speller. Journal of neural engineering. 2014;11(3):035005. doi: 10.1088/1741-2560/11/3/035005. [DOI] [PubMed] [Google Scholar]
- 8.Krusienski DJ, Sellers EW, Cabestaing F, et al. A comparison of classification techniques for the p300 speller. Journal of neural engineering. 2006;3(4):299. doi: 10.1088/1741-2560/3/4/007. [DOI] [PubMed] [Google Scholar]
- 9.Donchin E, Spencer KM, Wijesinghe R. The mental prosthesis: assessing the speed of a p300-based brain-computer interface. IEEE transactions on rehabilitation engineering. 2000;8(2):174–179. doi: 10.1109/86.847808. [DOI] [PubMed] [Google Scholar]
- 10.Sellers EW, Donchin E. A p300-based brain–computer interface: initial tests by als patients. Clinical neurophysiology. 2006;117(3):538–548. doi: 10.1016/j.clinph.2005.06.027. [DOI] [PubMed] [Google Scholar]
- 11.Krusienski DJ, Sellers EW, McFarland DJ, et al. Toward enhanced p300 speller performance. Journal of neuroscience methods. 2008;167(1):15–21. doi: 10.1016/j.jneumeth.2007.07.017. [DOI] [PMC free article] [PubMed] [Google Scholar]
- 12.Kaper M, Meinicke P, Grossekathoefer U, et al. Bci competition 2003-data set iib: support vector machines for the p300 speller paradigm. IEEE Transactions on Biomedical Engineering. 2004;51(6):1073–1076. doi: 10.1109/TBME.2004.826698. [DOI] [PubMed] [Google Scholar]
- 13.Rakotomamonjy A, Guigue V. Bci competition iii: dataset ii-ensemble of svms for bci p300 speller. IEEE transactions on biomedical engineering. 2008;55(3):1147–1154. doi: 10.1109/TBME.2008.915728. [DOI] [PubMed] [Google Scholar]
- 14.Hoffmann U, Vesin JM, Ebrahimi T, et al. An efficient p300-based brain–computer interface for disabled subjects. Journal of Neuroscience methods. 2008;167(1):115–125. doi: 10.1016/j.jneumeth.2007.03.005. [DOI] [PubMed] [Google Scholar]
- 15.Cecotti H, Graser A. Convolutional neural networks for p300 detection with application to brain-computer interfaces. IEEE transactions on pattern analysis and machine intelligence. 2011;33(3):433–445. doi: 10.1109/TPAMI.2010.125. [DOI] [PubMed] [Google Scholar]
- 16.McCarthy G, Donchin E. A metric for thought: a comparison of p300 latency and reaction time. Science. 1981;211(4477):77–80. doi: 10.1126/science.7444452. [DOI] [PubMed] [Google Scholar]
- 17.Kutas M, McCarthy G, Donchin E. Augmenting mental chronometry: the p300 as a measure of stimulus evaluation time. Science. 1977;197(4305):792–795. doi: 10.1126/science.887923. [DOI] [PubMed] [Google Scholar]
- 18.Magliero A, Bashore TR, Coles MG, et al. On the dependence of p300 latency on stimulus evaluation processes. Psychophysiology. 1984;21(2):171–186. doi: 10.1111/j.1469-8986.1984.tb00201.x. [DOI] [PubMed] [Google Scholar]
- 19.Picton TW. The p300 wave of the human event-related potential. Journal of clinical neurophysiology. 1992;9(4):456–479. doi: 10.1097/00004691-199210000-00002. [DOI] [PubMed] [Google Scholar]
- 20.Polich J. Updating p300: an integrative theory of p3a and p3b. Clinical neurophysiology. 2007;118(10):2128–2148. doi: 10.1016/j.clinph.2007.04.019. [DOI] [PMC free article] [PubMed] [Google Scholar]
- 21.Fjell AM, Rosquist H, Walhovd KB. Instability in the latency of p3a/p3b brain potentials and cognitive function in aging. Neurobiology of aging. 2009;30(12):2065–2079. doi: 10.1016/j.neurobiolaging.2008.01.015. [DOI] [PubMed] [Google Scholar]
- 22.Thompson DE, Warschausky S, Huggins JE. Classifier-based latency estimation: a novel way to estimate and predict bci accuracy. Journal of neural engineering. 2012;10(1):016006. doi: 10.1088/1741-2560/10/1/016006. [DOI] [PMC free article] [PubMed] [Google Scholar]
- 23.Blankertz B, Lemm S, Treder M, et al. Single-trial analysis and classification of erp componentsa tutorial. NeuroImage. 2011;56(2):814–825. doi: 10.1016/j.neuroimage.2010.06.048. [DOI] [PubMed] [Google Scholar]
- 24.Polich J, Herbst KL. P300 as a clinical assay: rationale, evaluation, and findings. International Journal of Psychophysiology. 2000;38(1):3–19. doi: 10.1016/s0167-8760(00)00127-6. [DOI] [PubMed] [Google Scholar]
- 25.DAvanzo C, Schiff S, Amodio P, et al. A bayesian method to estimate single-trial event-related potentials with application to the study of the p300 variability. Journal of neuroscience methods. 2011;198(1):114–124. doi: 10.1016/j.jneumeth.2011.03.010. [DOI] [PubMed] [Google Scholar]
- 26.Li R, Keil A, Principe JC. Single-trial p300 estimation with a spatiotemporal filtering method. Journal of neuroscience methods. 2009;177(2):488–496. doi: 10.1016/j.jneumeth.2008.10.035. [DOI] [PubMed] [Google Scholar]
- 27.Walhovd KB, Rosquist H, Fjell AM. P300 amplitude age reductions are not caused by latency jitter. Psychophysiology. 2008;45(4):545–553. doi: 10.1111/j.1469-8986.2008.00661.x. [DOI] [PubMed] [Google Scholar]
- 28.Iturrate I, Chavarriaga R, Montesano L, et al. Latency correction of event-related potentials between different experimental protocols. Journal of neural engineering. 2014;11(3):036005. doi: 10.1088/1741-2560/11/3/036005. [DOI] [PubMed] [Google Scholar]
- 29.Thompson DE, Baker JJ, Sarnacki WA, et al. Plug-and-play brain-computer interface keyboard performance. In: Neural Engineering, 2009. NER’09. 4th International IEEE/EMBS Conference on; IEEE; 2009; pp. 433–435. [Google Scholar]
- 30.Murphy KP. Machine learning: a probabilistic perspective. MIT press; 2012. [Google Scholar]
- 31.Chun-Lin L. A tutorial of the wavelet transform. NTUEE; Taiwan: 2010. [Google Scholar]
- 32.Dal Seno B, Matteucci M, Mainardi LT. The utility metric: a novel method to assess the overall performance of discrete brain–computer interfaces. IEEE Transactions on Neural Systems and Rehabilitation Engineering. 2010;18(1):20–28. doi: 10.1109/TNSRE.2009.2032642. [DOI] [PubMed] [Google Scholar]
- 33.Thompson DE, Blain-Moraes S, Huggins JE. Performance assessment in brain-computer interface-based augmentative and alternative communication. Biomedical engineering online. 2013;12(1):1. doi: 10.1186/1475-925X-12-43. [DOI] [PMC free article] [PubMed] [Google Scholar]
- 34.Thompson DE, Quitadamo LR, Mainardi L, et al. Performance measurement for brain–computer or brain–machine interfaces: a tutorial. Journal of neural engineering. 2014;11(3):035001. doi: 10.1088/1741-2560/11/3/035001. [DOI] [PMC free article] [PubMed] [Google Scholar]


