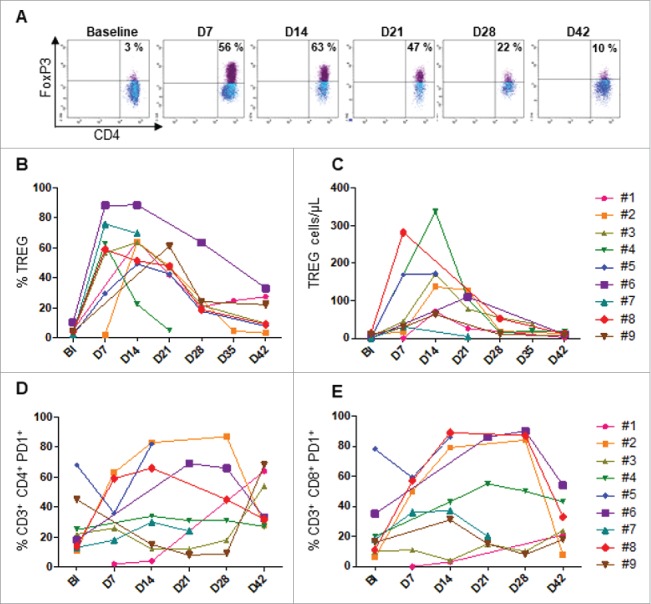
Figure 5.

Monitoring of FoxP3+Tregs and PD-1+T through treatment. Flow cytometry analysis was performed from PBMC collected in each patient at the indicated time points. A. Tregs representative plot from one patient (#5). The kinetic of percentage (B) and absolute count of FoxP3+ Tregs are shown. The percentage of PD-1+ CD4 (D) and CD8 (E) T cells are shown. Baseline (BI)
