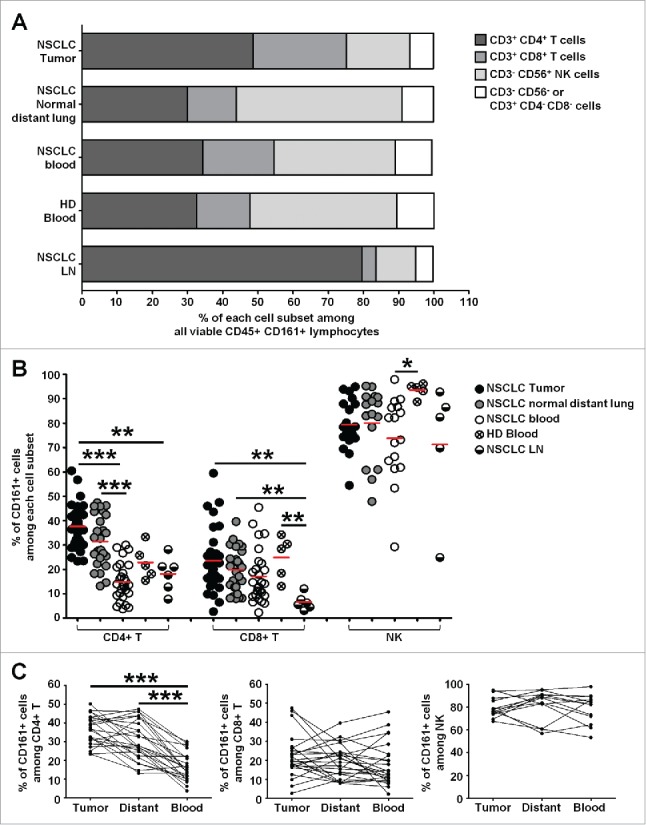
Figure 5.

High frequencies of CD161-expressing CD4+ T cells in NSCLC tumors. (A) Histogram representing the mean percentages of each cell subset among viable CD45+ CD161+ lymphocytes, in each compartment. (B) Histogram representing the percentages of cells expressing CD161 among each cell subset, in each compartment, n = 33. Means are indicated by red horizontal lines. P values were calculated using One-way anova/Kruskal-Wallis/Dunn's test. (C) Graphs representing the percentages of cells expressing CD161 among each cell subset, in each compartment, in matched patients, n = 24. P values were calculated with One-way anova/Friedman/Dunn's test. *p<0.05, **p<0.005, ***p<0.001.
