

Abstract
Background
Mild action tremor occurs in most normal people. Yet this tremor mainly has been studied within the context of advanced age rather than the vast bulk of adults who are not elderly. Whether this tremor worsens during young and middle age is unknown. Using cross-sectional data from a large population-based study of young and midlife (ages 18 – 60) normal adults, we assessed whether increasing age is associated with more severe action tremor.
Methods
2,524 adults in Araihazar, Bangladesh drew an Archimedes spiral with each hand. Tremor in spirals was rated (0 - 3) by a blinded neurologist and a spiral score (range, 0 – 6) was assigned.
Results
Spiral score was correlated with age (r = 0.06, p = 0.004). With each advancing decade, the spiral score increased (p = 0.002) so that the spiral score in participants in the highest age group (age 60) was approximately twice that of participants in the youngest age group (18-19 years)(p = 0.003). In the regression model that adjusted for potential confounders (gender, cigarettes, medications, asthma inhalers, tea and betel nut use), spiral score was associated with age (p = 0.0045).
Conclusions
In this cross-sectional, population-based study of >2,500 young and mid-life normal adults, there was a clear association between age and tremor severity. Although the magnitude of the correlation coefficient was modest, tremor severity was higher with each passing decade. These data suggest that age-dependent increase in tremor amplitude is not restricted to older people, but occurs in all adult age groups.
Keywords: Tremor, epidemiology, clinical, age
Introduction
Mild hand tremor occurs in most normal people.1, 2. While caffeine and nicotine may exacerbate this action tremor, beta blockers can relieve it.3, 4 It is well-established that this tremor increases in advanced age, leading to the commonly-used term “senile tremor”.5, 6 This normal form of action tremor has been studied primarily within the context of advanced age (>65 years), yet its more general relationship with age, among the vast bulk of adults who are not elderly, has been the subject of little study.
In 2000, 78.1% of adults in the United States were young or midlife adults, falling between the ages of 18 and 59 years,7 making the health of this age group, which forms the bulk of the nation’s workforce, of sizable importance. It would be valuable to know in this age group whether tremor covaries (i.e., increases in severity) with age, as hand tremor is functionally and occupationally important in many settings. Tremor may impair precise hand control in professional musicians,8 and is a source of impaired motor performance in professional sports,9 among surgeons,10–12 in airplane pilots,13 and it can impede effective shooting performance in military personnel.14–17 The expected progression of such action tremor from young adulthood through middle age years is of prognostic significance. This information would be useful in other settings. First, in occupational medicine and toxic epidemiology, which often focus on neurological outcomes (e.g., hand tremor),18 it is important to establish whether, even among the unexposed, tremor is expected to increase in severity with advancing age strata. Second, in genetic studies, background levels of tremor are important to gauge; for example, should one as a matter of course expect more action tremor in a 50 year old than an 18 year old study subject? At present, there are too few data to answer this simple question.
Utilizing cross-sectional clinical data on hand tremor in >2,500 young and midlife normal adults (ages 18 – 60 years) recruited for a population-based epidemiological study, our aim was to assess whether action tremor covaries with age such that higher age is associated with more severe tremor.
Methods
Study Population and Sampling Frame
The Health Effects of Arsenic Longitudinal Study (HEALS) is a prospective epidemiological study of health outcomes in adults in Araihazar, Bangladesh, a rural area east of Dhaka with relatively homogenous socio-cultural characteristics.19–22 Between October 2000 and May 2002, we recruited individuals age ≥18 years who were (1) married (an eligibility criterion to keep loss to follow-up to a minimum), (2) residents of the study area for ≥5 years and (3) primarily drinking water from local wells. Using a pre-cohort survey, we enumerated a total of 65,876 individuals residing in Araihazar, from which we identified a sampling frame of 14,828 eligible residents (Figure). Of these 14,828, 2,778 were not at home during any of three attempted recruiting visits. Of 12,050 remaining eligible residents, 11,746 (97.5%) were enrolled (Figure).19–22 Follow-up evaluations were conducted on a scheduled basis: follow-up 1 (September 2002 - May 2004), follow-up 2 (June 2004 - August 2006) and follow-up 3 (January 2007 - February 2009).
Figure.
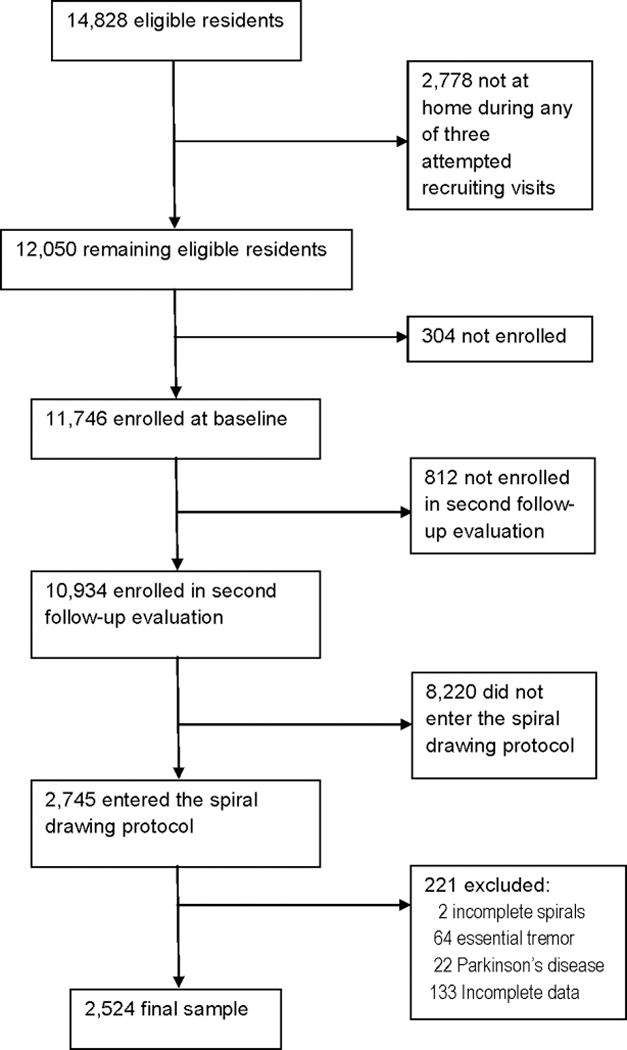
Study profile
In-Person Evaluations
As part of baseline and follow-up evaluations, six medical doctors, who were assisted by trained field staff, collected demographic and medical data. This study was approved by the Columbia University Medical Center Internal Review Board and the Bangladesh Medical Research Council; informed consent was obtained in Bengali from all participants.19, 20
Assessment of Tremor
As an addition to this broad health survey, a brief assessment of action tremor (spiral drawing) was added in 2006, although there were no data linking arsenic or well water exposure to action tremor. First, a pilot study of the feasibility of spiral drawing was conducted over a 10-day period in February 2005.19 Each of 100 consecutively-enrolled participants was asked to use their dominant hand to draw an Archimedes spiral. As described,19 spirals were drawn freely on a blank, standard 8.5 × 11 inch sheet of paper using a ballpoint pen while the participant was seated at a table. The paper was centered at right angles (horizontally) directly in front of them and held down by their other hand. Participants started at the center of the page, without lifting their pen. This was repeated with the nondominant hand, yielding two spirals.19 Tremor in each spiral was later rated by a blinded neurologist who specializes in movement disorders (E.D.L.). The neurologist used an ordinal clinical rating scale from 0 to 3, and including ratings of 0 (none), 0.5 (very mild), 1 (mild), 1.5 (mild-to-moderate), 2 (moderate) and 3 (severe)(see examples of drawings rated as such in prior population-based studies23), assigning a spiral score (range = 0 [no tremor] – 6) to each participant. One week later, the spirals were re-rated and spiral scores obtained from the two ratings were similar (r = 0.96; p <0.0001), indicating that the ratings were reliable.19 Not unexpectedly, the pilot study failed to detect an association between tremor severity (on spirals) and urinary arsenic levels.19
Cross-Sectional Study of Tremor
In January 2006, during the second follow-up evaluation, the spiral drawing protocol was instituted. Each participant evaluated after that point was asked to draw two spirals, as described above. Tremor in these two spirals was rated by a blinded neurologist specializing in movement disorders (E.D.L.).
During the evaluation, participants were also asked whether they had been diagnosed with Parkinson’s disease (PD) and each participant was asked about their use, on the day of the evaluation, of any medications and of the following substances: betel quid, tea, cigarettes, caffeinated soda, and asthma inhalers, each of which may produce or exacerbate tremor.19 For religious reasons, ethanol is not consumed in the study area; similarly, coffee drinking is an extremely rare practice in this rural setting in Bangladesh.
Diagnosis of ET
As in our prevalence study in New York,23 ET diagnosis was based on an examination of handwriting samples. Using guidelines proposed by Bain et al.,24 who conducted a detailed assessment of tremor in spirals in ET cases and controls, we assigned a preliminary diagnosis of ET based on the severity of tremor in the two spirals. We also required that a second movement disorder neurologist (R.N.A.) independently confirm these diagnoses using criteria for ET proposed in the Consensus Statement on Tremor by the Movement Disorder Society (bilateral, largely symmetric postural or kinetic tremor involving hands and forearms that is visible and persistent).25
Final Subject Selection
Although 2,714 consecutive participants (age 18 – 60 years) drew spirals, 2 (0.07%) participants were missing one of the spirals, leaving 2,712 participants with a complete set of two spirals. We further excluded the 63 ET cases (2.3% of 2,714) and 21 PD cases (0.8% of 2,714), as our aim was to study tremor in normal individuals without neurological disease. This left 2,628 participants. We also excluded 104 (3.9%) participants with incomplete demographic or medical data, leaving a final sample of 2,524 participants (Figure).
Statistical Analyses
The spiral score was not normally distributed (Kolmogorov-Smirnov z = 8.73, p <0.001). Non-parametric tests used in bivariate analyses of this variable included the Mann-Whitney test and Kruskal-Wallis test for group differences and Spearman’s r for correlations. We first examined the association between spiral score and age using a Spearman’s correlation coefficient and then stratified age into decades, examining differences between age decades in spiral score (Kruskal-Wallis test). Noting that the variance of the spiral score tended to increase with its mean, we used a negative binomial model for spiral score, with the main predictor being age, in order to examine the association between spiral score and age while controlling for the effects of potential confounding factors (gender, medications and usage of betel quids, tea, cigarettes, caffeinated soda, and asthma inhaler). To aid in interpretation, in each model, a mean ratio and 95% confidence interval (CI) was derived from the estimated parameter.
Results
Participants ranged in age from 18 to 60 years (mean = 36.1, median = 35 years); the vast majority (2,232 [88.4%]) were between age 20 and 49 years. Very few took medication (Table 1). The mean spiral score was 0.79 ± 0.58 (Table 1).
Table 1.
Characteristics of 2,524 Study Participants
| Age in years | 36.1 ± 9.6 (35.0, 18 – 60) |
| Female Gender | 1,532 (60.7) |
| Spiral score | 0.79 ± 0.58 (1.0, 0 - 3) |
| Chewed betel quid* | 729 (28.9) |
| Number of betel quids chewed* | 0.6 ± 1.1 (0, 0 - 12) |
| Drank tea* | 358 (14.2) |
| Number of cups of tea* | 0.2 ± 0.7 (0, 0 - 6) |
| Smoked cigarettes* | 558 (22.1) |
| Number of cigarettes smoked* | 0.8 ± 1.8 (0, 0 - 15) |
| Drank caffeinated soda* | 8 (0.3) |
| Number of cups of caffeinated soda* | 0.0 ± 0.1 (0, 0 - 2) |
| Used asthma inhaler* | 18 (0.7) |
| Taking medication | 122 (4.8) |
Values are mean ± standard deviation (median, range) or number (percentage)
On the day of the evaluation.
In bivariate analyses, the spiral score was correlated with age (r = 0.06, p = 0.004)(Table 2). The spiral score differed by betel quid usage, tea usage, cigarette usage, and asthma inhaler usage (Table 2). Participants who took medication, on average, had lower spiral scores (less tremor) than did those who did not take medication (Table 2).
Table 2.
Spiral Score by Demographic and Clinical Characteristics
| Characteristics | Correlation (r)** with spiral score or mean ± SD spiral score |
|---|---|
|
| |
| Age in years | r = 0.06, p = 0.004 |
|
| |
| Gender | |
| Male | 0.79 ± 0.58 |
| Female | 0.79 ± 0.58 |
| Mann Whitney, p = 0.71 | |
|
| |
| Chewed betel quid* | |
| Yes | 0.85 ± 0.60 |
| No | 0.77 ± 0.58 |
| Mann Whitney, p = 0.006 | |
|
| |
| Number of betel quids chewed* | r = 0.05, p = 0.007 |
|
| |
| Drank tea* | |
| Yes | 0.86 ± 0.59 |
| No | 0.78 ± 0.58 |
| Mann Whitney, p = 0.01 | |
|
| |
| Number of cups of tea* | r = 0.05, p = 0.02 |
|
| |
| Smoked cigarettes* | |
| Yes | 0.84 ± 0.61 |
| No | 0.78 ± 0.57 |
| Mann Whitney, p = 0.06 | |
|
| |
| Number of cigarettes smoked* | r = 0.04, p = 0.07 |
|
| |
| Drank caffeinated soda* | |
| Yes | 0.94 ± 0.62 |
| No | 0.79 ± 0.58 |
| Mann Whitney, p = 0.51 | |
|
| |
| Number of cups of caffeinated soda* | r = 0.01, p = 0.51 |
|
| |
| Used asthma inhaler* | |
| Yes | 1.06 ± 0.61 |
| No | 0.79 ± 0.58 |
| Mann Whitney, p = 0.08 | |
|
| |
| Taking medication | |
| Yes | 0.73 ± 0.58 |
| No | 0.80 ± 0.58 |
| Mann Whitney, p = 0.03 | |
On the day of the evaluation.
Correlation coefficients are Spearman’s correlation coefficients.
To further examine the association between higher spiral score and older age, we stratified age into decades. With each advancing decade, the spiral score tended to increase (Table 3, Kruskal-Wallis test statistic = 18.83, p = 0.002). The spiral score in participants in the highest decade group (represented by participants = age 60 years, n = 25) was almost twice that of participants in the youngest decade group (ages 18 and 19, n = 18) (Mann-Whitney statistic z = 2.97, p = 0.003, Table 3). Exclusion of 122 participants who were taking medication yielded similar results (i.e., with each advancing decade, the spiral score tended to increase (Table 3, Kruskal-Wallis test statistic = 16.06, p = 0.007). Further collapse of participants into a smaller number of age categories yielded a similar result, with a significant difference between the youngest and highest age group (Mann-Whitney z statistic = 2.53, p = 0.01, Table 3).
Table 3.
Spiral Score by Age Decade in 2,524 Study Participants aged 18 - 60
| Age in Years by Decade | Number of Participants | Spiral score* |
|---|---|---|
|
| ||
| 2nd decade (18 and 19 years) | 18 | 0.69 ± 0.52 |
| 3rd decade (20 – 29 years) | 696 | 0.76 ± 0.58 |
| 4th decade (30 – 39 years) | 908 | 0.80 ± 0.58 |
| 5th decade (40 – 49 years) | 628 | 0.80 ± 0.58 |
| 6th decade (50 – 59 years) | 249 | 0.83 ± 0.57 |
| 7th decade (60 years) | 25 | 1.30 ± 0.65 |
|
| ||
| <20 – 29 | 714 | 0.76 ± 0.57 |
| 30 – 39 | 908 | 0.79 ± 0.58 |
| 40 – 49 | 628 | 0.80 ± 0.58 |
| 50 – 60 | 274 | 0.87 ± 0.59 |
Values are mean ± standard deviation
For top row, Kruskal-Wallis test statistic = 18.83, p = 0.002. The spiral score in participants in the highest decade group (represented by participants = age 60 years, n = 25) was almost twice that of participants in the youngest decade group (ages 18 and 19, n = 18) (Mann-Whitney statistic z = 2.97, p = 0.003). Exclusion of 122 participants who were taking medication yielded similar results (i.e., with each advancing decade, the spiral score tended to increase (data not shown, Kruskal-Wallis test statistic = 16.06, p = 0.007). Few participants were in the lowest and highest decade strata. Therefore, in a secondary analysis (bottom row), categories were further collapsed (18 and 19 year olds were combined with 20 – 29 year olds, and 60 year olds were combined with >50 year olds). Kruskal-Wallis test statistic = 6.57, p = 0.087. The spiral score in participants in the highest age group (age 50 - 60 years) was higher than that of participants in the youngest age group (ages 18 – 29 years) (Mann-Whitney statistic z = 2.53, p = 0.01).
Using maximum likelihood methods, spiral score was associated with age (mean ratio = 1.05, 95% CI = 1.02 – 1.08, p = 0.007) in a univariate model. In the negative binomial regression model, the association between spiral score and age persisted (mean ratio for each ten-year increase in age = 1.05, 95% CI = 1.02 – 1.09, p = 0.0043); in that model, higher spiral score was also associated with gender (mean ratio of female vs. male was = 1.12, 95% CI = 1.04 – 1.22, p = 0.003), cigarette use on the day of evaluation (mean ratio = 1.11, 95% CI = 1.02 – 1.21, p = 0.02), and inhaler use on the day of evaluation (mean ratio = 1.35, 95% CI = 1.02 – 1.79, p = 0.036). It was marginally associated with tea consumption on the day of evaluation (mean ratio = 1.08, 95% CI = 0.99 – 1.18, p = 0.067) and no use of medication (mean ratio of no use vs. use was = 1.14, 95% CI = 0.99 – 1.32, p = 0.06). It was not to a significant degree associated with betel nut use on the day of evaluation (mean ratio = 1.05, 95% CI = 0.98 – 1.12, p = 0.14). Consumption of caffeinated soda was nearly non-existent (only eight participants); therefore, it was not included as a covariate in the model.
Discussion
In this population-based sample of more than 2,500 young and mid-life normal adults (age 18 – 60), there was a consistent association between age and tremor severity. Although the magnitude of the correlation coefficient was modest (r = 0.06), in these cross-sectional analyses, the tremor seemed to increase with each passing decade. These data suggest that age-dependent increase in tremor amplitude is not restricted to older people, but occurs in all age groups.
Our initial data indicate approximately twice as much tremor in 60 years olds than in 18 - 19 year olds. In additional analyses that controlled for the effects of confounding factors (e.g., caffeine, smoking etc) so that the effect of age, alone, on tremor could be estimated, we found that each ten year increase in age was associated with on average a 0.05 point increase in the spiral score. The occupational consequences, during peak work years (ages 18 – 60) among surgeons, military personnel, pilots and others, of such a cumulative age-associated increase in action tremor have yet to be assessed.
While the association between tremor severity and age has been studied in the elderly, there have been few studies of this phenomenon among the vast majority of adults who have yet to reach advanced ages. One small study examined hand steadiness and line tracing, comparing a group of 14 younger (mean age 24.8 years) to 14 older (mean age 51.8 years) normal subjects, showing slightly poorer performance in these aspects of motor control in the older age group.26 Accelerometry was used to assess the total power of postural tremor in a group of 117 normal individuals aged 20 – 94 years, including a smaller subsample of 80 individuals age 20 – 59 years;27 the authors reported that total power did not differ to a significant degree between the different age groups, although data on power by age group are not presented. A third study used accelerometry to assess tremor amplitude in 66 normal individuals aged 21 to 59 years; although there was no significant association between age and amplitude, the data plots (age by amplitude), indicate a greater preponderance of higher amplitudes in the 50 – 59 year old than the 20 – 29 year old age group.28 These studies26–28 had small sample sizes (n = 28, 66, 80), and, as a result, modest increase in tremor severity with age, as we observed, would not have been detected.
Cigarettes, inhalers and tea were associated with higher spiral scores in our regression model. Nicotine, in cigarettes, is well-known to exacerbate tremor,3, 29 as are caffeine30 and methylxanthines,31 in tea. Similarly, asthma inhalers are well-known to exacerbate tremor.32 In a pilot study,19 we had demonstrated that betel quid use was associated with increased tremor. In the current study, betel quid use was associated with higher spiral scores in bivariate analyses; in a regression model with multiple covariates, the effect was attenuated. A small proportion of study participants (<5%) was using medication. Of interest is that medication use was associated with marginally diminished tremor in our regression model. While some medications are known to exacerbate tremor,33 others (e.g., benzodiazepines, bet-blockers, etc) may lessen tremor. In our participants, the net effect of medication was ameliorative.
This study had limitations. First, we used a clinical rating scale rather than accelerometric recordings of tremor. The latter would have increased the precision of our estimates of tremor severity. The lower relative precision likely biased our results towards the null hypothesis, causing us to underestimate the magnitude of the association between tremor severity and age. Despite this, however, we were able to detect an association. One problem with accelerometry is that, unlike the use of clinician-rated spiral drawings, which evaluate differences that are evident to a clinician, small electrically-measurable differences in amplitude do not necessarily have clinical significance. Second, we were careful to exclude all participants with PD or ET, although recognize that our sample may have contained a small number of these as well. Nevertheless, the number is likely to be very low. The mean age of participants was only 36.1 years, and the prevalence of PD and ET is low at such ages. Furthermore, the prevalence of PD was 0.80% in this sample, which is similar to or even higher than that reported in other populations with this age structure (e.g., 0.01% in Nigeria,34 0.03% in India,35 and 0.04% in China36) suggesting that we missed few PD cases. Similarly, the prevalence of ET (2.3%) was comparable or even higher to that found in other population-based studies of this age group.37 Third, other neurological disorders may cause tremor. Given the very low population-prevalence of primary writing tremor (1/200 that of ET)38 and dystonia (0.01% - 0.3%);39 however, we would expect only 0.29 cases of primary writing tremor and somewhere between 0.25 – 7.6 cases of primary dystonia in our entire sample of 2,524 participants.
This study had considerable strengths. First, it was a population-based study that included a standardized assessment of tremor severity in >2,500 persons in the age groups of interest. The large sample size allowed us to detect associations that would not have been evident in smaller studies, and the use of multivariate modeling allowed us to dissect out and examine the independent contributions of a variety of factors to tremor severity.
In summary, in this large, population-based sample of >2,500 young and mid-life adults, a clear cross-sectional association between age and tremor severity was evident. Although the magnitude of the correlation coefficient was modest, these data suggest that age-dependent increase in tremor amplitude is not restricted to older people, but occurs in all age groups.
Acknowledgments
Financial disclosure related to research covered in this article
This research was supported by National Institutes of Health Grants R01 NS39422, P30 ES09089, P42 ES10349 and R01 CA102484.
Full financial disclosure for the previous 12 months
Elan D. Louis has received research support from the National Institutes of Health: NINDS #R01 NS42859 (principal investigator), NINDS #R01 NS39422 (principal investigator), NINDS #R56 NS042859 (principal investigator), NINDS #T32 NS07153-24 (principal investigator), NIA #2P01 AG0027232-16 (principal investigator), and NINDS #R01 NS36630 (co-Investigator), as well as the Parkinson's Disease Foundation (principal investigator), the Arlene Bronstein Essential Tremor Research Fund (Columbia University), and the Claire O'Neil Essential Tremor Research Fund (Columbia University).
Danella Hafeman did not receive research support.
Faruque Parvez did not receive research support.
Xinhua Liu has received research support from the National Institutes of Health: NINDS #R01 NS39422 (Co-Investigator), NIEHS #P30 ES09089 (Biostatistician), NIEHS #5P420 EH10349 (Co-Investigator), NIEHS #R01 ES013543 (Co-Investigator), NIEHS #NCI R01 CA133595 (Co-Investigator) NIEHS #R01 ES017875 (Co-Investigator), NIEHS # R01 ES017024 (Co-Investigator), NIA #R01 AG17761 (Biostatistician), NIDA # DA023091-01A2 (Biostatistician).
Roy N. Alcalay has received research support from the Brookdale Foundation and the Michael J Fox foundation.
Tariqul Islam did not receive research support.
Alauddin Ahmed did not receive research support.
Abu Baker Siddique did not receive research support.
Tajul Islam Patwary did not receive research support.
Stephanie Melkonian did not receive research support.
Maria Argos did not receive research support.
Diane Levy has received research support from NIEHS #P30 ES009089 (co-Investigator) and NIEHS #P42 ES010349 (co-Investigator).
Habibul Ahsan as received research support from NIH P42ES010349 (principal investigator), R01 CA102484 (principal investigator), R1CA145506 (principal investigator), and U01CA122171 (principal investigator).
Footnotes
Statistical Analyses: The statistical analyses were conducted by Dr. Louis and Dr. Liu.
Conflict of Interest Statement
The authors declare that there are no conflicts of interest and no competing financial interests.
Author Contributions
Elan D. Louis: Research project conception, organization and execution; statistical analyses design and execution; manuscript writing (writing the first draft and making subsequent revisions).
Danella Hafeman: Research project conception, organization and execution; manuscript writing (review and critique).
Faruque Parvez: Research project organization and execution; manuscript writing (review and critique).
Xinhua Liu: Statistical analyses design and execution; manuscript writing (review and critique).
Roy Alcalay: Research project execution; manuscript writing (review and critique).
Tariqul Islam: Research project execution; manuscript writing (review and critique).
Alauddin Ahmed: Research project execution; manuscript writing (review and critique).
Abu Baker Siddique: Research project execution; manuscript writing (review and critique).
Tajul Islam Patwary: Research project execution; manuscript writing (review and critique).
Stephanie Melkonian: Research project execution; manuscript writing (review and critique).
Maria Argos: Research project execution; manuscript writing (review and critique).
Diane Levy: Research project execution; manuscript writing (review and critique).
Habibul Ahsan: Research project conception, organization and execution; manuscript writing (review and critique).
References
- 1.Louis ED, Ford B, Pullman S, Baron K. How normal is “normal”? Mild tremor in a multiethnic cohort of normal subjects. Arch Neurol. 1998;55(2):222–227. doi: 10.1001/archneur.55.2.222. [DOI] [PubMed] [Google Scholar]
- 2.Morrison S, Keogh J. Changes in the dynamics of tremor during goal-directed pointing. Hum Mov Sci. 2001;20(4–5):675–693. doi: 10.1016/s0167-9457(01)00072-0. [DOI] [PubMed] [Google Scholar]
- 3.Maykoski KA, Rubin MB, Day AC. Effect of cigarette smoking on postural muscle tremor. Nurs Res. 1976;25(1):39–43. [PubMed] [Google Scholar]
- 4.Arnold RW, Springer DT, Engel WK, Helveston EM. The effect of wrist rest, caffeine, and oral timolol on the hand steadiness of ophthalmologists. Ann Ophthalmol. 1993;25(7):250–253. [PubMed] [Google Scholar]
- 5.Louis ED, Wendt KJ, Ford B. Senile tremor. What is the prevalence and severity of tremor in older adults? Gerontology. 2000;46(1):12–16. doi: 10.1159/000022127. [DOI] [PubMed] [Google Scholar]
- 6.Morrison S, Sosnoff JJ. Age-related changes in the adaptability of neuromuscular output. J Mot Behav. 2009;41(3):274–283. doi: 10.3200/JMBR.41.3.274-288. [DOI] [PubMed] [Google Scholar]
- 7.United States Census Data. United States Population by Age Intervals. 2000 [Google Scholar]
- 8.Wesner RB, Noyes R, Jr, Davis TL. The occurrence of performance anxiety among musicians. J Affect Disord. 1990;18(3):177–185. doi: 10.1016/0165-0327(90)90034-6. [DOI] [PubMed] [Google Scholar]
- 9.Lin JJ, Hung CJ, Yang CC, Chen HY, Chou FC, Lu TW. Activation and tremor of the shoulder muscles to the demands of an archery task. J Sports Sci. 28(4):415–421. doi: 10.1080/02640410903536434. [DOI] [PubMed] [Google Scholar]
- 10.Magrina JF. Robotic surgery in gynecology. Eur J Gynaecol Oncol. 2007;28(2):77–82. [PubMed] [Google Scholar]
- 11.Harwell RC, Ferguson RL. Physiologic tremor and microsurgery. Microsurgery. 1983;4(3):187–192. doi: 10.1002/micr.1920040310. [DOI] [PubMed] [Google Scholar]
- 12.Holmes JM, Toleikis SC, Jay WM. The effect of arm exercise and ocular massage on postural hand tremor. Ann Ophthalmol. 1992;24(4):156–158. [PubMed] [Google Scholar]
- 13.Nicholson AN. Studies on the nervous system of a pilot during the approach and landing of a transport aircraft. Proc R Soc Med. 1973;66(6):530–532. [PMC free article] [PubMed] [Google Scholar]
- 14.Lakie M, Villagra F, Bowman I, Wilby R. Shooting performance is related to forearm temperature and hand tremor size. J Sports Sci. 1995;13(4):313–320. doi: 10.1080/02640419508732245. [DOI] [PubMed] [Google Scholar]
- 15.Pellegrini B, Schena F. Characterization of arm-gun movement during air pistol aiming phase. J Sports Med Phys Fitness. 2005;45(4):467–475. [PubMed] [Google Scholar]
- 16.Tang WT, Zhang WY, Huang CC, Young MS, Hwang IS. Postural tremor and control of the upper limb in air pistol shooters. J Sports Sci. 2008;26(14):1579–1587. doi: 10.1080/02640410802287063. [DOI] [PubMed] [Google Scholar]
- 17.Lakie M. The influence of muscle tremor on shooting performance. Exp Physiol. 95(3):441–450. doi: 10.1113/expphysiol.2009.047555. [DOI] [PubMed] [Google Scholar]
- 18.Roels H, Abdeladim S, Braun M, Malchaire J, Lauwerys R. Detection of hand tremor in workers exposed to mercury vapor: a comparative study of three methods. Environ Res. 1989;49(2):152–165. doi: 10.1016/s0013-9351(89)80060-x. [DOI] [PubMed] [Google Scholar]
- 19.Hafeman D, Ahsan H, Islam T, Louis E. Betel quid: Its tremor-producing effects in residents of Araihazar, Bangladesh. Mov Disord. 2006;21(4):567–571. doi: 10.1002/mds.20754. [DOI] [PubMed] [Google Scholar]
- 20.Ahsan H, Chen Y, Parvez F, et al. Health Effects of Arsenic Longitudinal Study (HEALS): description of a multidisciplinary epidemiologic investigation. J Expo Sci Environ Epidemiol. 2006;16(2):191–205. doi: 10.1038/sj.jea.7500449. [DOI] [PubMed] [Google Scholar]
- 21.Parvez F, Chen Y, Argos M, et al. Prevalence of arsenic exposure from drinking water and awareness of its health risks in a Bangladeshi population: results from a large population-based study. Environ Health Perspect. 2006;114(3):355–359. doi: 10.1289/ehp.7903. [DOI] [PMC free article] [PubMed] [Google Scholar]
- 22.Pierce BL, Kalra T, Argos M, et al. A prospective study of body mass index and mortality in Bangladesh. Int J Epidemiol. 2009 doi: 10.1093/ije/dyp364. (Epub ahead of print) [DOI] [PMC free article] [PubMed] [Google Scholar]
- 23.Louis ED, Thawani SP, Andrews HF. Prevalence of essential tremor in a multiethnic, community-based study in northern Manhattan, New York, N.Y. Neuroepidemiology. 2009;32(3):208–214. doi: 10.1159/000195691. [DOI] [PMC free article] [PubMed] [Google Scholar]
- 24.Bain PG, Findley LJ, Thompson PD, et al. A study of hereditary essential tremor. Brain. 1994;117(Pt 4):805–824. doi: 10.1093/brain/117.4.805. [DOI] [PubMed] [Google Scholar]
- 25.Deuschl G, Bain P, Brin M. Consensus statement of the Movement Disorder Society on Tremor. Ad Hoc Scientific Committee. Mov Disord. 1998;13(Suppl 3):2–23. doi: 10.1002/mds.870131303. [DOI] [PubMed] [Google Scholar]
- 26.Kalisch T, Wilimzig C, Kleibel N, Tegenthoff M, Dinse HR. Age-related attenuation of dominant hand superiority. PLoS One. 2006;1:e90. doi: 10.1371/journal.pone.0000090. [DOI] [PMC free article] [PubMed] [Google Scholar]
- 27.Raethjen J, Pawlas F, Lindemann M, Wenzelburger R, Deuschl G. Determinants of physiologic tremor in a large normal population. Clin Neurophysiol. 2000;111(10):1825–1837. doi: 10.1016/s1388-2457(00)00384-9. [DOI] [PubMed] [Google Scholar]
- 28.Friedlander WJ. Characteristics of postural tremor in normal and in various abnormal states. Neurology. 1956;6(10):716–724. doi: 10.1212/wnl.6.10.716. [DOI] [PubMed] [Google Scholar]
- 29.Louis ED. Kinetic tremor: differences between smokers and non-smokers. Neurotoxicology. 2007;28(3):569–575. doi: 10.1016/j.neuro.2006.12.006. [DOI] [PMC free article] [PubMed] [Google Scholar]
- 30.Shirlow MJ, Mathers CD. A study of caffeine consumption and symptoms; indigestion, palpitations, tremor, headache and insomnia. Int J Epidemiol. 1985;14(2):239–248. doi: 10.1093/ije/14.2.239. [DOI] [PubMed] [Google Scholar]
- 31.Leakey TE, Elias-Jones AC, Coates PE, Smith KJ. Pharmacokinetics of theophylline and its metabolites during acute renal failure. A case report. Clin Pharmacokinet. 1991;21(5):400–408. doi: 10.2165/00003088-199121050-00007. [DOI] [PubMed] [Google Scholar]
- 32.Lotvall J, Ankerst J. Long duration of airway but not systemic effects of inhaled formoterol in asthmatic patients. Respir Med. 2008;102(3):449–456. doi: 10.1016/j.rmed.2007.10.003. [DOI] [PubMed] [Google Scholar]
- 33.Morgan JC, Sethi KD. Drug-induced tremors. Lancet Neurol. 2005;4(12):866–876. doi: 10.1016/S1474-4422(05)70250-7. [DOI] [PubMed] [Google Scholar]
- 34.Osuntokun BO, Adeuja AO, Schoenberg BS, et al. Neurological disorders in Nigerian Africans: a community-based study. Acta Neurol Scand. 1987;75(1):13–21. doi: 10.1111/j.1600-0404.1987.tb07883.x. [DOI] [PubMed] [Google Scholar]
- 35.Gourie-Devi M, Gururaj G, Satishchandra P, Subbakrishna DK. Prevalence of neurological disorders in Bangalore, India: a community-based study with a comparison between urban and rural areas. Neuroepidemiology. 2004;23(6):261–268. doi: 10.1159/000080090. [DOI] [PubMed] [Google Scholar]
- 36.Li SC, Schoenberg BS, Wang CC, et al. A prevalence survey of Parkinson’s disease and other movement disorders in the People’s Republic of China. Arch Neurol. 1985;42(7):655–657. doi: 10.1001/archneur.1985.04060070045013. [DOI] [PubMed] [Google Scholar]
- 37.Sur H, Ilhan S, Erdogan H, Ozturk E, Tasdemir M, Boru UT. Prevalence of essential tremor: A door-to-door survey in Sile, Istanbul, Turkey. Parkinsonism Relat Disord. 2008 doi: 10.1016/j.parkreldis.2008.03.009. [DOI] [PubMed] [Google Scholar]
- 38.Martinelli P, Gabellini AS, Gulli MR, Lugaresi E. Different clinical features of essential tremor: a 200-patient study. Acta Neurol Scand. 1987;75(2):106–111. doi: 10.1111/j.1600-0404.1987.tb07903.x. [DOI] [PubMed] [Google Scholar]
- 39.Defazio G, Abbruzzese G, Livrea P, Berardelli A. Epidemiology of primary dystonia. Lancet Neurol. 2004;3(11):673–678. doi: 10.1016/S1474-4422(04)00907-X. [DOI] [PubMed] [Google Scholar]