
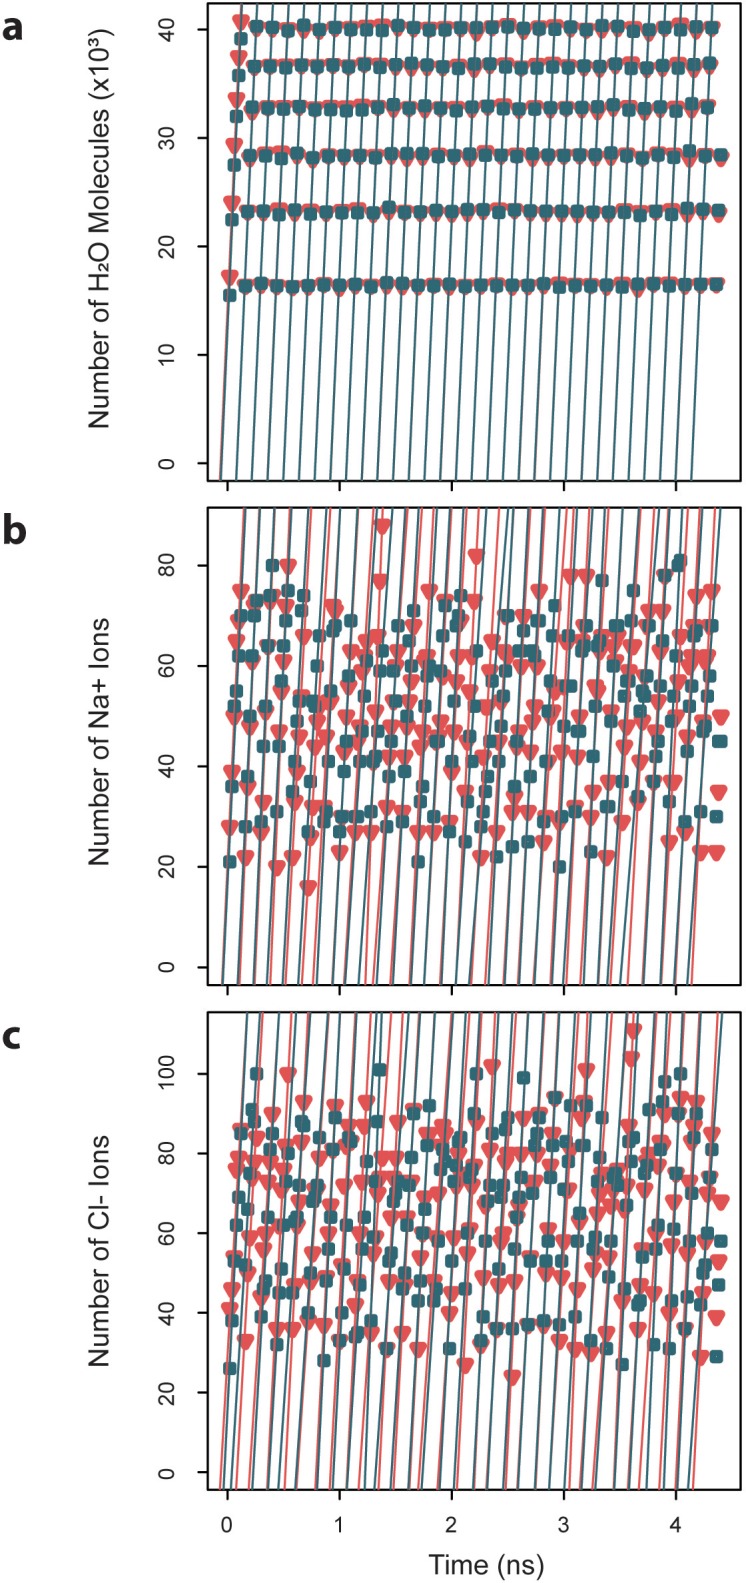
Figure 8. Exchange rates for water and ions crossing the capsid surface.
Cumulative numbers of solvent species moving inward (blue) and outward (red) across the capsid surface over a given segment of simulation time are plotted versus that simulation time, and the slope of the linear fits give the exchange rates, which are reported as averages ± standard deviations. (a) Water molecules exchange at a rate of 4.7×10³ ± 0.03 ns-1 inward and 4.70.04 ns outward. (b) Sodium ions exchange at a rate of 8.40.7 ns-1 inward and 8.5 ± 0.6 ns-1 outward. (c) Chloride ions exchange at a rate of 1.8 ± 0.4 ns-1 inward and 1.7 ± 0.3 ns-1 outward.
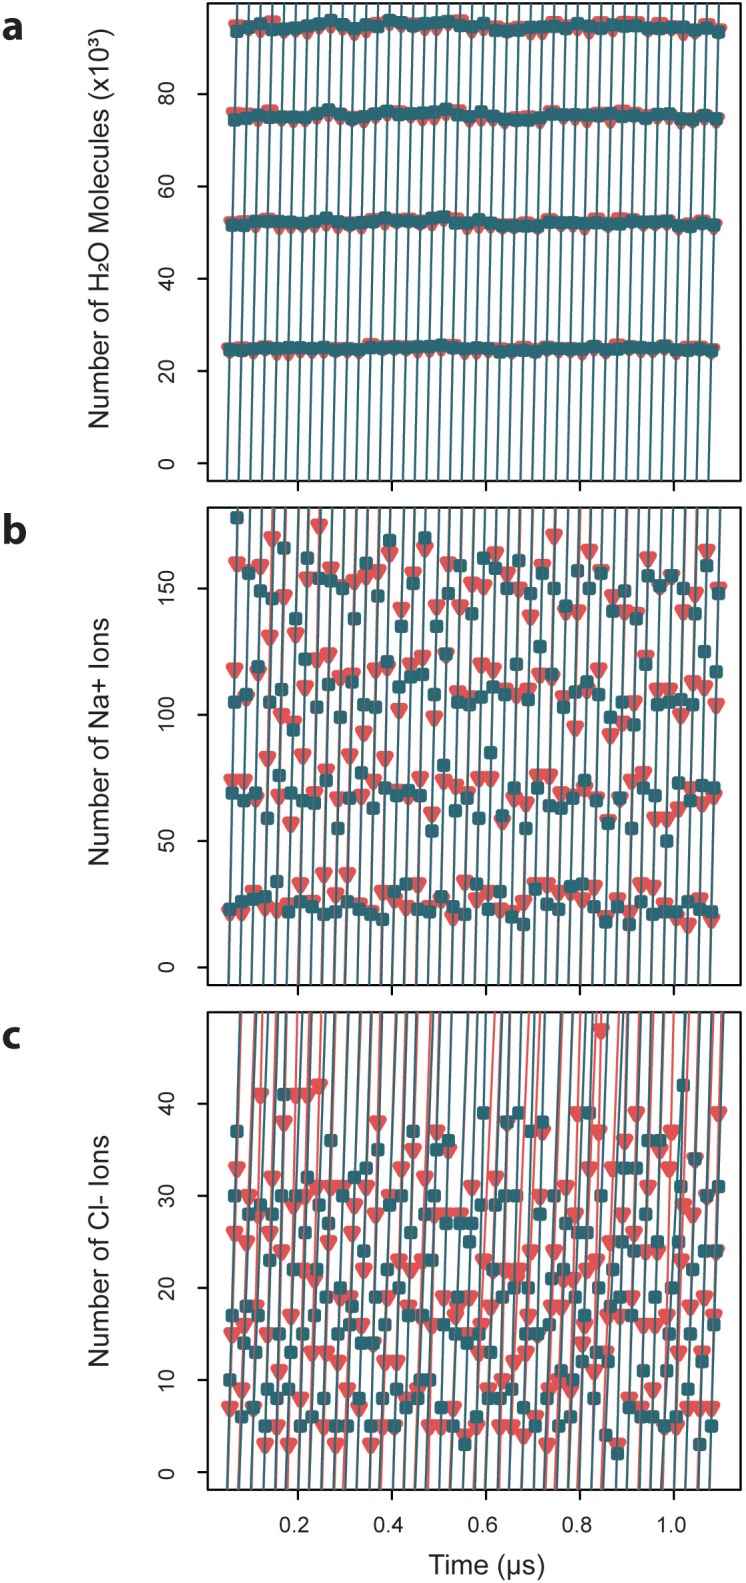
Figure 8—figure supplement 1. Exchange rates for water and ions crossing a spherical surface.
Cumulative numbers of solvent species moving inward (blue) and outward (red) across the spherical surface of radius 145.4 Å over a given segment of simulation time are plotted versus that simulation time, and the slope of the linear fits give the exchange rates, which are reported as averages ± standard deviations. (a) Water molecules exchange at an average rate of 233.1×10³ ± 2.1 ns-1. (b) Sodium ions exchange at an average rate of 412.3 ± 93.3 ns-1. (c) Chloride ions exchange at an average rate of 516.6 ± 121.1 ns-1.