Abstract
Many craniofacial disorders are caused by heterozygous mutations in general regulators of housekeeping cellular functions such as transcription or ribosome biogenesis1,2. Although it is understood that many of these malformations are a consequence of defects in cranial neural crest cells, a cell type that gives rise to most of the facial structures during embryogenesis3,4, the mechanism underlying cell-type selectivity of these defects remains largely unknown. By exploring molecular functions of DDX21, a DEAD-box RNA helicase involved in control of both RNA polymerase (Pol) I- and II-dependent transcriptional arms of ribosome biogenesis5, we uncovered a previously unappreciated mechanism linking nucleolar dysfunction, ribosomal DNA (rDNA) damage, and craniofacial malformations. Here we demonstrate that genetic perturbations associated with Treacher Collins syndrome, a craniofacial disorder caused by heterozygous mutations in components of the Pol I transcriptional machinery or its cofactor TCOF1 (ref. 1), lead to relocalization of DDX21 from the nucleolus to the nucleoplasm, its loss from the chromatin targets, as well as inhibition of rRNA processing and downregulation of ribosomal protein gene transcription. These effects are cell-type-selective, cell-autonomous, and involve activation of p53 tumour-suppressor protein. We further show that cranial neural crest cells are sensitized to p53-mediated apoptosis, but blocking DDX21 loss from the nucleolus and chromatin rescues both the susceptibility to apoptosis and the craniofacial phenotypes associated with Treacher Collins syndrome. This mechanism is not restricted to cranial neural crest cells, as blood formation is also hypersensitive to loss of DDX21 functions. Accordingly, ribosomal gene perturbations associated with Diamond-Blackfan anaemia disrupt DDX21 localization. At the molecular level, we demonstrate that impaired rRNA synthesis elicits a DNA damage response, and that rDNA damage results in tissue-selective and dosage-dependent effects on craniofacial development. Taken together, our findings illustrate how disruption in general regulators that compromise nucleolar homeostasis can result in tissue-selective malformations.
Heterozygous mutations in factors involved in ribosome biogenesis lead to ribosomopathies6, a collection of congenital disorders typically displaying tissue-selective defects, despite the broad requirement for ribosomes across growing tissues. For example, Treacher Collins syndrome (TCS), caused by heterozygous mutations in Pol I cofactor TCOF1 or subunits POLR1D and POLR1C, is characterized by a specific set of craniofacial malformations7. To explore the mechanism by which perturbations in ribosomal gene transcription result in TCS, we focused on DDX21, a nucleolar protein involved in the control of the two transcriptional arms of ribosome biogenesis: (1) synthesis and processing of the rRNA in the nucleolus, and (2) transcription of ribosomal protein genes in the nucleoplasm5. Induction of nucleolar stress by inhibition of Pol I leads to DDX21 relocalization from the nucleolus to the nucleoplasm and to its simultaneous loss from Pol I and Pol II target promoters5. Furthermore, single-cell measurements revealed a strong correlation between the DDX21 nucleolar/nucleoplasmic ratio and pre-rRNA levels, both in unperturbed HeLa cells and in those treated with the Pol I inhibitor CX-5461 (hereafter iPol I) (Fig. 1a, b).
Figure 1. The functions of DDX21 are linked to rRNA synthesis levels and altered by TCS-associated perturbations.
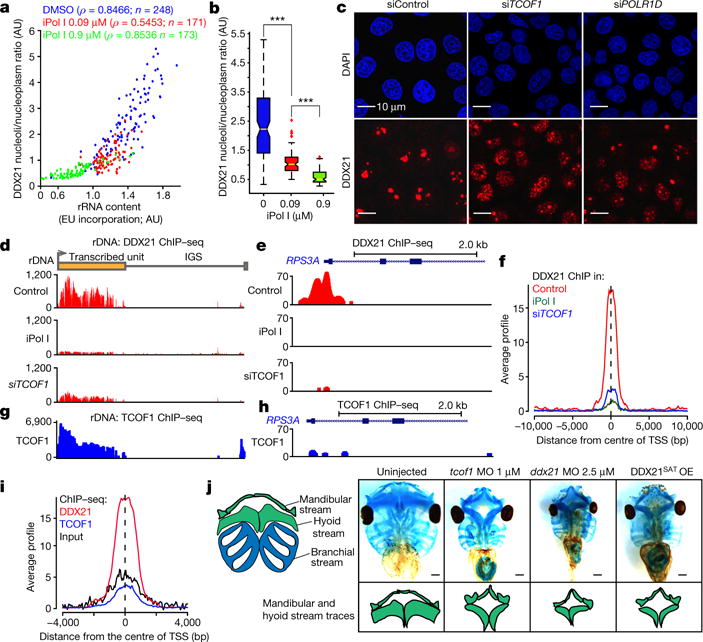
a, b, Quantification of the relationship between DDX21 nucleolar/nucleoplasmic ratio and/or pre-rRNA synthesis after 1 h treatment of HeLa cells with different dosages of iPol I. Cells were collected from n = 3 biologically independent experiments. ρ, Pearson correlation coefficient; EU, 5-ethynyl uridine; AU, arbitrary units. Boxes represent median value and 25th and 75th percentiles, whiskers are minimum to maximum, crosses are outliers. ***P< 0.001, two-sided Wilcoxon–Mann–Whitney test. c, Representative immunofluorescence images depicting DDX21 localization changes upon siRNA-mediated knockdown of TCOF (siTCOF1) or POLRlD (siPOLRlD). n = 3 biologically independent experiments. d, Mapping of DDX21 ChIP–seq reads, from HeLa cells treated with dimethylsulfoxide (DMSO), iPol I, or siTCOF1, to the rDNA locus. e, Genome browser tracks depicting DDX21 ChIP–seq signal, from HeLa cells treated with DMSO, iPol I, or siTCOF1, at the RPS3A locus. f, Average signal profiles of DDX21 ChIP–seq from cells treated with DMSO, iPol I, or siTCOF1. g, TCOF1 ChIP–seq reads mapped to the rDNA locus. h, Genome browser tracks of TCOF1 ChIP–seq signal at the RPS3A locus. i, Average signal profiles comparing DDX21 (same as in f) and TCOF1 ChIP–seq, and background input reads. ChIP–seq has been extensively validated by ChIP–qPCR and in another cell type (data not shown and ref. 5). j, Representative stainings of Xenopus laevis cranial cartilages at stage 49. Traces display the mandibular and hyoid stream defects. MO, morpholino; OE, overexpression. Animals were collected from n = 3 biologically independent experiments.
We asked whether perturbations in TCS-associated genes elicit disruption of DDX21 functions. Downregulation of TCOF1 or POLR1D in HeLa cells (Extended Data Fig. 1b, c) led to relocalization of DDX21 to the nucleoplasm (Fig. 1c and Extended Data Fig. 1d), and this was accompanied by eviction of DDX21 from the rDNA and Pol II target promoters, as determined by chromatin immunoprecipitation followed by sequencing (ChIP–seq) (Fig. 1d–f) and confirmed in independent ChIP–qPCR experiments (Extended Data Fig. 1e, f). Analysis of TCOF1 genomic occupancy showed that although it binds the rDNA (Fig. 1g), unlike DDX21, it does not associate with Pol II promoters (Fig. 1h, i). Even within the nucleolus, DDX21 and TCOF1 may not act as a part of the same complex, as they do not readily co-immunoprecipitate (Extended Data Fig. 2a, b). Taken together, our data suggest that DDX21 can respond to TCOF1 dysfunction indirectly, through a pathway that is sensitive to the status of rRNA synthesis.
TCS craniofacial anomalies originate primarily from diminished allocation of cranial neural crest cells (cNCCs) into the first and second pharyngeal arches3,4,7. If loss of DDX21 from chromatin is an important downstream mediator of TCOF1 and POL1 dysfunction, then first and second arch structures should be sensitive to DDX21 knockdown. To test this, we established Xenopus as a model for TCS. tcof1 knockdown in Xenopus embryos with morpholinos targeting either translation or splicing of tcof1 resulted in hypoplasia and deformation of the mandibular and hyoid stream cartilage structures, which are derived from first and second arches (Fig. 1j and Extended Data Fig. 2c–e), a phenotype consistent with both TCS and published zebrafish phenotypes8–10. Notably, at higher morpholino doses, overall growth defects were evident in tcof1 morphants (Extended Data Fig. 2e). Next, we designed and injected morpholino targeting ddx21. At high doses, this morpholino impeded embryonic growth, but at lower doses we observed craniofacial phenotypes remarkably similar to those seen in tcof1 morphants (Fig. 1j and Extended Data Fig. 2c, e). Furthermore, injection of mRNA encoding a catalytically defective human DDX21 (ref. 11) (DDX21SAT) also faithfully phenocopied TCS craniofacial defects, whereas injection of wild-type DDX21 mRNA had no appreciable effects (Fig. 1j and Extended Data Fig. 2c, e, f). Thus, development of craniofacial structures is hypersensitive to the loss of Ddx21 or its RNA helicase activity. These results were corroborated in zebrafish embryos injected with morpholinos blocking translation of ddx21, where observed craniofacial phenotypes resembled those reported in the polr1d−/− and polr1c−/− models of TCS8–10, and were rescued by the co-injection of human DDX21 mRNA (Extended Data Fig. 2g–j).
Because TCS phenotypes were shown to result from defects in cNCCs9,10,12,13, we investigated whether Tcof1 loss cell-autonomously affects DDX21 functions in cNCCs. We used CRISPR-Cas9 genome editing to generate Tcof+/− and Tcof−/− mouse embryonic stem (ES) cells, which showed no appreciable defect in Ddx21 nucleolar localization (Fig. 2a, left, and Extended Data Fig. 3a). However, upon differentiation into cNCCs, we observed partial relocalization of Ddx21 to the nucleoplasm in Tcof1-mutant, but not in wild-type cells (Fig. 2a, right). This defect was rescued by introduction of an inducible human GFP–tagged TCOF1 construct (GFP–TCOF1) (Fig. 2b and Extended Data Fig. 3b). The severity of the defect was dependent on Tcof1 dosage, with more pronounced nucleolar exclusion observed in Tcof−/− cNCCs (Fig. 2a). Ddx21 relocalization was not observed in embryoid body outgrowths from Tcof1−/− (Extended Data Fig. 3 c), further suggesting cell-type selectivity. We also generated a TCOF1+/− human ES cell line (Extended Data Fig. 3d-f) and observed partial relocalization of DDX21 only after differentiation of TCOF1+/− human ES cells to cNCCs (Extended Data Fig. 3g).
Figure 2. DDX21 deregulation in TCS is both cell-autonomous and cell-type selective.
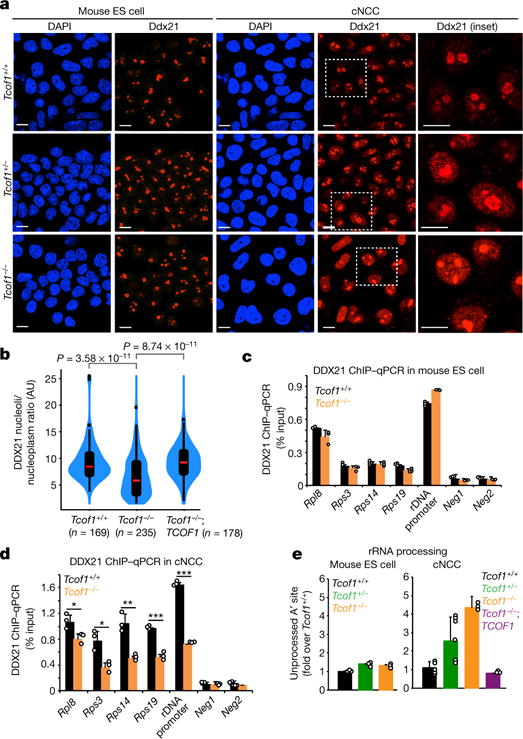
a, Representative immunofluorescence images of DAPI and DDX21 in mouse ES cell and mouse ES cell-derived cNCCs of wild-type, Tcof1+/−, or Tcof1 genotypes. n = 3 biologically independent experiments. Scale bars, 10 μm. b, Violin plots quantifying Ddx21 nucleolar/nucleoplasmic ratio in cNCCs of wild-type, Tcof1−/−, or Tcof1−/− rescued by expression of an inducible human GFP–TCOF1 construct. Cells were collected from three biologically independent experiments. Boxes represent median value (red line) and 25th and 75 th percentiles, whiskers are minimum to maximum, points are outliers. Two-sided Wilcoxon–Mann-Whitney test. c, d, ChIP–qPCR analysis from mouse ES cells and cNCCs sampling Ddx21 genomic occupancy, at a representative panel of Ddx21 targets. e, qPCR analyses examining processing of the 47S rRNA A′ site in mouse ES cells and cNCCs. c–e, Bars represent the average of n = 3 biologically independent experiments; error bars, s.e.m. ***P < 0.001, **P < 0.01, *P < 0.05, two-sided, unpaired t-test.
Consistent with cNCC-selective DDX21 relocalization, we also observed partial loss of DDX21 from rDNA and its Pol II target promoters in Tcof−/− cNCCs, but not in mouse ES cells (Fig. 2c, d). Similar depletion of DDX21 from chromatin occurred in human TCOF+/− cNCCs (Extended Data Fig. 3h) and was accompanied by down-regulation of DDX21-bound Pol I and Pol II target genes (Extended Data Fig. 3i). In addition to transcription, DDX21 is also required for rRNA processing5,14 through its interaction with both rRNA and small nucleolar RNAs (snoRNAs). Pol I inhibition disengaged DDX21 from both the 5′ external transcribed spacer, a site of processing in the rRNA, and from the snoRNAs (Extended Data Fig. 4a–e). Accordingly, Tcof1-mutant cells also display cell-type-selective impairment of the 5′ external transcribed spacer processing, specifically cleavage of the A′ site, which is one the first events during maturation of the 18S rRNA and only accumulates when rRNA processing is defective (Fig. 2e). Accumulation of unprocessed A′ site was both dosage-dependent and rescued by GFP–TCOF1 overexpression (Fig. 2e). Taken together, our results demonstrate that TCOF1 mutations result in cell-type-selective and cell-autonomous perturbations of DDX21 functions in cNCCs.
In addition to rRNA synthesis and processing defects15, TCS is also characterized by nucleolar stress-mediated activation of p53 (refs 10, 16). Accordingly, we observed upregulation of the canonical p53 target Cdknla (p21) in Tcof1-deficient mouse and TCOF1-deficient human cNCCs (Extended Data Fig. 5a, b). Treatment of wild-type cNCCs with NSC146109, a small molecule that promotes p53 stabilization17,18 (Extended Data Fig. 5c), resulted in DDX21 relocalization (Fig. 3a, b) and concomitant inhibition of rRNA synthesis (Fig. 3c), suggesting that p53 activation is sufficient to induce DDX21 nucleolar exclusion. This is also true in vivo, as dorsal-anterior neural tubes of mouse embryos with the neural-crest-specific knockout of Mdm2 (Wntl-cre;Mdm2fl/fl) showed relocalization of DDX21 only in those cells containing high levels of p53, corresponding to the developing cNCCs (Fig. 3d and Extended Data Fig. 5d).
Figure 3. Selective sensitivity of cNCCs to p53 activation (act.) and DDX21 levels.
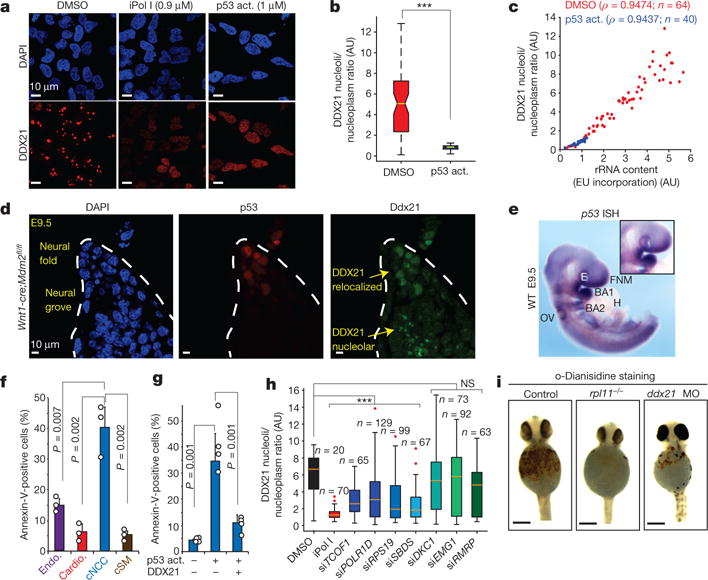
a, Representative immunofluorescence images of DAPI and DDX21 stainings in human cNCCs treated with DMSO, iPol I or the p53 activator (NSC146109). n = 3 biologically independent experiments. b, c, Quantification of DDX21 nucleolar/nucleoplasmic ratio (b) and the relationship between rRNA synthesis and DDX21 localization (c) in cNCCs after 12 h treatment with DMSO or NSC146109. Cells were collected from three biologically independent experiments. Boxes represent median value and 25th and 75th percentiles, whiskers are minimum to maximum. ***P < 0.001, two-sided Wilcoxon–Mann–Whitney test. d, Immunofluorescence staining of p53 and DDX21 in sections from the dorsal neural tube of Wnt1-cre;Mdm2fl/fl embryonic day (E)9.5 mouse embryos. Dotted lines represent the neural fold. n = 5 independent animals per genotype. e, Representative picture of whole-mount in situ hybridization (ISH) for p53 mRNA in E9.5 embryos. Inset highlights the first brachial arch (BA1). WT, wild type; E, eye; FNM, frontonasal mass; H, heart; OV, otic vesicle. n = 4 independent animals. f, Differentiation of human ES cells into the indicated cell types (Endo., endothelial cells; Cardio., cardiomyocytes; cSM, cNCC-derived smooth muscle). Sensitivity to p53-mediated apoptosis after treatment with NSC146109 for 12–16 h was quantified by fluorescence-activated cell sorting (FACS). Bars are from n = 3 biologically independent experiments; error bars, s.e.m. g, Human cNCC wild type or overexpressing GFP–DDX21 were treated with NSC146109, followed by FACS analyses of annexin V staining. Bars are from n = 4 biologically independent experiments; error bars, s.e.m. For f and g P values, two-sided, unpaired t-test. h, Box plot represents quantification of DDX21 nucleolar/nucleoplasmic ratio for indicated siRNAs. Boxes represent median value and 25th and 75th percentiles, whiskers are minimum to maximum, crosses are outliers. ***P < 0.001, two-sided Wilcoxon–Mann–Whitney test. NS, not significant. Cells were collected from three biologically independent experiments. i, Haemoglobin staining with o-dianisidine of control, rpl11−/−, and ddx21 morpholino-injected zebrafish embryos at 24 h postfertilization. Embryos were collected from n = 3 independent matings.
Despite a broad function of p53 as a stress sensor, stabilizing p53 mutations lead to specific craniofacial defects in mice19. We investigated whether p53 mRNA levels are elevated in the developing cNCCs, which could result in a larger reservoir of the translated product being available for stabilization upon stress, when the E3 ligase-mediated degradation of p53 is no longer the limiting regulatory step. Though p53 mRNA is broadly expressed throughout the mouse embryo, substantially higher levels are detected in the neural tube and craniofacial region, especially the first arch (Fig. 3e and Extended Data Fig. 5e–g). Furthermore, elevated p53 mRNA levels have previously been observed in the dorsal neural tubes of chick embryos before the onset of cNCC emigration20. This elevated expression could potentially contribute to the sensitivity of cNCCs and craniofacial development to p53 activity upon stress, although other mechanisms may also be at play. Regardless, Wnt1-cre;Mdm2fl/fl embryos showed hypoplasia of the first and second pharyngeal arches, confirming that these facial structures are sensitive to p53 stabilization (Extended Data Fig. 6).
To directly address whether human cNCCs are more sensitive to p53 stabilization than other embryonic cell types, we differentiated human ES cells into endothelial cells, cardiomyocytes, and cNCCs, and further differentiated cNCCs to smooth muscle cells. Quantification of apoptosis after parallel treatment of this isogenic set of cell types with NSC146109 revealed the highest sensitivity of cNCCs (Fig. 3f). This effect was not due to changes in DDX21 protein level among the different cell types (Extended Data Fig. 7a). Moreover, loss of one TCOF1 allele exacerbated this sensitivity (Extended Data Fig. 7b).
We next investigated whether disruption of DDX21 underlies cNCC sensitivity to p53. Indeed, induction of DDX21 overexpression partly rescued cNCC sensitivity to p53 activation (Fig. 3g). Moreover, overexpression of DDX21 mRNA rescued the cranial cartilage defects associated with Tcof1 dysfunction in Xenopus embryos to a similar extent as TCOF1 mRNA or p53 knockdown (Extended Data Fig. 7c, d). Consistently, overexpression of DDX21 in TCS cNCCs rescued DDX21 nucleolar localization and chromatin association (Extended Data Fig. 7e, f). Thus, preventing DDX21 loss from nucleolus and chromatin suppresses sensitivity of cNCCs to apoptosis and developmental defects associated with TCS.
Given that nucleolar stress and p53 activation are hallmarks of many ribosomopathies6, we reasoned that DDX21 dysfunction could contribute to these disorders. To explore this, we performed a small-scale short interfering RNA (siRNA) screen in HeLa cells to assess DDX21 nucleolar localization upon knockdown of a subset of ribomosopathy-associated genes (Fig. 3h and Extended Data Fig. 7h, g). We observed that knockdown of genes implicated in TCS, Diamond-Blackfan anaemia (RPS19) and Shwachman–Diamond syndrome (SDS) caused DDX21 relocalization, while others had no effect (Fig. 3h). Although patients with Diamond–Blackfan anaemia and Shwachman-Diamond syndrome develop craniofacial/skeletal deformities, these syndromes are characterized primarily by bone marrow dysfunction1,6. To test whether loss of DDX21 results in anaemia, we performed haemoglobin stainings of ddx21 zebrafish morphants. Similar to embryos derived from the rpl11−/− zebrafish model of Diamond–Blackfan anaemia21, ddx21 morphants were anaemic (Fig. 3i and Extended Data Fig. 7i), suggesting that hypersensitivies to loss of DDX21 exist beyond the craniofacial development and may contribute to the pathogenesis of multiple ribosomopathies.
TCOF1 dysfunction has also been linked to elevated DNA damage22. To explore potential relationships between Pol I transcriptional stress, DNA damage, and DDX21, we examined induction of γH2A.X in TCOF1+/− cNCCs, in cNCCs treated with iPol I or low levels of actinomycin D, and in HeLa cells treated with iPol I. In all cases, we observed elevated γH2A.X signals in a subset of cells (Extended Data Fig. 8a–g).
DNA damage induction in response to Pol I inhibition also occurs in vivo, as we detected elevated γH2A.X signals in polrld−/− and polr1c−/− zebrafish embryos at 24 h post-fertilization (Fig. 4a). The staining was more pronounced in the anterior parts of the embryo, but also evident in non-cranial tissues (Fig. 4a). However, the severity of cranial cartilage malformations was correlated with the γH2A.X signals (Fig. 4a–c).
Figure 4. rDNA damage induces DDX21 relocalization and impairs craniofacial development.
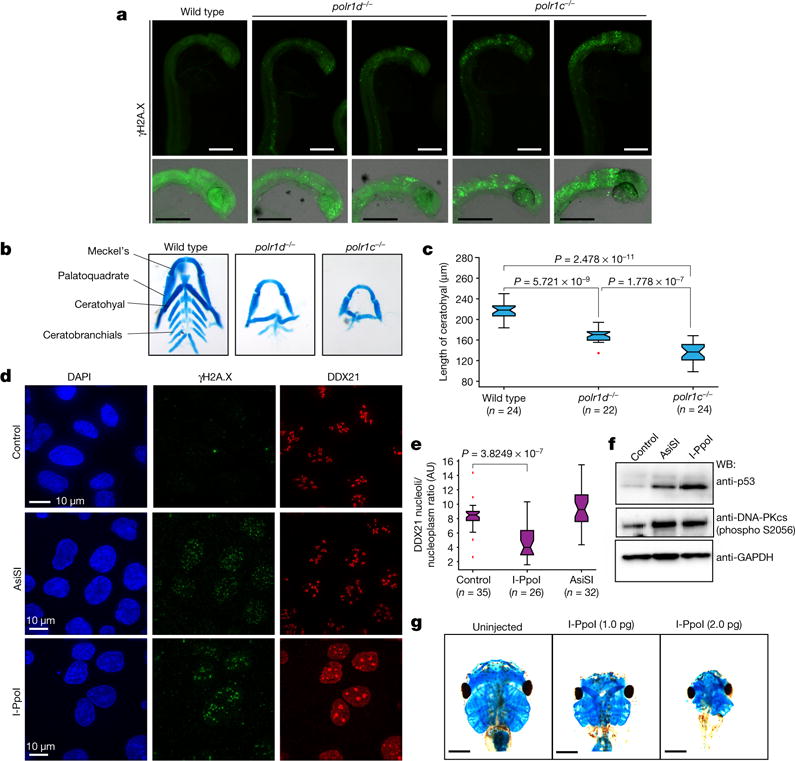
a, Representative γH2A.X staining of wild-type, polr1d−/−, and polr1c−/− zebrafish embryos. Embryos were stained from n = 3 independent matings. b, Representative images of dissected wild-type, polr1d−/−, and polr1c−/− zebrafish craniofacial cartilages. Embryos were collected and stained from n = 3 independent matings. c, Box plot depicting the length of the ceratohyal cartilage of wild-type, polr1d−/−, and polr1c−/− zebrafish embryos. Boxes represent median value and 25th and 75th percentiles, whiskers are minimum to maximum, crosses are outliers. P values, two-sided Wilcoxon–Mann–Whitney test. d, Representative immunofluorescence of U2OS expressing or not AsiSI or I-PpoI from n = 4 biologically independent experiments. e, Box plot quantifying DDX21 nucleolar/nucleoplasmic ratio in cells expressing AsiSI or I-PpoI. Boxes represent median value and 25th and 75th percentiles, whiskers are minimum to maximum, crosses are outliers. P values, two-sided Wilcoxon–Mann–Whitney test. f, Representative western blots from cells expressing or not AsiSI or I-PpoI for 4 h from n = 3 independent biological experiments. g, Representative stainings of Xenopus cranial cartilages from embryos injected with different dosages of I-PpoI mRNA from n = 4 biologically independent experiments.
We hypothesized that rDNA damage caused by Pol I transcriptional stress may be a trigger for p53 activation and DDX21 relocalization. To test this, we used tamoxifen-inducible U2OS lines expressing either I-PpoI, an endonuclease which preferentially cleaves the rDNA23,24, or AsiSI, which causes DNA damage outside rDNA25. Consistently, the γH2A.X signal was predominantly perinucleolar in I-PpoI-treated cells, and nucleoplasmic in AsiSI-treated cells (Fig. 4d). Only cells expressing I-PpoI relocalized DDX21(Fig. 4d, e). Furthermore, although both I-PpoI and AsiSI induced auto-phosphorylation of DNA-dependent protein kinase catalytic subunit (pDNA-PKcs) and stabilized p53 (Fig. 4f), rDNA damage induced p53 protein to higher levels (Fig. 4f), despite overall higher γH2A.X levels in AsiSI-treated cells (Extended Data Fig. 8k). Single-cell analysis revealed that p53 stabilization is much more correlated with the number of the DNA damage foci in I-PpoI than in AsiSI-treated cells, suggesting an intricate link between the rDNA damage and p53 stabilization (Extended Data Fig. 8h–j).
We next investigated temporal relationships and dependencies between Pol I inhibition, DNA damage signalling, and DDX21 relocalization. We observed a gradual increase in pDNA-PKcs within 15–30 min of iPol I treatment, coinciding with timing of DDX21 relocalization (Extended Data Fig. 9a–c). Inhibition of DNA-PKcs and ataxia–telangiectasia mutated (ATM) abolished the displacement of DDX21 from the nucleolus upon rDNA damage (Extended Data Fig. 9d, e). We also observed a reciprocal dependency, as knockdown of DDX21 resulted in elevated pDNA-PKcs (Extended Data Fig. 9f), consistent with a cross-talk between DDX21, DNA damage, and Pol I transcription26.
If rDNA damage contributes to TCS pathology, it would suggest that even a general insult such as rDNA damage can result in tissue-selective phenotypes. We leveraged that I-PpoI cleavage site is conserved in Xenopus rDNA and injected various amounts of I-PpoI mRNA into Xenopus embryos. Overall growth and morphology of the resulting tadpoles appeared relatively unaffected with exception of the head development (Extended Data Fig. 9g). However, analysis of the cranial cartilage showed that low doses of I-PpoI mRNA result in phenotypes resembling those seen in TCS and upon ddx21 knockdown (Fig. 4g). At higher doses, we observed a more severe and highly variable spectrum of phenotypes that were predominantly limited to the head region, although an overall effect on growth was also evident (Fig. 4g and Extended Data Fig. 9h).
Because craniofacial development is selectively sensitive to rDNA damage, our results suggest that phenotypic variability observed in patients with TCS with the same mutation might be due, among other factors, to variable levels of rDNA damage resulting from in utero exposure, genetic modifiers, and/or stochastic events. Furthermore, various genetic and/or environmental perturbations leading to defects in rRNA synthesis and rDNA damage will probably be associated with craniofacial malformations (Extended Data Fig. 10). In this context, our results provide a unified molecular framework that has the potential to explain, at least in part, why craniofacial malformations are very common, often arise through mutations in generic regulators, and show high sensitivity to environmental modulation and phenotypic variability among affected individuals.
METHODS
Summary
HeLa cells were cultured in DMEM 10% FBS and maintained under standard tissue culture conditions unless otherwise specified. Mouse ES cells were cultured in 2i medium as previously described (see Methods). H9 human ES cells were maintained feeder-free and cultured in mTESR-1 (Stem Cell Technologies). U2OS cells were maintained in phenol-free DMEM supplemented with 10% Tet-free FBS. ChIP–seq and ChIP–qPCR analyses were conducted with commercially available antibodies described in the Methods sections. Nascent rRNA synthesis was performed using a Click-iT Nascent RNA Capture Kit (Thermo Fisher Scientific) following the manufacturer’s instructions. For immunofluorescence studies, cells were fixed with 4% paraformaldehyde and/or methanol, unless otherwise specified, and stained with the indicated antibodies. Small-molecule treatments with DMSO, actinomycin D, or CX-5461 (Tocris) were done for 1 h, unless otherwise specified. Treatments with NSC146109 (Tocris), and DNAPK (Tocris, NU 7441) and ATM inhibitors (Tocris, KU 55933), were performed at the indicated time points in the figure legends. For annexin V staining, we used an Annexin V/Dead Cell Apoptosis Kit (Thermo Fisher Scientific) as recommended by the manufacturer. All animal work was done in accordance with the Stanford University Administrative Panel on Laboratory Animal Care. Zebrafish lines were housed in AAALAC-approved facilities and maintained according to protocols approved by the Massachusetts Institute of Technology Committee on Animal Care.
Cell lines
HeLa cells were obtained from American Type Culture Collection (ATCC) and grown under standard conditions in DMEM 10% FBS supplemented with antibiotics. U2OS cells were also obtained from ATCC and maintained in phenol-free DMEM supplemented with 10% Tet-free FBS. Human ES cells (H9 line) were obtained from WiCell, maintained and expanded feeder-free, and cultured in mTESR-1 (StemCell Technologies). Cells were passaged approximately 1:6 every 5–6 days with ReLeSR (StemCell Technologies) onto tissue culture dishes coated with growth-factor-reduced matrigel (BD Biosciences). Mouse ES cells were cultured in 2i medium as previously described27. All cell lines used in this study were mycoplasma-free.
Vectors and plasmids
For generating GFP–TCOF1 and GFP–DDX21 expression vectors, gBlocks gene fragment (IDT) encoding the human TCOF1 and DDX21 coding region were synthetized and cloned into a GFP-expressing and tetracycline-inducible PiggyBac vector (SBI). The PiggyBac was stably integrated into pluripotent cells and several clones were expanded for further analyses. For generation of the cNCCs, we used our previously published protocol28,29 (described below). To express the transgenes, doxycycline was added to the medium at a concentration of 2.5 μg ml−1 for 24–48 h. For the generation of Tcof1 mutant ES cells and mouse ES cells, single guide RNAs (sgRNAs) were developed at http://crispr.mit.edu/ and cloned into the PX458 vector (Addgene, 48138). Cells were transfected with Lipofectamine 2000 (Life Technologies), and sorted on the basis of GFP The resulting clones were expanded and screened by PCR to search for Tcof1 loss-of-function alleles. I-Ppol construct (Addgene, 32565) was developed in M. Kastan’s laboratory. AsiSI was synthetized as a gBlock gene fragment (IDT).
Differentiation of pluripotent cells into cNCCs and other lineages
Pluripotent lines were differentiated into cNCCs as previously described28,29. In brief, human ES cells/mouse ES cells were incubated with 5 mg ml−1 collagenase (Life Technologies) for 1 h. Clusters of 100–200 cells were generated by manual pipetting and plated in a Petri dishes (BD Biosciences) containing cNCC differentiation medium (see methods in ref. 29 for details). The medium was changed every other day for 7 days or until the neuroepithelial spheres attached, before the induction and emigration of the cNCCs. To further purify the cNCCs, cells were dissociated with Accutase (Life Technologies) and passaged onto fibronectin-coated (Thermo Fisher Scientific) plates. cNCCs were then transitioned to maintenance media (see methods in ref. 29 for details). For propagating, cNCCs were passaged onto fibronectin-coated plates every three days. After two passages, they were transitioned to cNCC long-term maintenance medium (see methods in ref. 29 for details). For differentiation into smooth muscle cells, cNCCs were cultured in DMEM (Thermo Fisher Scientific) supplemented with 10% FBS (Omega). Differentiation of pluripotent cells into endothelial30 cells and cardiomyocytes31 has been previously described by Wu’s laboratory at Stanford University. Embryoid body differentiation was performed as previously described27.
ChIP–qPCR and ChIP–seq
ChIP assays were performed as previously described5. In brief, cells were cross-linked with 1% formaldehyde for 10 min and quenched with glycine to a final concentration of 0.125 M for another 10 min. Chromatin was sonicated with a Bioruptor (Diagenode), cleared by centrifugation, and incubated overnight at 4 °C with 7.5 μg of the desired antibodies: anti-DDX21 (Novus Biologicals BP100-1781), anti-TCOF1 (Novus Biologicals NBP1-86909). Immunocomplexes were immobilized with 100 μl of Protein G Dynal magnetic beads (Life Technologies) for 4 h at 4 °C, followed by stringent washes and elution. Eluates were reverse cross-linked overnight at 65 °C and de-proteinated with proteinase K at 56 °C for 30 min. DNA was extracted with phenol–chloroform, followed by ethanol precipitation. ChIP–seq libraries were prepared according to the NEBNext protocol and sequenced using Illumina HiSeq 2500. ChIP–qPCR analyses were performed in a Light Cycler 480II machine (Roche). ChIP–qPCR signals were calculated as the percentage of input. All primers used in qPCR analyses are shown in Supplementary Table 1.
ChIP–seq analyses
Sequences were mapped to the respective genomes using Bowtie2 and analysed by QuEST and MACS2. For QuEST, ChIP–seq peaks were determined using a kernel density estimate bandwidth of 30, a ChIP candidate threshold of = 20, a ChIP extension fold enrichment of 3, and a ChIP–to-background fold enrichment of 3. WIG files were generated with QuEST and used for visualization in the University of California, Santa Cruz (UCSC) Genome Browser. Average ChIP–seq signal profiles around the centre of DDX21 ChIP–seq peaks were generated with the Sitepro tool.
All genomic datasets have been deposited in the Gene Expression Omnibus under accession number GSE89420: https://www.ncbi.nlm.nih.gov/geo/query/acc.cgi?token=abcjeymyvbkrnap&acc=GSE89420.
Mapping ChIP signal to rDNA locus
For mapping ChIP–seqs to the rDNA locus, we obtained the DNA consensus sequence of the 43 kb ribosomal locus NCBI (GeneBank accession number U13369.1). Using this unique 43 kb region, we used the Bowtie algorithm to map ChIP–seq reads with standard parameters used for mapping to the Hg19 human genome build (see methods in ref. 5 for details).
RNA extraction and RT-qPCR
RNA was isolated using TRIzol (Life Technologies) and an RNAeasy mini kit (Qiagen) according to the manufacturer’s protocol. All RNA samples were DNase treated in column (Qiagen). cDNA was generated using Sensifast (Bioline) according to the manufacturer’s instructions. qPCR analyses were performed on a Light Cycler 480II (Roche). All primer sequences can be found in Supplementary Table 1.
Immunofluorescence
Cells were seeded into 24-well plates containing glass cover slips. For HeLa cells, mouse ES cells, and cNCCs, cover slips were coated with fibronectin and cultured for 16 h before treatment. After this, cells were treated for the indicated drugs (refer to the corresponding figure legends for drug concentration and timescale of the experiment). Cells were fixed in 4% PFA for 10 min at room temperature, washed three times for 5 min with PBS. For methanol fixation, after PFA fixation, cells were incubated with ice-cold methanol 2 min and washed twice for 5 min with PBS. Cells were permeabilized in PBS containing 0.3% (v/v) Triton X-100 for 5 min, and blocked overnight at 4 °C in PBT buffer (PBS with 1% bovine serum albumin (BSA), 0.1% Triton X-100 (v/v), 0.05% sodium azide (w/v)). After blocking, coverslips were incubated in PBT with the corresponding antibody. For DDX21 (Novus Biologicals NBP1-83310), TCOF1 (Novus Biologicals NBP1-86909), γH2A.X (Abcam ab11174-50ug), and p53 (Vector Laboratories VP-P953), all antibodies were diluted 1:100 and incubated at room temperature for at least 2 h. Alexa Fluor 488, 568, and 647 secondary antibodies (1:1,000; Life Technologies) for 1 h. Cells were washed three times for 5 min with PBT, twice for 5 min with PBS, rinsed briefly with water, and mounted onto glass slides using VECTASHIELD mounting medium with DAPI. All images were taken and processed using a Zeiss LSM700 confocal microscope.
Western blots and co-immunoprecipitation
Nuclear extracts were prepared according to the Dignam and Roeder protocol32. For immunoprecipitations, extracts were incubated overnight with 3–5 μg of the desired antibody pre-bound to Protein G Sepharose (Pierce). In some cases, protein extracts were treated with RNaseA (20 μg ml−1). Immunocomplexes were eluted in 2× Laemmli buffer and resolved in a 4–20% pre-casted tris-glycine gel (Life Technologies). For western blots, the following antibodies were used according to the manufacturer’s instructions: anti-GFP (Thermo Fisher Scientific A-6455), anti-TCOF1 (Novus Biologicals NBP1-86909 and Abnova H00006949-B01P), anti-Flag (Sigma-Aldrich), anti-DDX21 (Novus Biologicals NB100-1781), anti-p53 (Vector Laboratories VP-P953), anti-ACTIN (Abcam ab49900). All antibodies had been previously validated unless otherwise specified.
siRNA and antisense oligonucleotide knockdown
For knockdowns, HeLa cells were plated at a defined density (2.5 × 10⁵) and transfected in DMEM supplemented with 5% FBS without antibiotics using RNAiMAX (Life Technologies) with 20 nM of the desired pools of siRNA. siRNA diced pools were generated in J.W.’s laboratory using recombinant Giarda lamblia Dicer.
Xenopus embryology
X. laevis embryos were staged in accordance with standard procedures33. For knockdowns, morpholinos were injected into both blastomeres of two-cell-stage embryos at the indicated final concentrations. Embryo viability was scored throughout development to the tadpole stage. To make inferences about the observed phenotypes and determine the appropriate dosages, we conducted pilot experiments for each individual morpholino or in vitro transcribed RNA. We then determined the concentration at which the phenotypic variability was minimized within the sample and at the same time had minimal impact on the viability of the embryos. Once the dosages were determined, all embryos that survived were scored. No randomization of the sample or blinding were applied. No statistical methods were used to predetermine sample size. The 5′-capped and 3′-tailed mRNAs were synthesized with a Message Machine Ultra kit (Ambion) and injected along with the indicated morpholino at the two-cell stage. For phenotypic analyses of craniofacial defects, stage 49 embryos were stained with alcian blue as previously described28. The I-PpoI construct was deposited in Addgene (32565) by M. Kastan’s laboratory. For injections, I-PpoI was amplified (see Supplementary Table 1 for oligonucleotides), followed by in vitro transcription using Message Machine Ultra kit (Ambion) and injected at the indicated concentrations.
Mouse husbandry
All mouse work was done in accordance with the Stanford University Administrative Panel on Laboratory Animal Care. Mice were maintained on a mixed 129/Sv-C57BL/6 background. The Wnt1-cre transgene and Mdm2flox alleles have been described previously34,35. To obtain embryos, mice were mated overnight and the day a vaginal plug was observed was considered E0.5. Yolk sac DNA, extracted using the HotSHOT method36, was used for genotyping.
Neural tube immunofluorescence
Mouse embryos were fixed in 4% PFA overnight at 4 °C, dehydrated in ethanol, paraffin embedded, and sectioned at 5 μm. For immunofluorescence, antigen retrieval was performed in citrate buffer (10 mM sodium citrate, pH 6.0, 0.05% Tween 20; 5 min at ‘high pressure’ in a pressure cooker) and slides were permeabilized with Tris-buffered saline containing 0.025% Triton X (TBS-TX). Blocking was performed for 1 h at room temperature with 10% goat serum and 1% BSA in TBS-TX. Primary antibody incubations were performed overnight at 4 °C and secondary antibody incubations for 1 h at room temperature. The following antibodies were used and were diluted in 1% BSA in TBS-TX: mouse anti-p53 (1C12, Cell Signaling, 1:300), rabbit anti-DDX21 (NB100-1718, Novus, 1:100), fluorescein goat anti-rabbit (FI-1000, Vector Labs, 1:200), and Alexa Fluor 546 goat anti-mouse (A-11030, Thermo Fisher Scientific, 1:200).
Whole-mount in situ hybridization
In brief, embryos were collected in cold PBS and immediately fixed in 4% paraformaldehyde/PBS overnight at 4 °C. Embryos were then dehydrated in methanol and bleached in a methanol/H2O2 (5:1) solution for 5 h at room temperature. Then embryos were rehydrated in PBS-T (0.1% Tween 20/PBS) before being incubated in a proteinase K solution (10 mg ml−1 in PBS) for 15 min at room temperature and fixed in 0.2% glutaraldehyde/4% paraformaldehyde/PBS solution for 20 min at room temperature. Embryos were then incubated for 2 h at 65 °C in the hybridization solution (composed of 2% Blocking Powder (Roche), 50% formamide (Sigma-Aldrich), 5× SSC (Sigma-Aldrich), 0.1% CHAPS (Sigma-Aldrich), 5 mM EDTA (Sigma-Aldrich), 0.1% Triton X-100 (Fisher) to which was added yeast tRNA (Sigma-Aldrich, 1 mg ml−1) and Heparin (Sigma-Aldrich, 50 g ml−1)). After this step, the solution was replaced and the digoxigenin-labelled mRNA probe against p53 (Genebank, AB021961.1) added to the hybridization solution. Embryos were incubated in this solution overnight at 65 °C. The next day, embryos were first washed in 50% formamide, 1× SSC, and 0.1% Tween 20, then they were washed several times in MABT (20 mM malic acid, 30 mM NaCl, 0.1% Tween 20) before being incubated for 2 h at room temperature in the blocking solution (2% Blocking Powder, 20% Inactivated Lamb Serum (Gibco) in MABT). Blocking solution was then diluted by half in MABT and the anti-digoxigenin antibody (Roche, 1/4,000) was added. Embryos were incubated in the antibody solution overnight at 4 °C. Embryos were next washed for 2 days in MABT before proceeding to the revealing using BM Purple (Roche).
Image processing/analysis
All image analysis was performed using custom-written MATLAB scripts. For all images, the nuclear mask was generated by performing segmentation on DAPI images as follows. log-transformed images were convolved with a rotationally symmetric Laplacian of Gaussian filter, and objects were defined as contiguous pixels exceeding a threshold filter score calculated by Otsu’s method. Specifically, for cNCC, a special segmentation method was used to de-clump the cells that clustered together and the poorly de-clumped cells were discarded for downstream analysis. In brief, a hierarchical watershed transform was performed where cells that had different levels of overlaps were separated by watershed with different parameters and the joint masks were defined to maximally separate the cells. Raw images were then subtracted with background signal defined by the average pixel intensity of the non-masked regions in the whole image, and all the following image analyses were done with background-subtracted images.
For nucleolus segmentation, a custom-written MATLAB function was implemented to reliably segment out the nucleoli regions from each individual cell by leveraging some or all main features of nucleoli in DAPI staining, including (1) low intensity of DAPI staining; (2) frequent appearance of DAPI high ridges surrounding nucleoli (separate nucleoli from Cajal bodies); (3) circularity (that nucleoli tend to be rounded). For each different cell type, four parameters were tuned to reach the maximum level of detection while limiting the false segmentation level.
For quantification of DDX21 shuttling, the ratio between the mean intensity of DDX21 signal within the defined nucleolar mask and the mean intensity of DDX21 signal within the nucleoplasmic mask (nuclear mask – nucleolar mask) was calculated for each individual cell.
For rRNA content quantification, the mean intensity of 5-ethynyl uridine staining within the defined nucleolar mask was calculated for each individual cell and a ratio-metric measurement performed to normalize the rRNA content to the mRNA content, where the nucleoli mean 5-ethynyl uridine intensity was divided by the nucleoplasmic 5-ethynyl uridine staining mean intensity for each individual cell.
For DNA damage analysis, a custom-written MATLAB function was implemented to segment out the γH2A.X puncta. In brief, puncta were segmented by tophat filter and only those above the 75th percentile intensity of all puncta were called γH2A.X foci. Each focus was then assigned with the nuclear mask identified with previous method and the number of foci/nuclei were then calculated. In particular, the perinucleolar γH2A.X foci were defined by the foci identified above within a perinucleolar ring mask defined by a dilated nucleoli mask subtracting the nucleoli mask. See Supplementary Fig. 2 for details about the masks and segmentation methods.
Zebrafish embryology
Zebrafish polr1c+/−, polr1d+/−, and rpl11+/− were obtained from the Zebrafish International Resource Centre. For crosses, we performed pilot experiments to determine that the published phenotypes were observed at the expected Mendelian ratios. Injection of ddx21 morpholino or mRNA was performed on one-cell-stage zebrafish embryos at the indicated concentrations. Injected embryos were incubated at 28 °C. To make inferences about the observed phenotypes and to determine the appropriate dosages, we conducted pilot experiments for ddx21 morpholino or in vitro transcribed RNA. We then determined the concentration at which the phenotypic variability was minimized within the sample and at the same time had minimal impact on the viability of the embryos. Once the dosages were determined, all embryos that survived were scored. For cartilage staining with alcian blue, embryos were collected 5 days post-fertilization. Alcian blue staining was performed as described10. For haemoglobin staining with o-dianisidine and immunofluorescence, embryos were collected 24 h post-fertilization. o-Dianisidine staining was performed as described21. The sequence of ddx21 morpholino was ATTCTGGGAGACTCTTTGACGGCAT. DDX21 mRNA was transcribed from PCR products using a T7 mMessage Ultra Kit (Thermo Fisher Scientific) and purified using a MegaClear Kit (Thermo Fisher Scientific). For γH2A.X immunofluorescence, fish of the indicated genotypes were harvested 24 h post-fertilization, fixed in 4% PFA diluted in PBS overnight, washed three times with 0.1% Tween-20 in PBS (PBS-T), and blocked with 1% BSA in PBS-T (PBS-TA) for 3 h. Embryos were stained in PBS-TA with zebrafish anti-γH2A.X (GeneTex: GTX127340) overnight, washed three times with PBS-TA, and imaged using a Leica M205 stereomicroscope. No randomization of the sample or blinding were applied. No statistical methods were used to predetermine sample size.
iCLIP data analysis
FAST-iCLIP was performed37 on HeLa cells by ultravioletcrosslinking to a total of 0.35 J cm−2. Whole-cell lysates were generated in iCLIP lysis buffer (50 mM HEPES, 200 mM NaCl, 1 mM EDTA, 10% glycerol, 0.1% NP-40, 0.2% Triton X-100, 0.5% N-lauroylsarcosine) and briefly sonicated using a probe-tip Branson sonicator to solubilize chromatin. Each iCLIP experiment was normalized for total protein amount, typically 1 mg, and partly digested with RNase I (Thermo Fisher Scientific, catalogue number AM2294) for 10 min at 37 °C and quenched on ice. DDX21 was isolated with anti-DDX21 antibody (Novus Biologicals NB100-1718) for 8 h at 4 °C on rotation. Samples were washed sequentially in 1 ml for 5 min each at 4 °C: 2 × high stringency buffer (15 mM Tris-HCl, pH 7.5, 5 mM EDTA, 2.5 mM EGTA, 1% Triton X-100, 1% sodium deoxycholate, 120 mM NaCl, 25 mM KCl), 1 × high salt buffer (15 mM Tris-HCl pH 7.5, 5 mM EDTA, 2.5 mM EGTA, 1% Triton X-100, 1% sodium deoxycholate, 1 M NaCl), 1 × NT2 buffer (50 mM Tris-HCl, pH 7.5, 150 mM NaCl, 1 mM MgCl2, 0.05% NP-40). After the NT2 wash, DDX21-bound RNA–protein complexes were dephosphorylated with T4 PNK (NEB, catalogue number M0210) for 30 min in an Eppendorf Thermomixer at 37 °C, 15 s at 1,400 r.p.m., 90 s rest in a 30 μl reaction, pH 6.5, containing 10 units of T4 PNK, 0.1 μl SUPERase-IN, and 6 μl of PEG-400 (16.7% final). After 30 min, beads were rinsed once with NT2 buffer and 3′ end ligated with T4 RNA Ligase 1 (NEB, catalogue number M0204) overnight in an Eppendorf Thermomixer at 16 °C, 15 s at 1,400 r.p.m., 90 s rest in a 30 μl reaction containing 10 units of T4 RNA Ligase, 1 pmole pre-adenylated-DNA-adaptor, 0.1 μl SUPERase-IN, and 6 μl of PEG400 (16.7% final). The following day, samples were again rinsed with NT2 buffer and 5′ radiolabelled by adding 1 μl of T4 PNK, 0.5 μl g32-ATP (Perkin Elmer), 2 μl 10× T4 PNK buffer, 0.5 μl SUPERase-In, and 16 μl of water for 15 min at 37 °C. To this reaction, 1 μl of 100 mM DTT and 6 μl of 4× LDS Buffer (Thermo Fisher Scientific) were added, samples headed to 75 °C for 10 min, and released RNA-protein complexes were separated on SDS–PAGE using NuPAGE 4–12% Bis-Tris Gels (1.0 mm × 12 wells) at 180 V for 45 min. Resolved ribonucleoprotein complexes were wet-transferred to nitrocelluose at 400 mA for 60 min at 4 °C.
RNA was recovered and processed for library preparation as in the irCLIP protocol38. Membranes were cut into approximately 0.5 × 1 mm narrow strips that easily came to rest in the bottom of a siliconized 1.5 ml Eppendorf tube. To each tube, we added 0.2 ml of proteinase K reaction buffer (100 mM Tris, pH 7.5, 50 mM NaCl, 1 mM EDTA, 0.2% SDS) and 10 μl of proteinase K (Thermo Fisher Scientific, catalogue number AM2546). The reaction was incubated for 60 min at 50 °C in an Eppendorf Thermomixer. Next, 200 μl of saturated phenol–chloroform, pH 6.7, was added to each tube and incubated for 10 min at 37 °C in an Eppendorf Thermomixer, 1,400 r.p.m. Tubes were briefly centrifuged and the entire contents transferred to a 2 ml Heavy Phase Lock Gel (5Prime, catalogue number 2302830). After 2 min centrifugation at more than 13,000 r.p.m., the aqueous layer was re-extracted with 1 ml of chloroform (invert tube ten times to mix; do not vortex, pipet or shake) in the same 2-ml Phase Lock Gel tube and centrifuged for 2 min at more than 13,000 r.p.m. The aqueous layer was then transferred to a new 2-ml Heavy Phase Lock Gel tube and extracted again with an additional 1 ml of chloroform. After 2-min centrifugation at more than 13,000 r.p.m., the aqueous layer was transferred to a siliconized 1.5-ml Eppendorf tube and precipitated overnight at −20 °C by addition of 10 μl 5 M NaCl, 3 μl Linear Polyacrylamide (Thermo Fisher Scientific, catalogue number AM9520), and 0.8 ml ethanol.
cDNA synthesis primers were purchased from IDT: cDNA-barcode1 (6 bp TruSeq barcode in bold type):/5phos/WWWNNNXXXXXXNNNNNTACCCTT CGCTTCACACACAAG/iSp18/GGATCC/iSp18/TACTGAACCGC. P3short (cDNA elution oligonucleotide): CTGAACCGCTCTTCCGATCT. PCR1 primers, P3tall: GCATTCCTGCTGAACCGCTCTTCCGATCT; P6tall: TTTCCC CTTGTGTGTGAAGCGAAGGGTA. PCR2 primers (PAGE purified), P3solexa: CAAGCAGAAGACGGCATACGAGATCGGTCTCGGCATTCCTGCTGAACCG CTCTTCCGATCT; P6solexa: AATGATACGGCGACCACCGAGATCTACACTCTTTCCCCTTGTGTGTGAAGCGAAGGGTA. P6 sequencing primer (for Illumina sequencing): CACTCTTTCCCCTTGTGTGTGAAGCGAAGGGTA.
RNA fragments were pelleted at more than 13,000 r.p.m. for 45 min at 4 °C, washed once with 1 ml of ice-cold 75% ethanol and air dried. Pellets were resuspended in 12 μl water. RNA (12 μl) was mixed with 1 μl of 1 μM cDNA and 1 μl of 10 mM dNTPs and heated to 70 °C for 10 min, then rapidly cooled to 4 °C. Six microlitres of cDNA Master Mix (4 μl 5 × SSIV buffer, 1 μl 100 mM DTT, 1 μl SSIV) was added to the annealed RNA and incubated for 30 min at 55 °C. cDNA:RNA hybrids were captured by addition of 5 μl of MyOne Streptavidin C1 Dynabeads (Thermo Fisher Scientific, catalogue number 65001) that had been rinsed and suspended in 30 μl of biotin-IP buffer (100 mM Tris, pH 7.5, 1 M NaCl, 1 mM EDTA, 0.1% Tween), and end-over-end rotation for 30 min at room temperature. Beads were placed on a 96-well magnet and washed sequentially with 0.1 ml of Biotin-IP buffer and PBS. Beads were resuspended in 10 μl of cDNA elution/RNA degradation buffer (8.25 μl water, 1 μl of 1 μM P3short oligo, and 0.75 μl of 50 mM MnCl2) and placed in a thermocycler with the following program: 5 min at 95 °C, 1 min at 75 °C, ramp 0.1° s−1 to 60 °C forever. After 15 min, tubes were removed and mixed with 5 μl of Circligase-II reaction buffer (3.3 μl water, 1.5 μl 10 × Circligase-II buffer, and 0.2 μl of Circligase-II, Epicentre, catalogue number CL9021K). cDNA was circularized in a thermocycler for 1.5 h at 60 °C. cDNA was captured by addition of 30 μl of Ampure XP beads (Beckman Coulter, catalogue number A63880), 75 μl of isopropanol, and incubation for 15 min (the solution was remixed after 7.5 min). Beads were washed once with 80% ethanol, dried for 5 min, and resuspended in 14 μl of water. For maximal elution, tubes were placed in a 95 °C thermocycler for 2 min and immediately transferred to a 96-well magnet. The 14 μl eluate was transferred to a new 0.2 ml PCR tube containing 15 μl of 2 × Phusion HF-PCR Master Mix (NEB, catalogue number M0531), 0.5 μl of 30 μM P3/P6 PCR1 oligo mix, and 0.5 μl of 15 × SYBR Green I (Thermo Fisher Scientific, catalogue number S7563). The tubes were then placed in a Stratagene MX3000P qPCR machine with the following program: 98 °C for 2 min, 15 cycles of 98 °C for 15 s, 65 °C for 30 s, 72 °C for 30 s, with data acquisition set to the 72 °C extension. PCR1 reactions were then subjected to one round of magnetic bead size selection by addition of 4.5 μl of isopropanol, 54 μl of Ampure XP beads, and incubation for 10 min. Beads were washed once with 80% ethanol, dried for 5 min, and eluted in 10 μl of water. PCR1 products were subjected to a second round of size selection by addition of 1.5 μl of isopropanol, 18 μl of Ampure XP beads, and incubation for 10 min. Beads were washed once with 80% ethanol, dried for 5 min, and eluted in 10 μl 500 nM P3solexa/P6solexa oligonucleotide mix. Ten microlitres of 2 × Phusion HF-PCR Master was added to each tube and placed in a thermocycler with the following program: 98 °C for 2 min, three cycles of 98 °C for 15 s, 65 °C for 30 s, 72 °C for 30 s. Final libraries were purified by addition of 36 μl of Ampure XP beads and incubation for 5 min. Beads were washed twice with 70% ethanol, dried for 5 min, and eluted in 20 μl of water. One microlitre of each library was quantitated by HS-DNA Bioanalyzer.
Samples were sent for deep sequencing on an Illumina NextSeq machine for single-end 75-bp cycle runs. FAST-iCLIP data were processed using the FAST-iCLIP analysis pipeline (https://github.com/ChangLab/FAST-iCLIP). PCR duplicates were removed using unique molecular identifiers in the RT primer region. Adaptor and barcode sequences were trimmed, and reads were mapped stepwise to repetitive and non-repetitive genomes. Specific parameters used were as follows: −f 18 (trims 17 nt from the 5′ end of the read), −l 15 (includes all reads longer than 15 nt), −bm 25 (minimum MAPQ score from Bowtie2 of 25 is required for repeat element mapping), −sr 0.08 (STAR mismatch-per-base ratio; 0.08 corresponds to 2 mismatches per 25 bases), and −tr 2,3 (repetitive genome) and −tn 2,3 (non-repetitive genome) RT stop intersection (n,m; where n = replicate number and m = number of unique RT stops required per n replicates). Using the −tr/tn 2,3 parameters, a minimum of six RT stops were required to support any single nucleotide identified as crosslinking site.
Code availability
All custom codes are available upon request from the corresponding author.
Data availability
Data that support the findings of this study have been deposited in the Gene Expression Omnibus under accession number GSE89420. Source Data for Figs 1–4 and Extended Data Figs 8 and 9 have been provided. Source Data for western blots shown in Fig. 4 and Extended Data Figs 2–5, 7 and 9 have been provided in Supplementary Fig. 1. All other relevant data that support the findings of this study are available from the corresponding author upon reasonable request.
Extended Data
Extended Data Figure 1. DDX21 subnuclear localization is sensitive to perturbations in the rRNA synthesis.
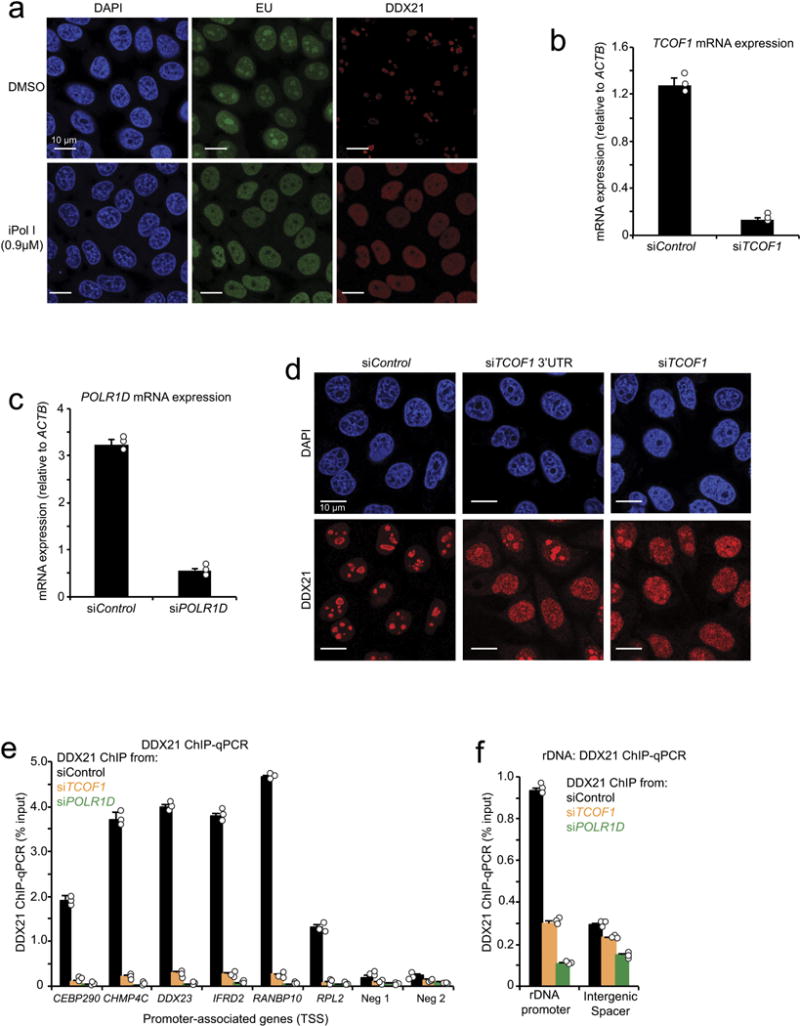
a, Representative immunofluorescence depicting DDX21 localization and 5-ethynyl uridine (EU) incorporation in HeLa cells treated with DMSO or iPol I from n = 3 biologically independent experiments. b, c, siRNA pools were developed against TCOF1 or POLRID and transected into HeLa cells. qPCR was used to determine knockdown efficiency. d, An additional pool of siRNAs targeting TCOF1 3′ UTR was generated and transfected into HeLa cells, followed by immunofluorescence to determine DDX21 localization upon TCOF1 knockdown. Shown are representative images from n = 3 biologically independent experiments. e, f, ChIP–qPCR of DDX21 binding at target gene promoters (e) and the rDNA locus (f) upon knockdown of either TCOF1 (siTCOF1) or POLR1D (siPOLR1D). For b, c, e and f, bars represent the average n = 3 biologically independent experiments; error bars, s.e.m.
Extended Data Figure 2. DDX21 knockdown phenocopies TCS-associated perturbations in X. laevis and zebrafish.
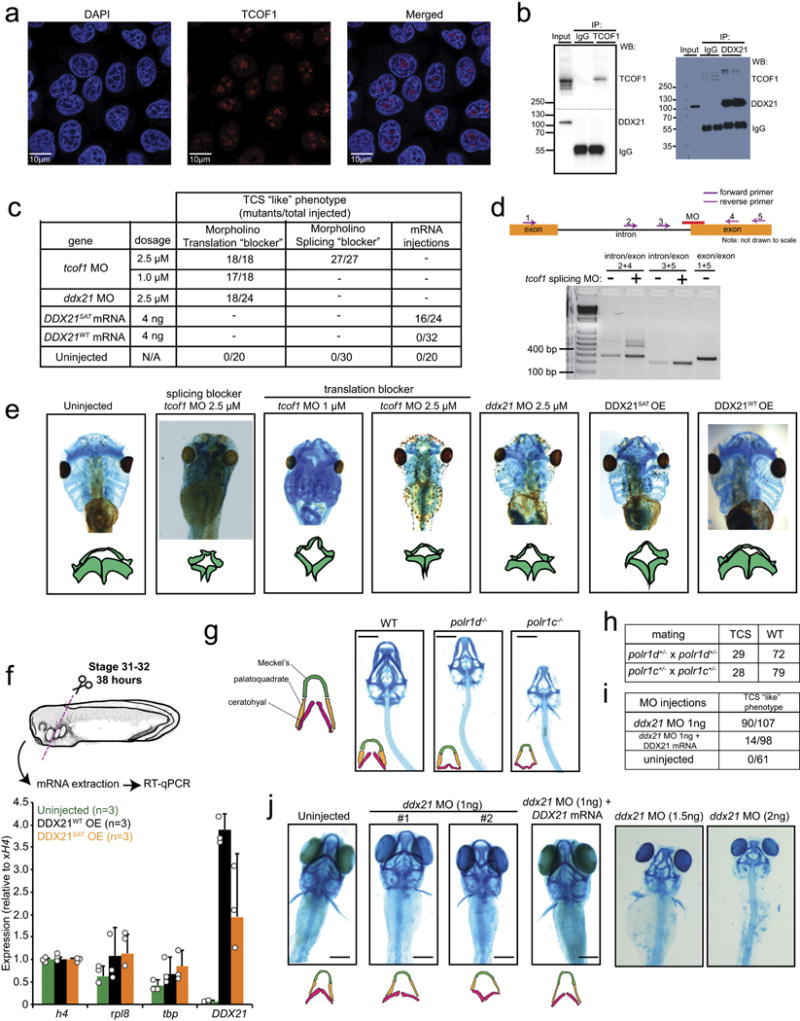
a, Representative immunofluorescence images showing strong nucleolar localization signal for TCOF1 in HeLa cells from n = 3 biologically independent experiments. b, Immunoprecipitation of either GFP–tagged TCOF1 (GFP–TCOF1) or DDX21, followed by western blotting with the indicated antibodies. n = 2 biologically independent experiments. c, Table showing the quantification of injected Xenopus embryos with the indicated morpholinos (MO) or in vitro transcribed mRNAs. d, Efficiency of tcof1 splicing morpholino was determined by PCR. n = 10 injected embryos. e, Representative images of stage 49 Xenopus embryo cartilage stainings with alcian blue. Traces of the mandibular and hyoid streams are shown for clarity. Embryos were collected from n = 3 biologically independent experiments. f, Stage 2 embryos were injected with in vitro transcribed mRNAs encoding wild-type or catalytically defective DDX21. Total mRNA was extracted at stage 31, followed by qPCR to determine the expression levels of injected mRNAs in the anterior part of the embryo (see schematics for details). Bars represent the average of n = 3 independent experiments; error bars, s.e.m. g, Representative images of 5-day-old wild-type (WT), polr1d−/−, and polr1c−/− zebrafish embryo cartilage stained with alcian blue from n = 3 independent matings. h, Table showing the quantification of polr1d−/− and polr1c−/− crosses. i, Table showing quantification of zebrafish embryos injected with the indicated morpholino or combination of morpholino and mRNA. j, Representative images of 5-day-old zebrafish embryo cartilage stained with alcian blue after injection of ddx21 morpholino at the indicated dosages or ddx21 morpholino and in vitro transcribed human DDX21 mRNA. Traces of the ceratohyal, platoquadrate, and Meckel’s cartilage are shown for clarity. n = 3 biologically independent sets of injections.
Extended Data Figure 3. Generation of an in vitro model of TCS.
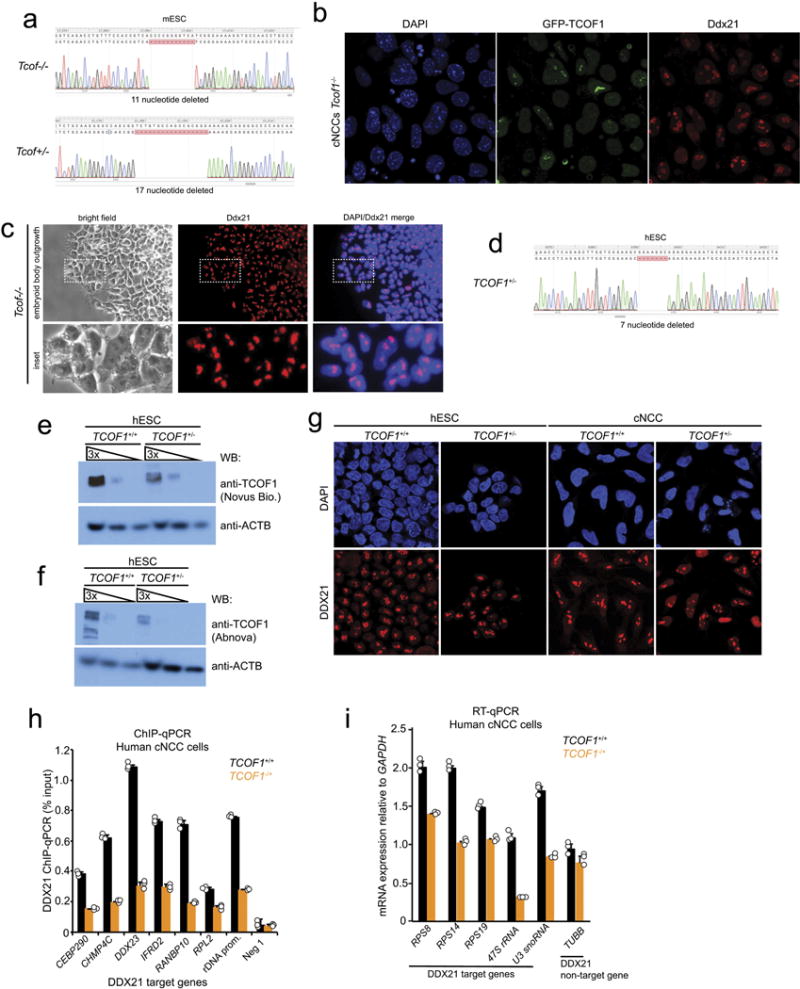
a, Mouse ES cells were co-transfected with CRISPR-Cas9 and sgRNAs targeting the Tcof1 locus. Targeted mouse ES cells were single-cell cloned and screened for loss-of-function mutations in Tcof1. Clones of the indicated genotypes were selected for this study. b, Overexpression of an exogenous, but stably integrated human GFP–tagged TCOF1 construct in mouse cNCCs rescued DDX21 localization defects as determined by immunofluorescence (quantifications are shown in Fig. 2c). Shown are representative images from n = 3 biologically independent experiments. c, Mouse ES cells were differentiated into embryoid bodies. Embryoid body outgrowth explants were further grown in culture and stained with antibodies for Ddx21. Shown are representative images from n = 4 biologically independent experiments. d, Human H9 ES cells were co-transfected with CRISPR-Cas9 and sgRNAs targeting the TCOF1 locus. Targeted ES cells were cloned and screened for loss-of-function mutations in TCOF1; unlike mouse ES cells, we did not recover homozygous mutant alleles for TCOF1 in human cells. The indicated genotype was selected for this study. e, f, Two different commercially available antibodies raised against TCOF1 were used to confirm the heterozygosity of TCOF1+/− ES cells. Shown are representative western blots from n = 2 biologically independent experiments. g, Representative immunofluorescence images showing DDX21 localization in both wild-type and TCOF1+/− human ES cells and cNCCs from n = 3 biologically independent experiments. h, ChIP–qPCR analysis in human cNCCs sampling DDX21 genomic occupancy at a representative panel of DDX21 target promoters and at the rDNA promoter. i, qPCR analyses of DDX21-regulated Pol I and Pol II transcribed ribosomal genes. For h, i, bars represent the average of n = 3 biologically independent experiments; error bars, s.e.m.
Extended Data Figure 4. Pol I inhibition impairs the ability of DDX21 to associate with the 5′ external transcribed spacer (ETS) and the snoRNAs.
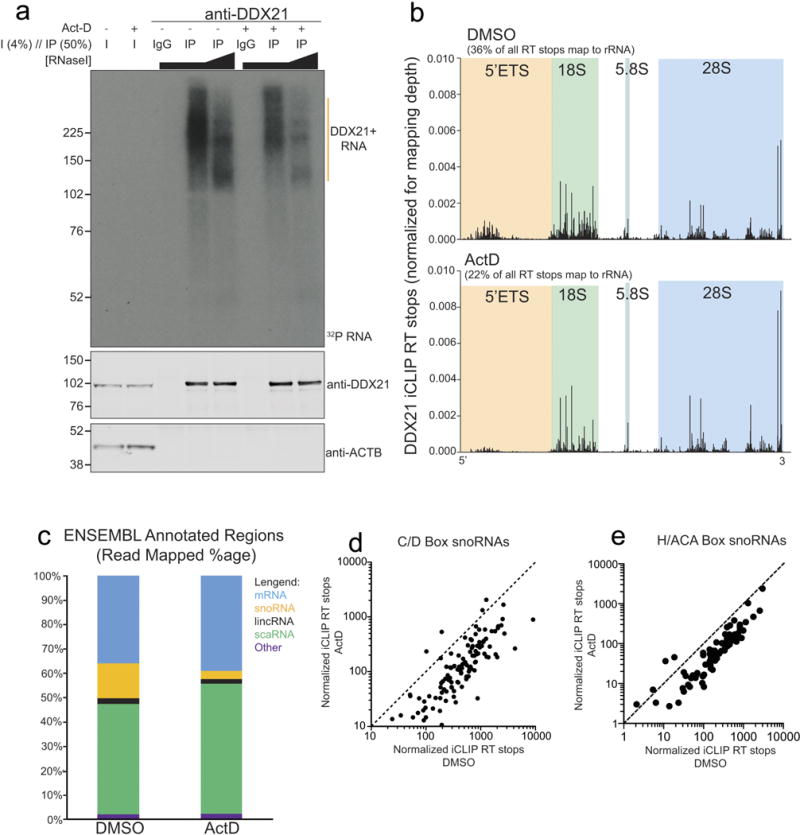
a, DDX21 iCLIP 32P-autoradiogram and western blots from control (DMSO) and Pol I inhibited cells. For Pol I inhibition, we used low levels of actinomycin D (ActD; 50 ng ml−1). Samples were loaded with constant input lysate amounts. b, DDX21 iCLIP reads mapped to the transcribed region of the rDNA. The 5′ external transcribed spacer and the mature portions of the 18S, 5.8S, and 28S rRNAs are highlighted. c, Distribution of ENSEMBL annotated regions for DDX21-bound RNAs in both DMSO and actinomycin D conditions. d, e, Scatter plot analysis of normalized iCLIP reverse transcription stops on individual C/D or H/ACA snoRNAs. iCLIP results are from n = 2 biological replicates.
Extended Data Figure 5. Protein p53 is activated in TCS cNCCs and its mRNA is highly expressed in cNCCs in vivo.
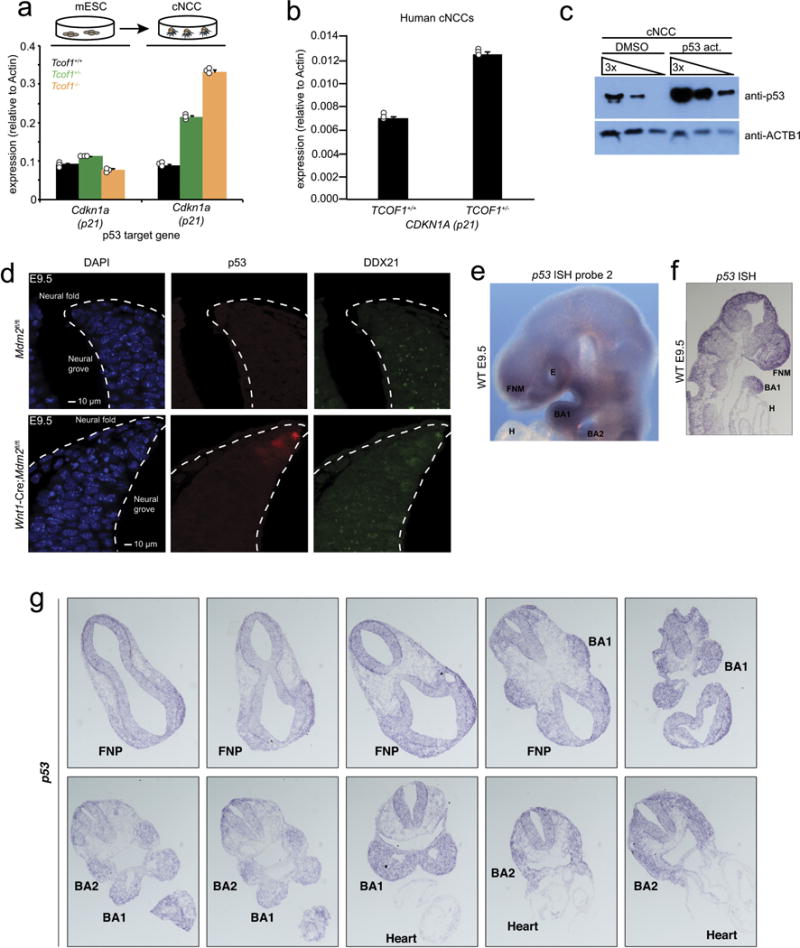
a, b, qPCR analyses of the p53-target gene Cdkn1a in mouse ES cells and cNCCs (a) and human cNCCs (b) of indicated genotypes. Bars represent the average of n = 3 biologically independent experiments; error bars, s.e.m. c, Human cNCCs were treated with NSC146109 for 12 h, followed by western blotting with antibodies raised against p53. Shown is a representative western blot from n = 3 biologically independent experiments. d, Immunofluorescence staining of p53 and DDX21 in sections from the dorsal neural tube of Mdm2f//f (control; top) and Wnt1-cre;Mdm2fl/fl (bottom) E9.5 mouse embryos. Dotted lines outline the neural fold. n = 5 animals per genotype. e, Representative picture of whole-mount in situ hybridization of E9.5 embryos with a probe recognizing endogenous p53 mRNA. n = 4 animals. f, g, Representative images of p53 in situ hybridization on tissue sections of the frontonasal prominence and first and second pharyngeal arches of E9.5 mouse embryos. n = 2 independent animals.
Extended Data Figure 6. Hyper-activation of p53 in cNCCs renders pharyngeal arches hypoplastic.
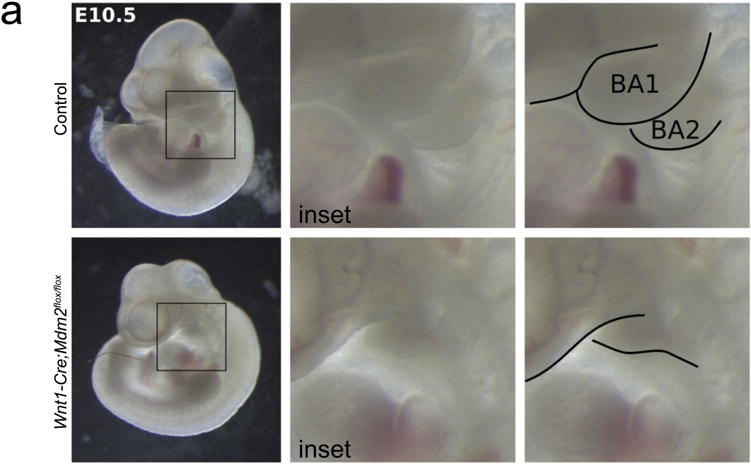
Representative images of wild-type and Wnt1-cre;Mdm2fl/fl E10.5 embryos. Whole-embryo pictures (left) and insets (middle) depicting the location of the first and second pharyngeal arches. Right panel shows traces of first and second pharyngeal arches for clarity. n = 8 animals per genotype.
Extended Data Figure 7. DDX21 overexpression rescues TCS and its function is deregulated by knockdown of other ribosomopathy-associated genes.
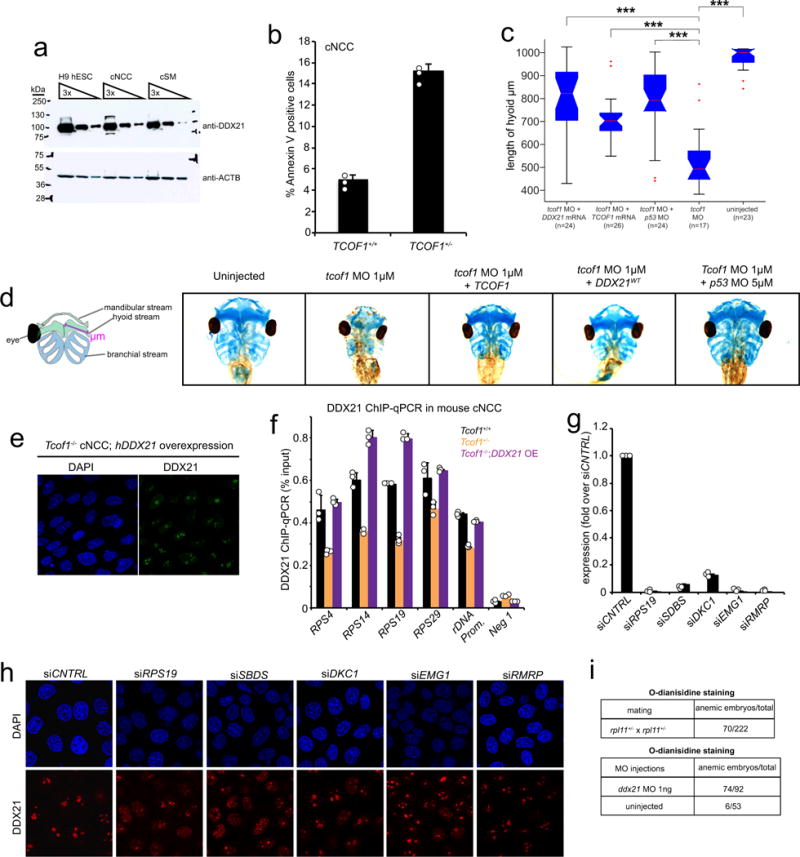
a, Representative western blot for DDX21 in different cell types from n = 3 biologically independent experiments. b, FACS analyses to determine the sensitivity of TCOF1+/− cNCC to p53-mediated apoptosis. cNCCs were treated with NSC146109 for 4–6 h (note that this time point is significantly shorter than the one used in Fig. 3f and g). Apoptosis was quantified by FACS of annexin V staining. Bars represent the average of n = 3 independent experiments; error bars, s.e.m. c, Quantification of Xenopus cranofacial development rescue experiments by measuring the length of the hyoid stream upon overexpression of TCOF1, DDX21, or p53 knockdown. Embryos were collected from n = 3 biologically independent experiments. Boxes represent median value and 25th and 75th percentiles, whiskers are minimum to maximum, crosses are outliers. ***P < 0.001, two-sided Wilcoxon–Mann–Whitney test. d, Rescue of TCS-associated craniofacial malformations in Xenopus by injection of the embryos with the indicated in vitro transcribed mRNAs and/or morpholinos (quantification is shown in c). e, Representative immunofluorescence images of mouse Tcof1−/− cNCCs upon overexpression of human GFP–tagged DDX21. n = 3 biologically independent experiments. f, ChIP–qPCR analysis, in mouse cNCCs sampling Ddx21 genomic occupancy, at a representative panel of Ddx21 target promoters and at the rDNA locus. n = 3 biologically independent experiments. Bars represent the average of n = 3 independent experiments; error bars, s.e.m. g, siRNA pools against a subset of ribosomopathy-associated genes were transected into HeLa cells. qPCR was used to determine the efficiency of the knockdowns. Bars represent the average of n = 3 independent experiments; error bars, s.e.m. h, Representative immunofluorescence images showing DDX21 localization changes in HeLa cells transfected with the indicated pools of siRNAs (quantification is on Fig. 3i). n = 3 biologically independent experiments. i, Tables quantifying the number of embryos stained for haemoglobin with o-dianisidine for the indicated genotypes. In the case of rpl1 zebrafish, embryos were collected from three independent matings. For DDX21, three independent batches of embryos were injected and stained.
Extended Data Figure 8. Inhibition of Pol I results in DNA damage in a subset of cells.
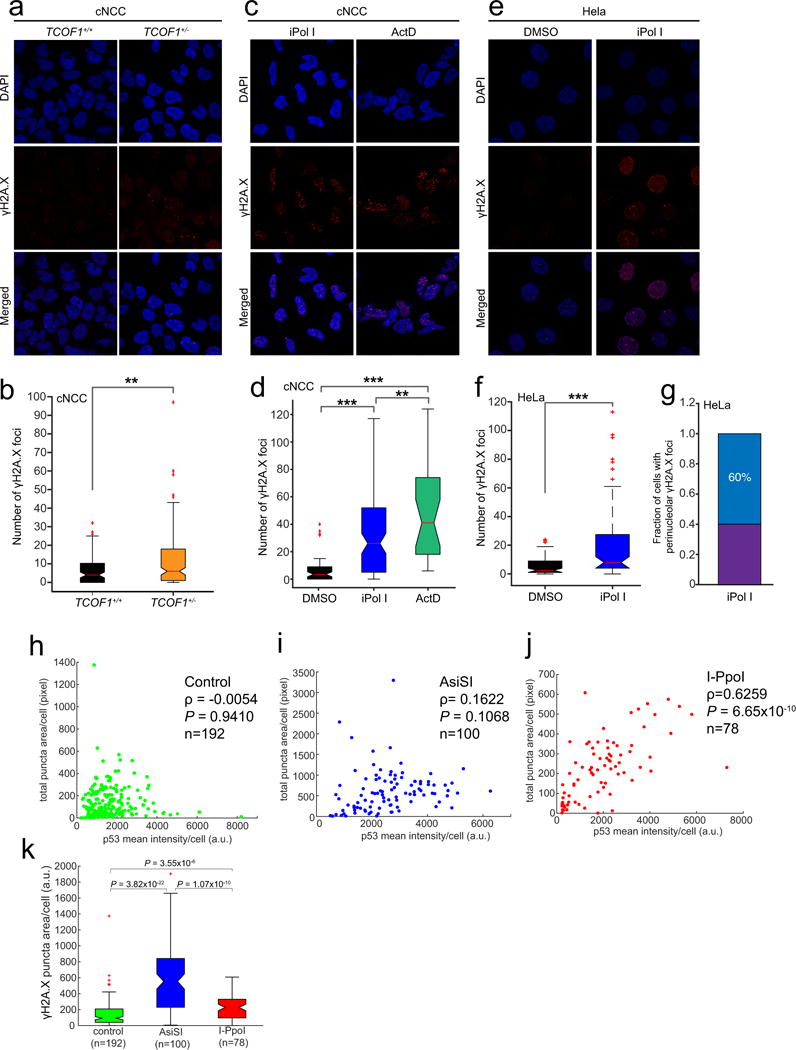
a, Representative immunofluorescence images of wild-type and TCOF1+/− cNCCs stained with an antibody against γH2A.X; quantification is shown in b. c, Representative immunofluorescence images of DNA-damaged wild-type cNCCs stained with an antibody against γH2A.X after 1 h treatment with iPol I or actinomycin D (ActD); quantification is shown in d. e, Representative immunofluorescence images of DNA-damaged HeLa cells stained with an antibody against γH2A.X after 1 h treatment with iPol I; quantification is shown in f. For a–f, cells were collected from n = 3 biologically independent experiments. Boxes represent median value and 25th and 75th percentiles, whiskers are minimum to maximum, crosses are outliers. ***P < 0.001, two-sided Wilcoxon–Mann–Whitney test. g, Fraction of DNA-damaged HeLa cells displaying perinucleolar γH2A.X signal after 1 h incubation with iPol I. Cells were collected from n = 3 biologically independent experiments. h–j, Single-cell correlation plots of p53 activation and γH2A.X signal in control and cells expressing either AsiSI or I-PpoI. Cells were collected from n = 4 biologically independent experiments. ρ, Pearson correlation coefficient. P, two-sided Wilcoxon–Mann–Whitney test. k, Single-cell quantification of γH2A.X signal in control and cells expressing either AsiSI or I-PpoI. Cells were collected from n = 4 biologically independent experiments. Boxes represent median value and 25th and 75th percentiles, whiskers are minimum to maximum, crosses are outliers. P, two-sided Wilcoxon–Mann–Whitney test.
Extended Data Figure 9. rDNA damage impairs DDX21 functions and causes craniofacial deformities.
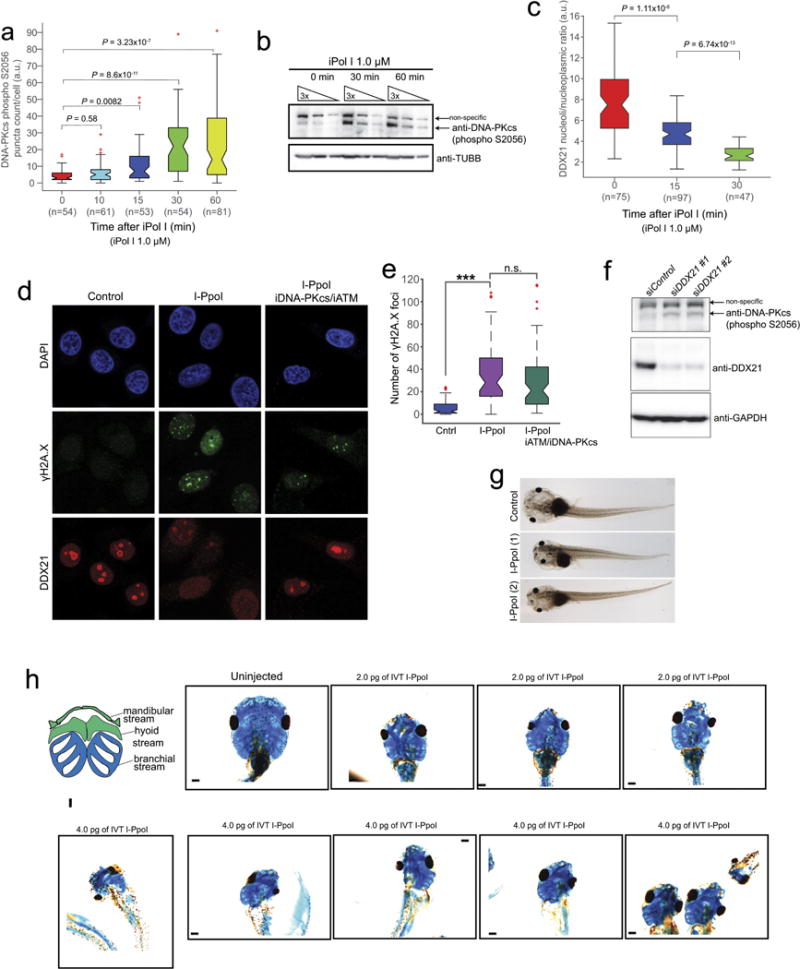
a, b, Time course of phosphorylated DNA-PKcs as measured by auto-phosphorylation of the kinase in Ser2056 (S2056) upon iPol I treatment. Cells were collected from n = 3 biologically independent experiments. Boxes represent median value and 25th and 75th percentiles, whiskers are minimum to maximum, crosses are outliers. P, two-sided Wilcoxon–Mann–Whitney test. c, Time course of DDX21 exclusion from the nucleolus to the nucleoplasm upon iPol I treatment. Cells were collected from n = 3 biologically independent experiments. Boxes represent median value and 25th and 75th percentiles, whiskers are minimum to maximum, crosses are outliers. P, two-sided Wilcoxon–Mann–Whitney test. d, Representative immunofluorescence images of HeLa cells transfected with in vitro transcribed I-PpoI and treated or not with inhibitors for ATM (iATM) and DNAPK (iDPK). After treatment, cells were stained with antibodies against DDX21 and γH2A.X. e, Box plot quantifying the number of γH2A.X foci of HeLa cells transfected with I-PpoI and treated or not with iATM and iDPK. Cells were collected from n = 3 biologically independent experiments. Boxes represent median value and 25th and 75th percentiles, whiskers are minimum to maximum, crosses are outliers. ***P < 0.001, two-sided Wilcoxon–Mann–Whitney test, not significant (NS). f, Western blot showing DNA-PKcs by auto-phosphorylation of S2056 upon knockdown of DDX21. Two different siRNAs were used in this experiment (see Methods for details). n = 3 biologically independent experiments. g, Representative bright-field images of stage 49 Xenopus embryos either uninjected or injected with in vitro transcribed I-PpoI and (h) alcian blue stainings of Xenopus cranial cartilage from embryos injected with the indicated doses of in vitro transcribed I-PpoI. Embryos were collected from n = 4 biologically independent injections.
Extended Data Figure 10. Model explaining cNCC-type selective effects of nucleolar dysfunction and rDNA damage in TCS.
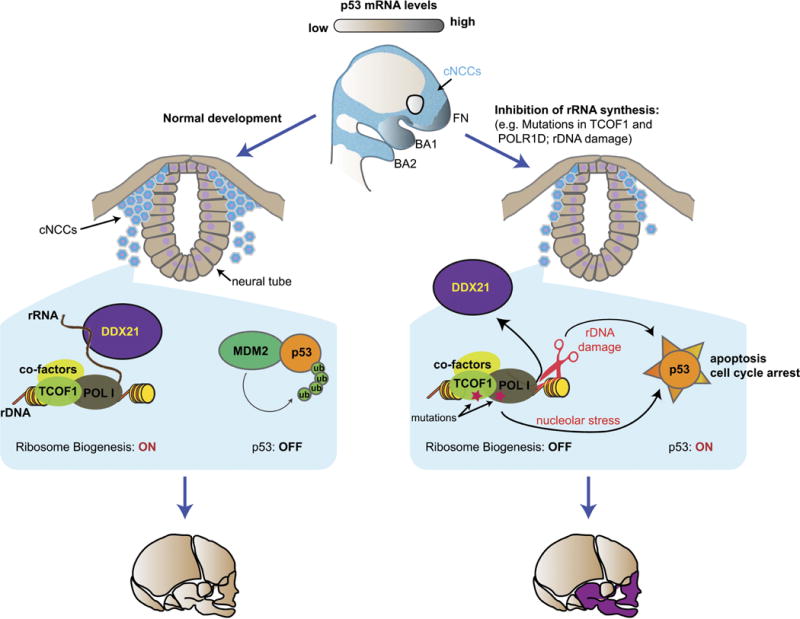
cNCCs express high levels of p53 mRNA, but during normal development p53 is under posttranscriptional control of its E3 ligase, Mdm2. Upon nucleolar stress and/or rDNA damage, activation of p53 and loss of DDX21 from chromatin result in apoptosis of a subset of cNCCs. This diminishes the population of cNCCs that can be allocated to the lower face, leading to malformations of the developing craniofacial structures. Thus, factors whose perturbations may ultimately induce defects in rRNA synthesis and rDNA damage are likely to be associated with craniofacial malformations.
Supplementary Material
Acknowledgments
We thank J. Stack and J. Wu for providing the endothelial and cardiomyocyte cells, J. Chen for Xenopus splicing morpholino validations, C. Santoriello and L. Zon for ddx21 zebrafish morpholino, the Swanson Biotechnology Center at the Koch Institute for Integrative Cancer Research, especially E. Vasile for microscopy and A. Amsterdam for zebrafish work, and K. Cimprich and members of the Wysocka, Calo, and Chang laboratories for discussions. This work was supported by the Howard Hughes Medical Institute (J.W.), R01 GM112720 (J.W.), the March of Dimes Birth Defects Foundation (J.W.), March of Dimes Foundation grants 6-FY15-189 and RC35CA197591 (L.D.A.), Ludwig Foundation (J.W.), Stanford Medical Scientist Training Program and T32CA09302 (R.A.F.), the Helen Hay Whitney Foundation (E.C.), EMBO (ALTF 275-2015), the European Commission (LTFCOFUND2013, GA-2013-609409), and the Marie Curie Actions (A.Z.), Jane Coffin Childs Memorial Fund postdoctoral fellowship (M.E.B.), Stanford Graduate Student Fellowship (B.G.) and National Institutes of Health P50-HG007735 and R01-ES023168 (H.Y.C.).
Footnotes
Online Content Methods, along with any additional Extended Data display items and Source Data, are available in the online version of the paper; references unique to these sections appear only in the online paper.
Supplementary Information is available in the online version of the paper.
Author Contributions
J.W. supervised the project; E.C. conceived and designed the study; E.C. performed experiments with help from F.A. and J.L.; B.G. performed image analyses. E.C. and R.A.F. analysed ChIP–seq data; R.A.F. analysed the iCLIP data; F.A. and E.C. performed zebrafish experiments; M.E.B. performed mouse embryo dissections and immunostainings; A.Z. performed p53 in situ hybridization; J.L. and E.C. performed DNA damage experiments; TS., L.D.A., and H.Y.C. provided advice on experimental designs, data analyses, and interpretation of the data; E.C. and J.W. wrote the manuscript with input from all co-authors.
Author Information The authors declare no competing financial interests. Readers are welcome to comment on the online version of the paper. Publisher’s note: Springer Nature remains neutral with regard to jurisdictional claims in published maps and institutional affiliations.
Reviewer Information
Nature thanks D. Tollervey and the other anonymous reviewer(s) for their contribution to the peer review of this work.
References
- 1.Yelick PC, Trainor PA. Ribosomopathies: global process, tissue specific defects. Rare Dis. 2015;3:e1025185. doi: 10.1080/21675511.2015.1025185. [DOI] [PMC free article] [PubMed] [Google Scholar]
- 2.Berdasco M, Esteller M. Genetic syndromes caused by mutations in epigenetic genes. Hum Genet. 2013;132:359–383. doi: 10.1007/s00439-013-1271-x. [DOI] [PubMed] [Google Scholar]
- 3.Trainor PA. Craniofacial birth defects: the role of neural crest cells in the etiology and pathogenesis of Treacher Collins syndrome and the potential for prevention. Am J Med Genet A. 2010;152:2984–2994. doi: 10.1002/ajmg.a.33454. [DOI] [PMC free article] [PubMed] [Google Scholar]
- 4.Bronner ME, LeDouarin NM. Development and evolution of the neural crest: an overview. Dev Biol. 2012;366:2–9. doi: 10.1016/j.ydbio.2011.12.042. [DOI] [PMC free article] [PubMed] [Google Scholar]
- 5.Calo E, et al. RNA helicase DDX21 coordinates transcription and ribosomal RNA processing. Nature. 2015;518:249–253. doi: 10.1038/nature13923. [DOI] [PMC free article] [PubMed] [Google Scholar]
- 6.Narla A, Ebert BL. Ribosomopathies: human disorders of ribosome dysfunction. Blood. 2010;115:3196–3205. doi: 10.1182/blood-2009-10-178129. [DOI] [PMC free article] [PubMed] [Google Scholar]
- 7.Kadakia S, Helman SN, Badhey AK, Saman M, Ducic Y. Treacher Collins syndrome: the genetics of a craniofacial disease. Int J Pediatr Otorhinolaryngol. 2014;78:893–898. doi: 10.1016/j.ijporl.2014.03.006. [DOI] [PubMed] [Google Scholar]
- 8.Weiner AMJ, Scampoli NL, Calcaterra NB. Fishing the molecular bases of Treacher Collins syndrome. PLoS ONE. 2012;7:e29574. doi: 10.1371/journal.pone.0029574. [DOI] [PMC free article] [PubMed] [Google Scholar]
- 9.Lau MCC, et al. Pathogenesis of POLR1C-dependent type 3 Treacher Collins syndrome revealed by a zebrafish model. Biochim Biophys Acta. 2016;1862:1147–1158. doi: 10.1016/j.bbadis.2016.03.005. [DOI] [PubMed] [Google Scholar]
- 10.Noack Watt KE, Achilleos A, Neben CL, Merrill AE, Trainor PA. The roles of RNA polymerase I and III subunits Polr1c and Polr1d in craniofacial development and in zebrafish models of Treacher Collins syndrome. PLoS Genet. 2016;12:e1006187. doi: 10.1371/journal.pgen.1006187. [DOI] [PMC free article] [PubMed] [Google Scholar]
- 11.Valdez BC, Henning D, Perumal K, Busch H. RNA-unwinding and RNA-folding activities of RNA helicase II/Gu: two activities in separate domains of the same protein. Eur J Biochem. 1997;250:800–807. doi: 10.1111/j.1432-1033.1997.00800.x. [DOI] [PubMed] [Google Scholar]
- 12.Dixon J, Brakebusch C, Fässler R, Dixon MJ. Increased levels of apoptosis in the prefusion neural folds underlie the craniofacial disorder, Treacher Collins syndrome. Hum Mol Genet. 2000;9:1473–1480. doi: 10.1093/hmg/9.10.1473. [DOI] [PubMed] [Google Scholar]
- 13.Dixon J, et al. Tcof1/Treacle is required for neural crest cell formation and proliferation deficiencies that cause craniofacial abnormalities. Proc Natl Acad Sci USA. 2006;103:13403–13408. doi: 10.1073/pnas.0603730103. [DOI] [PMC free article] [PubMed] [Google Scholar]
- 14.Sloan KE, et al. The association of late-acting snoRNPs with human pre-ribosomal complexes requires the RNA helicase DDX21. Nucleic Acids Res. 2015;43:553–564. doi: 10.1093/nar/gku1291. [DOI] [PMC free article] [PubMed] [Google Scholar]
- 15.Gonzales B, et al. The Treacher Collins syndrome (TCOF1) gene product is involved in pre-rRNA methylation. Hum Mol Genet. 2005;14:2035–2043. doi: 10.1093/hmg/ddi208. [DOI] [PubMed] [Google Scholar]
- 16.Jones NC, et al. Prevention of the neurocristopathy Treacher Collins syndrome through inhibition of p53 function. Nat Med. 2008;14:125–133. doi: 10.1038/nm1725. [DOI] [PMC free article] [PubMed] [Google Scholar]
- 17.Berkson RG, et al. Pilot screening programme for small molecule activators of p53. Int J Cancer. 2005;115:701–710. doi: 10.1002/ijc.20968. [DOI] [PubMed] [Google Scholar]
- 18.Dolma S, Lessnick SL, Hahn WC, Stockwell BR. Identification of genotype-selective antitumor agents using synthetic lethal chemical screening in engineered human tumor cells. Cancer Cell. 2003;3:285–296. doi: 10.1016/s1535-6108(03)00050-3. [DOI] [PubMed] [Google Scholar]
- 19.Van Nostrand JL, et al. Inappropriate p53 activation during development induces features of CHARGE syndrome. Nature. 2014;514:228–232. doi: 10.1038/nature13585. [DOI] [PMC free article] [PubMed] [Google Scholar]
- 20.Rinon A, et al. p53 coordinates cranial neural crest cell growth and epithelialmesenchymal transition/delamination processes. Development. 2011;138:1827–1838. doi: 10.1242/dev.053645. [DOI] [PubMed] [Google Scholar]
- 21.Zhang Z, et al. Assessment of hematopoietic failure due to Rpl11 deficiency in a zebrafish model of Diamond-Blackfan anemia by deep sequencing. BMC Genomics. 2013;14:896. doi: 10.1186/1471-2164-14-896. [DOI] [PMC free article] [PubMed] [Google Scholar]
- 22.Sakai D, Dixon J, Achilleos A, Dixon M, Trainor PA. Prevention of Treacher Collins syndrome craniofacial anomalies in mouse models via maternal antioxidant supplementation. Nat Commun. 2016;7:10328. doi: 10.1038/ncomms10328. [DOI] [PMC free article] [PubMed] [Google Scholar]
- 23.Muscarella DE, Ellison EL, Ruoff BM, Vogt VM. Characterization of I-Ppo, an intron-encoded endonuclease that mediates homing of a group I intron in the ribosomal DNA of Physarum polycephalum. Mol Cell Biol. 1990;10:3386–3396. doi: 10.1128/mcb.10.7.3386. [DOI] [PMC free article] [PubMed] [Google Scholar]
- 24.Flick KE, Jurica MS, Monnat RJ, Jr, Stoddard BL. DNA binding and cleavage by the nuclear intron-encoded homing endonuclease I-PpoI. Nature. 1998;394:96–101. doi: 10.1038/27952. [DOI] [PubMed] [Google Scholar]
- 25.Chailleux C, et al. Quantifying DNA double-strand breaks induced by site-specific endonucleases in living cells by ligation-mediated purification. Nat Protocols. 2014;9:517–528. doi: 10.1038/nprot.2014.031. [DOI] [PubMed] [Google Scholar]
- 26.Song C, Hotz-Wagenblatt A, Voit R, Grummt I. SIRT7 and the DEAD-box helicase DDX21 cooperate to resolve genomic R loops and safeguard genome stability. Genes Dev. 2017 doi: 10.1101/gad.300624.117. http://dx.doi.org/10.1101/gad.300624.117. [DOI] [PMC free article] [PubMed]
- 27.Buecker C, et al. Reorganization of enhancer patterns in transition from naive to primed pluripotency. Cell Stem Cell. 2014;14:838–853. doi: 10.1016/j.stem.2014.04.003. [DOI] [PMC free article] [PubMed] [Google Scholar]
- 28.Bajpai R, et al. CHD7 cooperates with PBAF to control multipotent neural crest formation. Nature. 2010;463:958–962. doi: 10.1038/nature08733. [DOI] [PMC free article] [PubMed] [Google Scholar]
- 29.Prescott SL, et al. Enhancer divergence and cis-regulatory evolution in the human and chimp neural crest. Cell. 2015;163:68–83. doi: 10.1016/j.cell.2015.08.036. [DOI] [PMC free article] [PubMed] [Google Scholar]
- 30.Hu S, et al. Effects of cellular origin on differentiation of human induced pluripotent stem cell-derived endothelial cells. JCI Insight. 2016;1:e85558. doi: 10.1172/jci.insight.85558. [DOI] [PMC free article] [PubMed] [Google Scholar]
- 31.Burridge PW, et al. Chemically defined generation of human cardiomyocytes. Nat Methods. 2014;11:855–860. doi: 10.1038/nmeth.2999. [DOI] [PMC free article] [PubMed] [Google Scholar]
- 32.Carey MF, Peterson CL, Smale ST. Dignam and Roeder nuclear extract preparation. Cold Spring Harb Protoc. 2009 doi: 10.1101/pdb.prot5330. http://dx.doi.org/10.1101/pdb.prot5330 (2009) [DOI] [PubMed]
- 33.Nieuwkoop PD, Faber J, editors. Normal Table of Xenopus laevis (Daudin): A Systematical and Chronological Survey of the Development from the Fertilized Egg Till the End of Metamorphosis. Garland; 1994. [Google Scholar]
- 34.Grier JD, Yan W, Lozano G. Conditional allele of mdm2 which encodes a p53 inhibitor. Genesis. 2002;32:145–147. doi: 10.1002/gene.10066. [DOI] [PubMed] [Google Scholar]
- 35.Danielian PS, Muccino D, Rowitch DH, Michael SK, McMahon AP. Modification of gene activity in mouse embryos in utero by a tamoxifen-inducible form of Cre recombinase. Curr Biol. 1998;8:1323–1326. doi: 10.1016/s0960-9822(07)00562-3. [DOI] [PubMed] [Google Scholar]
- 36.Truett GE, et al. Preparation of PCR-quality mouse genomic DNA with hot sodium hydroxide and tris (HotSHOT) Biotechniques. 2000;29:52–54. doi: 10.2144/00291bm09. [DOI] [PubMed] [Google Scholar]
- 37.Flynn RA, et al. Dissecting noncoding and pathogen RNA-protein interactomes. RNA. 2015;21:135–143. doi: 10.1261/rna.047803.114. [DOI] [PMC free article] [PubMed] [Google Scholar]
- 38.Zarnegar BJ, et al. irCLIP platform for efficient characterization of protein–RNA interactions. Nat Methods. 2016;13:489–492. doi: 10.1038/nmeth.3840. [DOI] [PMC free article] [PubMed] [Google Scholar]
Associated Data
This section collects any data citations, data availability statements, or supplementary materials included in this article.
Supplementary Materials
Data Availability Statement
Data that support the findings of this study have been deposited in the Gene Expression Omnibus under accession number GSE89420. Source Data for Figs 1–4 and Extended Data Figs 8 and 9 have been provided. Source Data for western blots shown in Fig. 4 and Extended Data Figs 2–5, 7 and 9 have been provided in Supplementary Fig. 1. All other relevant data that support the findings of this study are available from the corresponding author upon reasonable request.


