Abstract
Objective
Resting state functional connectivity (RSFC) allows the study of functional organization in normal and diseased brain by measuring the spontaneous brain activity generated under resting conditions. Intrinsic optical signal imaging (IOSI) based on multiple illumination wavelengths has been used successfully to compute RSFC maps in animal studies. The IOSI setup complexity would be greatly reduced if only a single wavelength can be used to obtain comparable RSFC maps.
Approach
We used anesthetized mice and performed various comparisons between the RSFC maps based on single wavelength as well as oxy-, deoxy- and total hemoglobin concentration changes.
Main Results
The RSFC maps based on IOSI at a single wavelength selected for sensitivity to the blood volume changes are quantitatively comparable to the RSFC maps based on oxy- and total hemoglobin concentration changes obtained by the more complex IOSI setups. Moreover, RSFC maps do not require CCD cameras with very high frame acquisition rates, since our results demonstrate that they can be computed from the data obtained at frame rates as low as 5 Hz.
Significance
Our results will have general utility for guiding future RSFC studies based on IOSI and making decisions about the IOSI system designs.
Keywords: resting state functional connectivity, cerebral cortex, intrinsic optical signal imaging
1. Introduction
Resting state functional connectivity (RSFC) imaging is a technique to study spontaneous brain activity generated under resting conditions, without an external stimulus (Lee et al 2013). RSFC has been used to study both functional organization in normal resting human brain (Grecius et al 2002; De Luca et al 2006) and its perturbations due to neurological or psychiatric diseases (Cherkassky et al 2006; Zhou et al 2007). This method relies on computing the connectivity maps between different brain regions based on the temporal correlations of the fluctuations in the physiological observables acquired across the brain. Over the last 20 years, functional magnetic resonance imaging (fMRI) has been the technology of choice for RSFC (Biswal et al 1995). Over the last 10 years, optical imaging modalities, such as functional near infrared spectroscopy (Eggebrecht et al 2014), intrinsic optical signal imaging (White et al 2011), photoacoustic tomography (Nasiriavanaki et al 2014), and fluorescence imaging of calcium indicators (Ma et al 2016a; Xiao et al 2017) have also grown in popularity for measuring RSFC. Optical imaging technologies are particularly useful for preclinical animal studies due to their ability to measure numerous neurophysiological contrast mechanisms relevant to brain function, high spatio-temporal resolution, flexibility of the imaging setups, and low equipment cost.
Among the optical imaging modalities for the RSFC measurement, intrinsic optical signal imaging (IOSI) of the rodent cortex benefits particularly from relatively simplistic experimental setups and high temporal resolution over a large field of view. It has been recently used to study RSFC in normal mice, either as a standalone imaging modality (White et al 2011) or in combination with other optical imaging methods such as laser speckle flowmetry (LSF) (Bergonzi et al 2015) and fluorescence imaging of genetically encoded calcium indicators (Ma et al 2016a; Xiao et al 2017; Vanni et al 2014). In addition, IOSI has been used to study cortical functional connectivity disruption in mice due to focal ischemia (Bauer et al 2014) and amyloid-β deposition (Bero et al 2012; Liao et al 2014). IOSI relies on measuring light diffusely reflected from the brain surface to estimate changes in oxygenated, deoxygenated, and total hemoglobin concentration associated with changes in neuronal activity. Since changes in oxygenated, deoxygenated, and total hemoglobin (e.g., blood volume) arising from changes in neuronal activity are strongly correlated because of neuro-metabolic-vascular coupling (Hillman 2014), it is expected that any one of these signals can be used to obtain RSFC maps. The use of multiple wavelengths to permit estimation of the oxygenated and deoxygenated hemoglobin concentration changes results in more complex data acquisition and processing procedures. We expect that the use of a more simplistic, single wavelength experimental setup will provide the same quantitative RSFC maps and facilitate wider adoption of this technology by users interested is studying RSFC in normal and diseased/injured brain. Here, we quantitatively show that RSFC maps based on IOSI at only one wavelength selected for sensitivity to the blood volume changes are comparable to the RSFC maps obtained by more complex IOSI setups that include measurements at multiple wavelengths to obtain additional information about oxy- and deoxy- hemoglobin concentration changes. In addition, we show that RSFC maps computed from the CCD frames acquired at a rate as low as 5 Hz are still comparable with the RSFC maps obtained at much higher frame rates, further reducing the required complexity of the RSFC experimental configuration.
2. Methods
2.1. Animal Preparation
Mice (C57BL/6, male, 8–10 weeks old, 32–36 g) were anesthetized with an intraperitoneal injection of a mixture of Ketamine and Xylazine (100 mg/kg Ketamine, 20 mg/kg Xylazine). Animals were subsequently placed on a heating pad in a stereotaxic frame and their core body temperature was maintained at 37 ± 0.1 °C. The scalp was removed and mineral oil was applied to the bone surface to prevent it from drying and to reduce optical scattering. All animal procedures were approved by the Massachusetts General Hospital Subcommittee on Research Animal Care.
2.2. Imaging System
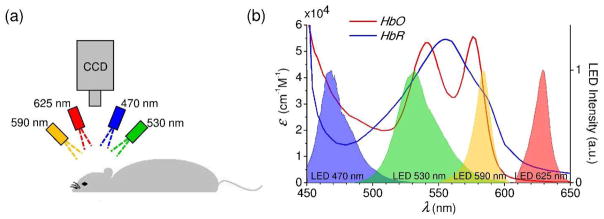
The imaging setup was similar to one presented in White et al (2011). Four light-emitting diodes (LEDs) with the center wavelengths at 470 nm, 530 nm, 590 nm, and 625 nm (MXL3-C1, Thorlabs, Inc., where X is the center wavelength) were positioned in a circular geometry above the mouse head. Each LED illuminated the exposed skull surface at the ≈30° oblique angle. LEDs were controlled by a micro controller (LCMXO2-7000HE-B-EVN, Lattice Semiconductor). Images were collected by a CCD camera (Cascade 512F, Photometrics, 512 × 512 pixels) in a frame transfer mode. We used μManager software for the CCD camera image acquisition (Edelstein et al 2014). The LEDs were gated sequentially by a CCD exposure out signal (exposure time = 10 ms). Crossed linear polarizers were placed in front of the LEDs and camera to attenuate the specular reflection from the mouse head. The CCD frame rate was set to 95 Hz by using 4 × 4 binning, which resulted in 23.75 frames per second (fps) for each LED color. The duration of each imaging session was 5 min. All presented RSFC maps were computed based on individual imaging sessions. In all experiments, we tuned the LED powers to achieve similar mean CCD pixel intensities from diffusely reflected light at different wavelengths.
2.3. Image Processing
We computed resting state functional connectivity maps based on i) optical density changes (ΔOD) in images of diffusely reflected light from each individual LED and ii) changes in oxy-hemoglobin concentration (Δ[HbO](t)), deoxy-hemoglobin concentration (Δ[HbR](t)), and total hemoglobin concentration (Δ[HbT](t)), computed based on images from LEDs with the center wavelengths λ at 530 nm, 590 nm, and 625 nm.
From the time sequence of CCD frames acquired using the LED with the center wavelength λ, we computed ΔOD(λ,t) at each CCD pixel as
| (1) |
In Eq. (1), I(λ,t) is the measured reflected light intensity at time t and I0(λ) is a baseline intensity at time t=0. Since I(λ,t) fluctuates around its baseline value during resting state measurements, I0(λ) was approximated with <I(λ,t)>, where < > represents temporal averaging over an entire imaging sequence. Please note that in Eq. (1) we used a natural logarithm.
We assumed that the change in the optical absorption coefficient μa(λ,t) at each wavelength is due to a change in total hemoglobin concentration and oxygenation and that it may be calculated by using a modified Beer-Lambert law
| (2) |
where L(λ) is a wavelength-dependent mean path length of the light in the tissue (Kohl et al 2000). We estimated Δμa(λ,t) at each CCD pixel and each LED center wavelength λ as Δμa(λ,t) = −ln[I(λ,t)/<I(λ,t)>]/L(λ). We subsequently used the estimated changes in absorption coefficients to calculate changes in an oxy-hemoglobin concentration (Δ[HbO](t)) and a deoxy-hemoglobin concentration (Δ[HbR](t)) at each pixel and each time using the system of equations
| (2) |
where εHbO(λ) and εHbR(λ) are molar extinction coefficients of oxy- and deoxy-hemoglobin, respectively, obtained from Prahl (1999).
2.4. Functional Connectivity Analysis
Data analysis was performed using custom written procedures in MATLAB (MathWorks, Inc.). Functional connectivity maps were generated based on ΔOD(λ,t) maps obtained at each LED wavelength (e.g., at 470 nm, 530 nm, 590 nm, and 625 nm) as well as based on calculated Δ[HbO](t), Δ[HbR](t), and Δ[HbT](t) maps. The data was first temporally averaged and then subsampled to one frame per second in order to reduce the required memory for data processing. Subsequently, data was band-pass filtered between 0.008 Hz and 0.09 Hz. In each animal, a mask was created to select the pixels of the image overlying the brain and to ignore the pixels that did not measure signals from the brain. Subsequent analyses were performed only for pixels within this mask. At each time point, the global mean was regressed from each pixel to remove a global source of variance, as is typically done in RSFC analyses for optical (White et al 2011) and fMRI (Desjardins 2001) studies.
The seed-based correlation analysis (Figures 3, 4, and 6) was performed by first manually selecting a seed point within the brain mask. The seed points were selected in a primary motor area (1.3 mm AP (anterior-posterior) from Bregma and 1.4 mm ML (midline-lateral)) and a primary visual area (−3.6 mm AP and 2.0 mm ML). The primary motor and visual cortical regions are typically exhibiting both large, connected RSFC areas when the seed point is placed inside them and large homotopic RSFC (Bauer et al 2014; Vincent et al 2007). To improve the signal-to-noise-ratio (SNR), the signal from the seed point represented an average over 5×5 pixels (approximately 0.55 × 0.55 mm2). Subsequently, the signal from the seed was correlated against each pixel within the brain mask to create a map of functional connectivity.
In the interhemispheric homotopic correlation map (Figure 5), the correlation coefficient was calculated for each pair of pixels placed symmetrically with respect to the midline of the brain and its value was assigned to both pixel positions.
3. Results
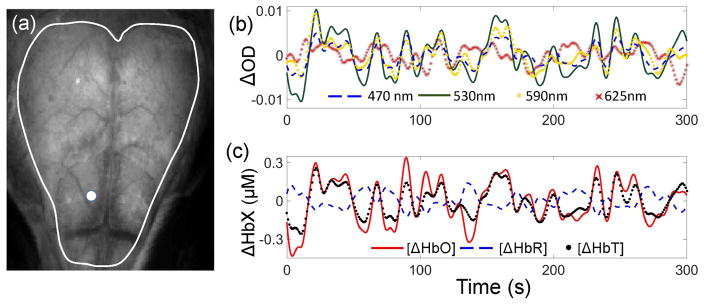
Figure 2 shows the typical time courses of the optical density changes at different wavelengths (Figure 2(b)) and changes in the HbO, HbR, and HbT concentrations (Figure 2(c)), estimated at one location on the cortical surface (Figure 2(a)). Assessment of the temporal signal changes indicates a positive correlation between OD at 470 nm, 530 nm, and 590 nm, and HbT and HbO concentrations, with the correlation coefficient r greater than 0.75 between any two from this group. The LED center wavelengths of 530 nm and 590 nm are close to the hemoglobin isosbestic points, and therefore the signals at these wavelengths are primarily sensitive to the total hemoglobin concentration (and thus blood volume changes under the assumption that hematocrit is not changing). Importantly, at 470 nm, 530 nm, and 590 nm, the optical absorption of hemoglobin is generally large regardless of the hemoglobin species (Figure 1(b)), further increasing the signal sensitivity to Δ[HbT]. Δ[HbO] exhibits positive and Δ[HbR] negative correlation with Δ[HbT] (r = 0.94 and −0.88, respectively), as it is typically observed that functional hyperemia results in concurrent transient increases in [HbT] and [HbO] and a decrease in [HbR]. Finally, HbR absorption at 625 nm is dominant, causing ΔOD at this wavelength to be positively correlated with Δ[HbR] (r=0.41).
Figure 2.
(a) The exposed mouse skull image obtained under LED illumination. White line outlines a region of interest selected for computing the connectivity maps. (b) Typical time courses of the optical density changes measured at 470 nm, 530 nm, 590 nm, and 625 nm. ΔOD at 590 nm and 625 nm were multiplied by 3 and 4, respectively, to appear on the same scale as the rest of the signals. (c) Time courses of the Δ[HbO], Δ[HbR], and Δ[HbT]. White dot in panel (a) marks the measurement location of the signals plotted in panels (b) and (c).
Figure 1.
(a) Experimental setup. The exposed skull was illuminated sequentially by four LEDs. (b) Molar extinction coefficient of oxy- and deoxy-hemoglobin for the spectral range covered by the four LEDs used in the setup. Measured LED spectral profiles are presented with their peak intensities normalized to unity.
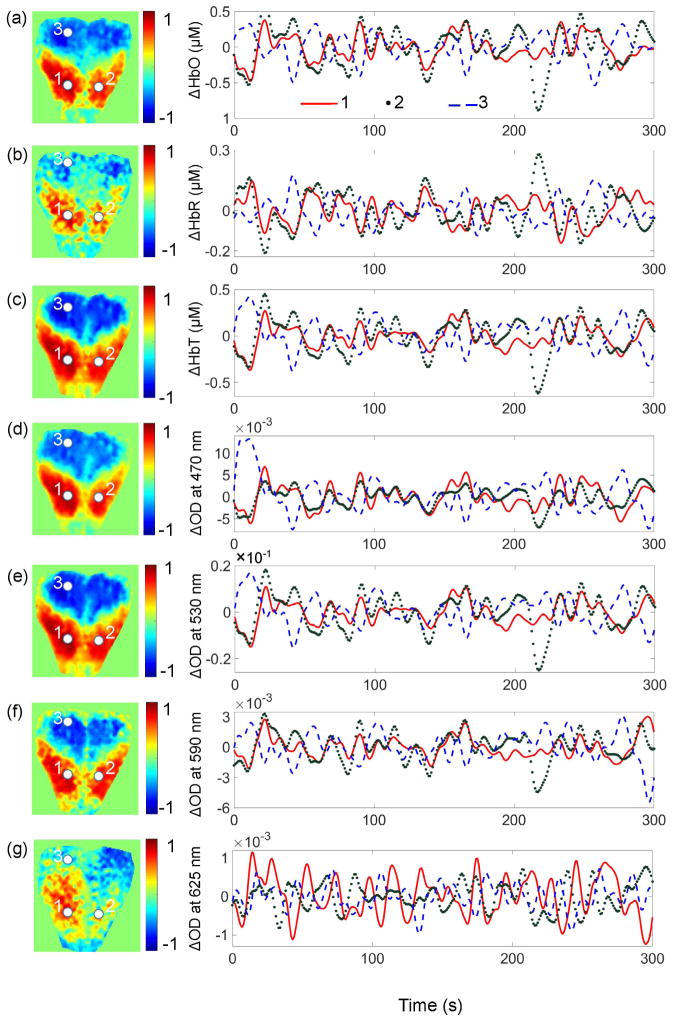
Figure 3 presents connectivity maps computed based on Δ[HbO], Δ[HbR], and Δ[HbT] (Figures 3(a)–3(c), respectively) as well as based on ΔOD at 470 nm, 530 nm, 590 nm, and 625 nm (Figures 3(d)–3(g), respectively). Connectivity maps on the left were computed using the seed point at location 1, while temporal signal traces presented on the right were obtained from the locations 1, 2, and 3. Points 1 and 2 are positioned over the primary motor area in the frontal cortex, symmetrically with respect to the midline, and point 3 is positioned in the primary visual area. Therefore, all signals computed at these two locations exhibit strong positive correlation. However, point 3 is positioned over the occipital cortex and shows a strong negative correlation with point 1.
Figure 3.
Resting state functional cortical connectivity mapping using different signals derived from IOSI. (a)-(g) Connectivity maps based on Δ[HbO], Δ[HbR], Δ[HbT], and ΔOD at 470 nm, 530 nm, 590 nm, and 625 nm, respectively. The maps on the left were computed using the seed point at location 1 marked with the white circle. Correlation coefficients computed between temporal signal traces at each pixel in the map and the seed are color coded with the color bar plotted on the right-hand side of each figure. The temporal signal traces presented on the right were obtained from the locations 1, 2, and 3.
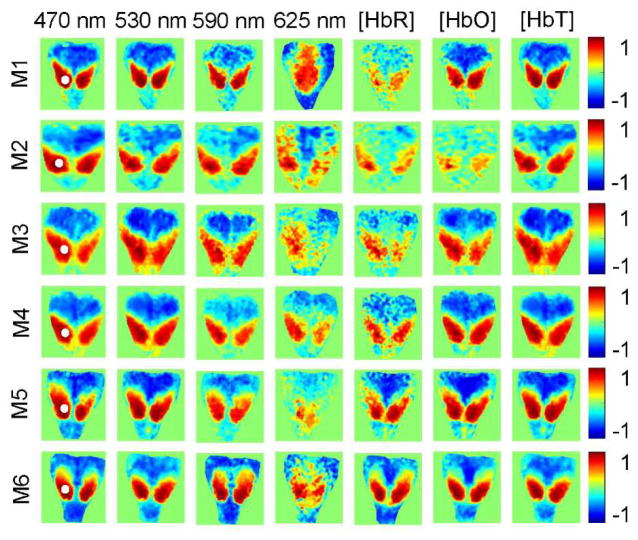
Resting state functional connectivity mapping can be performed by using either one of 7 different signals (Δ[HbO], Δ[HbR], Δ[HbT], and ΔOD at 470 nm, 530 nm, 590 nm, and 625 nm), as can be seen in Figure 3. However, visual inspection of the maps in Figure 3 indicates that the quality of the mapping varies with which signal is used. Specifically, the maps based on Δ[HbR] and ΔOD at 625 nm appear noisier than the maps based on Δ[HbO], Δ[HbT], and ΔOD at wavelengths exhibiting significant hemoglobin absorption. This is further confirmed by comparing similarly computed maps from 6 mice presented in Figure 4. From each panel in Figure 4 we computed a mean absolute correlation coefficient (MACC) (Table 1), which value is expected to decrease in the more noisy maps. The MACC from ΔOD at 625 nm (0.34±0.09; mean ± STD) is statistically significantly smaller (p=0.01; two-sample t-test, α=0.05) than the MACC from [HbT] (0.46±0.04) and ΔOD at 470 nm (0.45±0.03) and 530 nm (0.46±0.04), while comparison with the MACC from [HbO] (0.40±0.12) did not reach statistical significance (p=0.16). Similarly, the MACC from [HbR] (0.32±0.10) is significantly smaller (p=0.01) than the MACC from [HbT] and ΔOD at 470 nm and 530 nm.
Figure 4.
Comparison of the connectivity maps based on the Δ[HbO], Δ[HbR], Δ[HbT], and ΔOD at 470 nm, 530 nm, 590 nm, and 625 nm in 6 mice (M1–M6). Color bars present the correlation coefficients computed between temporal signal traces at each pixel in the map and the seed, the location of which is marked with the white circle on the left panels. Maps from M3 were also presented in Figure 3.
Table 1.
Mean absolute correlation coefficient (MACC) from the panels in Figure 4. Values are represented as mean±STD.
| Mouse # | ΔOD (470 nm) |
ΔOD (530 nm) |
ΔOD (590 nm) |
ΔOD (625 nm) |
[HbR] | [HbO] | [HbT] |
|---|---|---|---|---|---|---|---|
| M1 | 0.46±0.27 | 0.46±0.26 | 0.39±0.25 | 0.46±0.22 | 0.24±0.16 | 0.43±0.27 | 0.46±0.26 |
| M2 | 0.43±0.26 | 0.38±0.23 | 0.34±0.23 | 0.32±0.21 | 0.20±0.16 | 0.16±0.13 | 0.39±0.24 |
| M3 | 0.41±0.24 | 0.50±0.24 | 0.39±0.24 | 0.39±0.19 | 0.28±0.19 | 0.41±0.23 | 0.50±0.24 |
| M4 | 0.44±0.25 | 0.47±0.25 | 0.32±0.21 | 0.30±0.20 | 0.36±0.21 | 0.47±0.24 | 0.47±0.25 |
| M5 | 0.48±0.25 | 0.49±0.25 | 0.36±0.21 | 0.19±0.15 | 0.40±0.15 | 0.49±0.27 | 0.49±0.26 |
| M6 | 0.50±0.24 | 0.44±0.23 | 0.50±0.23 | 0.36±0.22 | 0.45±0.25 | 0.44±0.26 | 0.44±0.23 |
| Mean±STD (all mice) | 0.45±0.03 | 0.46±0.04 | 0.38±0.06 | 0.34±0.09 | 0.32±0.10 | 0.40±0.12 | 0.46±0.04 |
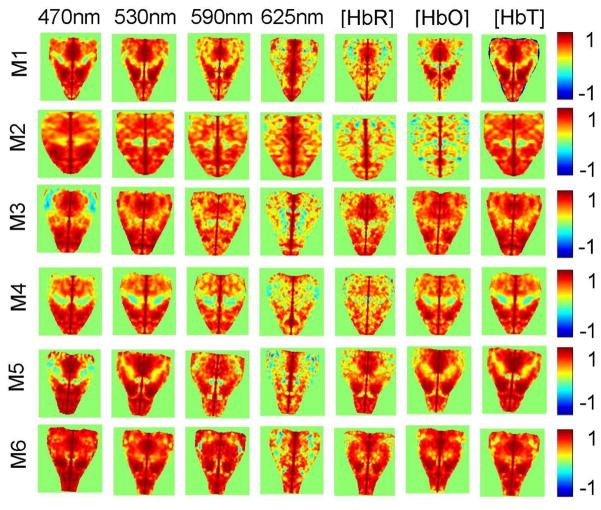
We computed interhemispheric homotopic correlation maps to further quantitatively explore the quality of the resting state connectivity maps based on different signals. In Figure 5, the correlation coefficient is computed between each of the two CCD pixels symmetrically positioned with respect to the midline of the skull, and the value of the correlation coefficient result is assigned to both pixels. Since the strong positive correlation was observed between homotopic brain regions in both humans and rodents (Stark et al 2008, Toro et al 2008, White et al 2011), we expect that the maps in Figure 5 with the largest surface area colored red (i.e. with a correlation coefficient closest to 1) provide the highest quality RSFC maps in terms of image SNR.
Figure 5.
Interhemispheric homotopic cortical correlation maps based on Δ[HbO], Δ[HbR], Δ[HbT], and ΔOD at 470 nm, 530 nm, 590 nm, and 625 nm in 6 mice (M1–M6). Color bars represent correlation coefficients computed between each pair of pixels positioned symmetrically with respect to the skull midline.
Mean interhemispheric homotopic correlation coefficient (IHHC) from each of the panels in Figure 5 is presented in Table 2. The largest correlation coefficient is obtained from the maps based on Δ[HbT] and ΔOD at 530 nm (0.61±0.05; mean ± STD). They are closely followed by ΔOD at wavelengths with a large hemoglobin absorption (e.g., 470 nm and 590 nm) and Δ[HbO]. Indeed, pairwise comparison of the mean IHHC from [HbO], [HbT], and ΔOD at 470 nm, 530 nm, and 590 nm results in no statistical differences (two-sample t-test, α=0.05). Finally, Δ[HbR] and ΔOD at 625 nm have the lowest scores, 0.46±0.11 and 0.41±0.08, respectively. The mean IHHC from ΔOD at 625 nm is statistically significantly smaller than the mean IHHC from [HbT] and ΔOD at 470 nm, 530 nm, 590 nm (p=0.0003, 0.03, 0.0002, and 0.01, respectively). Similarly, the mean IHHC from [HbR] is significantly smaller than the mean IHHC from [HbT] and ΔOD at 470 nm and 530 nm (p=0.01, 0.04, and 0.01, respectively).
Table 2.
Mean interhemispheric homotopic correlation coefficient (IHHC) from the panels in Figure 5. Values are represented as mean±STD.
| Mouse # | ΔOD (470 nm) |
ΔOD (530 nm) |
ΔOD (590 nm) |
ΔOD (625 nm) |
[HbR] | [HbO] | [HbT] |
|---|---|---|---|---|---|---|---|
| M1 | 0.59±0.26 | 0.59±0.25 | 0.49±0.25 | 0.48±0.30 | 0.37±0.29 | 0.42±0.31 | 0.60±0.24 |
| M2 | 0.61±0.21 | 0.58±0.20 | 0.51±0.21 | 0.49±0.25 | 0.34±0.27 | 0.25±0.28 | 0.56±0.20 |
| M3 | 0.48±0.35 | 0.61±0.21 | 0.50±0.21 | 0.32±0.30 | 0.49±0.26 | 0.61±0.16 | 0.62±0.21 |
| M4 | 0.51±0.28 | 0.53±0.25 | 0.45±0.26 | 0.35±0.28 | 0.40±0.24 | 0.51±0.23 | 0.53±0.26 |
| M5 | 0.54±0.34 | 0.66±0.22 | 0.56±0.23 | 0.35±0.32 | 0.54±0.26 | 0.57±0.24 | 0.66±0.22 |
| M6 | 0.75±0.15 | 0.68±0.18 | 0.68±0.22 | 0.45±0.30 | 0.62±0.22 | 0.66±0.22 | 0.66±0.19 |
| Mean±STD (all mice) | 0.58±0.10 | 0.61±0.05 | 0.53±0.08 | 0.41±0.08 | 0.46±0.11 | 0.50±0.15 | 0.61±0.05 |
Figure 6 presents resting state functional connectivity maps at different CCD frame rates. Connectivity maps were computed based on ΔOD at 530 nm, which exhibits one of the largest mean correlation scores in Table 2. The data was acquired at a 25 Hz frame rate and subsequently down-sampled without filtering to 5 Hz, 2 Hz and 0.5 Hz for further processing. RSFC maps were computed for three seed point locations. They exhibit only minor degradation at 5 Hz compared to 25 Hz (mean IHHC is 0.59 ± 0.23 and 0.56 ± 0.21 at 25 Hz and 5 Hz, respectively), with progressive worsening at 2 Hz (0.43 ± 0.24) and 0.5 Hz (0.30 ± 0.23).
Figure 6.
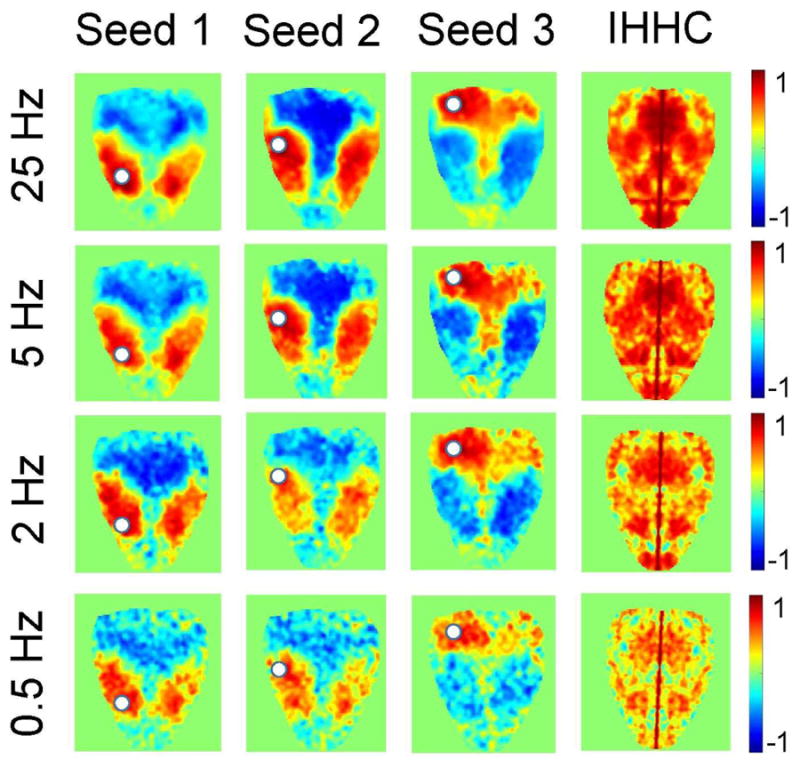
Resting state functional connectivity maps based on ΔOD at 530 nm at different CCD frame rates: 25 Hz, 5 Hz, 2 Hz, and 0.5 Hz. First three columns of image panels were computed based on a seed location marked with the white circle. Fourth column shows the maps of interhemispheric homotopic correlation coefficient (IHHC) for different CCD frame rates.
4. Discussion and conclusion
We have shown that RSFC maps based on IOSI imaging of oxyhemoglobin and deoxyhemoglobin concentration changes using multiple wavelengths are quantitatively comparable to the RSFC maps based on a single wavelength selected for sensitivity to the total hemoglobin concentration changes. In Figure 5, we used the strength of the correlation between the homotopic cortical regions to quantify the quality of the IOSI signal. While all the signals computed based on our IOSI measurements (e.g., ΔOD at 470 nm, 530 nm, 590 nm, and 625 nm, as well as Δ[HbO], Δ[HbR], and Δ[HbT]) enabled seed-based connectivity maps, the greatest strength of interhemispheric homotopic correlations in Figure 5 was obtained when using Δ[HbT] and ΔOD at 530 nm – a wavelength that is an isosbestic point for hemoglobin (i.e. it reports Δ[HbT]) and at which hemoglobin exhibits large optical absorption (i.e. diffuse reflectance changes are dominated by the blood volume changes). This is also qualitatively confirmed by the visual appearance of the connectivity maps in Figures 3 and 4. The connectivity maps based on a signal from two other wavelengths that have large hemoglobin absorption (ΔOD at 470 nm and 590 nm), as well as Δ[HbO] also exhibit good SNR. The good performance of the Δ[HbO] and the Δ[HbT] signal when computing connectivity maps is in agreement with previous RSFC studies using IOSI, where RSFC maps were computed using either Δ[HbT] or Δ[HbO] (White et al 2011; Ma et al 2016a). On the contrary, Δ[HbR] and ΔOD at 625 nm obtained by our setup yield more noisy connectivity maps. Both group-averaged MACC and IHHC values for Δ[HbR] and ΔOD at 625 nm maps are statistically significantly lower than their Δ[HbT]-based counterparts, although Δ[HbR]- and Δ[HbT]-based RSFC maps are comparable in some mice (e.g., M5 and M6). This may be attributed to lower OD changes at 625 nm than at shorter wavelengths due to the significantly reduced hemoglobin absorption at 625 nm, as well as the reduced IOSI SNR of Δ[HbR] in comparison with Δ[HbT] and Δ[HbO]. Smaller changes in [HbR] during the hemodynamic response to brain activation are resulting from the competing effects of blood volume increases, which are increasing [HbR], and blood flow increases, which are decreasing [HbR]. While our assessment of the signal quality based on a strength of temporal correlations does not favor Δ[HbR] signal, it is currently unknown and, therefore, possible that RSFC based on Δ[HbR] may provide some unique insights into brain physiology. Therefore, it is important to note that by simplifying the IOSI setups to measure only Δ[HbT] at a single wavelength, one loses the ability to explore potential additional functional connections between cortical regions based on Δ[HbR] as well as Δ[HbO] (e.g., oximetric contrast) and underlying brain physiology. Moreover, in animal models with a compromised hyperemic response to neuronal activity (e.g. neurovascular uncoupling after spreading depression, intrinsic vasculopathy such as CADASIL), or in cases where hemodynamic responses are significantly altered or suppressed by different types of anesthesia or anesthesia depth, it may not be feasible to rely only on Δ[HbT] measurement to obtain RSFC maps. In those cases, oximetric contrast (or hemoglobin oxygen saturation) might better represent RSFC. Previous RSFC studies using IOSI did not focus on exploring the differences between the RSFC maps computed from Δ[HbR], Δ[HbO], and Δ[HbT] and published connectivity maps in normal brain, including Figures 3 and 4 in this manuscript, do not reveal obvious differences between them. Therefore, while multi-wavelength IOSI setups may potentially provide more comprehensive RSFC maps, we expect that a simpler, single-wavelength IOSI setup configuration to measure Δ[HbT] may be sufficient for many of the RSFC studies.
Recently, the use of genetically encoded calcium indicators to study RSFC in a rodent brain based on a wide field CCD imaging has gained popularity (Ma et al 2016a; Vanni et al 2014; Xiao et al 2017). It has been shown that the calcium indicator emission intensity is significantly affected by the optical absorption changes due to the hemodynamic response, where transient changes of [HbT] represent a major confounding factor (Ma et al 2016a). Therefore, single-wavelength IOSI setups for measuring Δ[HbT] are sufficient for applying the proposed correction of the signal from the calcium indicator (Ma et al 2016a). We also note that studying RSFC based on IOSI has an advantage of utilizing an endogenous contrast, not restricted to specific transgenic animals, a distinct advantage over calcium indicators. However, RSFC based on calcium signals may be especially advantageous when there is a possibility of neurovascular uncoupling.
We have also shown that, in addition to simplification of the IOSI setup regarding the choice of wavelengths, functional connectivity maps do not deteriorate significantly with the reduction of the CCD acquisition frame rate. In Figure 6, no obvious difference between connectivity maps can be observed over a 25 - 5 Hz range of the CCD frame rates. This may help with significantly relaxing the requirements for the experimental setup components (e.g., CCD camera, data storage) and increase the data processing speed. The typical upper limit of the bandpass filter applied to compute RSFC maps is ~0.1 Hz, which is well below the lowest frame rate applied in this study (0.5 Hz). This also suggests that the CCD frame rates ≥5 fps are helping to maintain the quality of the RSFC maps mostly by improving the SNR by excessive temporal averaging.
Finally, we would like to point out that the LEDs have broad emission spectra (Figure 1(b)), the shape of which may also change with the total emitted intensity (i.e., with applied LED driving current). All of this can complicate the analysis of the IOSI data and we recommend applying bandpass filters in front of the LEDs to both reduce the influence of the LED spectrum change and confine emission around the desired wavelength (Ma et al 2016b). While these considerations favor narrower bandpass filters, a compromise exists between bandwidth and available optical power.
In conclusion, we believe that our results will have general utility for guiding future RSFC studies based on IOSI, and that single wavelength IOSI experimental setups may facilitate wider adoption of this technology by users interested in studying RSFC in normal and diseased brain.
Acknowledgments
We are grateful to Adam Bauer for his guidance on replicating their experimental setup, and Silvina Ferradal and Erin Buckley for useful discussions. We gratefully acknowledge support from the NIH grants NS091230, NS055104, NS057198, EB021018, EB00790, and EB018464, the Fondation Leducq, the State Scholarship Fund of the China Scholarship Council (Construction of high-level university projects, No.201406100123), and the Natural Science Foundation of China (NSFC, nos. 81472150)
References
- Bauer AQ, Kraft AW, Wright PW, Lee J-M, Culver JP. Optical Imaging of disrupted functional connection following ischemic stroke in mice. Neuro Image. 2014;99:388–401. doi: 10.1016/j.neuroimage.2014.05.051. [DOI] [PMC free article] [PubMed] [Google Scholar]
- Bergonzi KM, Bauer AQ, Wright PW, Culver JP. Mapping functional connectivity using cerebral blood flow in the mouse brain. J Cerebral Blood Flow and Metabolism. 2015;35:367–70. doi: 10.1038/jcbfm.2014.211. [DOI] [PMC free article] [PubMed] [Google Scholar]
- Bero AW, Bauer AQ, Stewart FR, White BR, Cirrito JR, Raichle ME, Culver JP, Holtzman DM. Bidirectional relationship between functional connectivity and A-Beta plaque deposition in mouse brain. J Neuroscience. 2012;32:4334–40. doi: 10.1523/JNEUROSCI.5845-11.2012. [DOI] [PMC free article] [PubMed] [Google Scholar]
- Biswal B, Zerrin Yetkin F, Haughton VM, Hyde JS. Functional connectivity in the motor cortex of resting human brain using echo-planar MRI. Magn Reson Med. 1995;34:537–541. doi: 10.1002/mrm.1910340409. [DOI] [PubMed] [Google Scholar]
- Cherkassky VL, Kana RK, Keller TA, Just MA. Functional connectivity in a baseline resting-state network in autism. Neuroreport. 2006;17:1687–90. doi: 10.1097/01.wnr.0000239956.45448.4c. [DOI] [PubMed] [Google Scholar]
- De Luca M, Beckmann CF, De Stefano N, Matthews PM, Smith SM. fMRI resting state networks define distinct modes of long-distance interactions in the human brain. Neuroimage. 2006;29:1359–67. doi: 10.1016/j.neuroimage.2005.08.035. [DOI] [PubMed] [Google Scholar]
- Desjardins AE, Kiehl KA, Liddle PF. Removal of confounding effects of global signal in functional MRI analyses. Neuroimage. 2001;13:751–758. doi: 10.1006/nimg.2000.0719. [DOI] [PubMed] [Google Scholar]
- Edelstein AD, Tsuchida MA, Amodaj N, Pinkard H, Vale RD, Stuurman N. Advanced methods of microscope control using μManager software. Journal of Biological Methods. 2014;1:e11. doi: 10.14440/jbm.2014.36. [DOI] [PMC free article] [PubMed] [Google Scholar]
- Eggebrecht AT, Ferradal SL, Robichaux-Viehoever A, Hassanpour MS, Dehghani H, Snyder AZ, Hershey T, Culver JP. Mapping distributed brain function and networks with diffuse optical tomography. Nature photonics. 2014;8:448–454. doi: 10.1038/nphoton.2014.107. [DOI] [PMC free article] [PubMed] [Google Scholar]
- Greicius MD, Krasnow B, Reiss AL, Menon V. Functional connectivity in the resting brain: a network analysis of the default mode hypothesis. Proc Natl Acad Sci U S A. 2003;100:253–58. doi: 10.1073/pnas.0135058100. [DOI] [PMC free article] [PubMed] [Google Scholar]
- Hillman EMC. Coupling Mechanism and Significance of the BOLD Signal: A Status Report. Annual Review of Neuroscience. 2014;37:161–181. doi: 10.1146/annurev-neuro-071013-014111. [DOI] [PMC free article] [PubMed] [Google Scholar]
- Kohl M, Lindauer U, Royl G, Kühl M, Gold L, Villringer A, Dirnagl Physical model for the spectroscopic analysis of cortical intrinsic optical signals. Phys Med Biol. 2000;45:3749–64. doi: 10.1088/0031-9155/45/12/317. [DOI] [PubMed] [Google Scholar]
- Lee MH, Smyser CD, Shimony JS. Resting-State fMRI: A Review of Methods and Clinical Applications. American Journal of Neuroradiology. 2013;34:1866–72. doi: 10.3174/ajnr.A3263. [DOI] [PMC free article] [PubMed] [Google Scholar]
- Liao F, Hori Y, Hudry E, Bauer AQ, Jiang H, Mahan T, Lefton K, Zhang T, Dearborn J, Kim J, Culver JP, Betensky R, Wozniak D, Hymann B, Holtzman DM. Anti-ApoE antibody given after plaque onset decreases Aβ accumulation and improves brain function in a mouse model of Aβ amyloidosis. Journal of Neuroscience. 2014;34:7281–7292. doi: 10.1523/JNEUROSCI.0646-14.2014. [DOI] [PMC free article] [PubMed] [Google Scholar]
- Ma Y, Shaik MA, Kozberg MG, Kim SH, Portes JP, Timerman D, Hillman EMC. Resting-state hemodynamics are spatiotemporally coupled to synchronized and symmetric neural activity in excitatory neurons. Proc Natl Acad Sci U S A. 2016a;113:E8463–E8471. doi: 10.1073/pnas.1525369113. [DOI] [PMC free article] [PubMed] [Google Scholar]
- Ma Y, Shaik MA, Kim SH, Kozberg MG, Thibodeaux DN, Zhao HT, Yu H, Hillman EMC. Wide-field optical mapping of neural activity and brain haemodynamics: considerations and novel approaches. Phil Trans R Soc B. 2016b;371:20150360. doi: 10.1098/rstb.2015.0360. [DOI] [PMC free article] [PubMed] [Google Scholar]
- Nasiriavanaki M, Xia J, Wan H, Bauer A, Culver JP, Wang LV. High-resolution photoacoustic tomography of resting-state functional connectivity in the mouse brain. Proc Natl Acad Sci U S A. 2014;111:21–26. doi: 10.1073/pnas.1311868111. [DOI] [PMC free article] [PubMed] [Google Scholar]
- Prahl S. Optical Absorption of Hemoglobin. 1999 Available from: http://omlc.ogi.edu/spectra/hemoglobin/
- Stark DE, Margulies DS, Shehzad ZE, Reiss P, Kelly AM, Uddin LQ, Gee DG, Roy AK, Banich MT, Castellanos FX, Milham MP. Regional variation in interhemispheric coordination of intrinsic hemodynamic fluctuations. J Neurosci. 2008;28:13754–64. doi: 10.1523/JNEUROSCI.4544-08.2008. [DOI] [PMC free article] [PubMed] [Google Scholar]
- Toro R, Fox PT, Paus T. Functional coactivation map of the human brain. Cereb Cortex. 2008;18:2553–59. doi: 10.1093/cercor/bhn014. [DOI] [PMC free article] [PubMed] [Google Scholar]
- Vanni MP, Murphy TH. Mesoscale Transcranial Spontaneous Activity Mapping in GCaMP3 Transgenic Mice Reveals Extensive Reciprocal Connections between Areas of Somatomotor Cortex. Journal of Neuroscience. 2014;34:15931–46. doi: 10.1523/JNEUROSCI.1818-14.2014. [DOI] [PMC free article] [PubMed] [Google Scholar]
- Vincent JL, Patel GH, Fox MD, Snyder AZ, Baker JT, Essen DCV, Zempel JM, Snyder LH, Corbetta M, Raichle ME. Intrinsic functional architecture in the anaesthetized monkey brain. Nature. 2007;447:83. doi: 10.1038/nature05758. [DOI] [PubMed] [Google Scholar]
- White BR, Bauer AQ, Snyder AZ, Schlaggar BL, Lee JM, Culver JP. Imaging of Functional Connectivity in the Mouse Brain. PLoS ONE. 2011;6:e16322. doi: 10.1371/journal.pone.0016322. [DOI] [PMC free article] [PubMed] [Google Scholar]
- Xiao D, Vanni MP, Mitelut CC, Chan AW, LeDue JM, Xie Y, Chen ACN, Swindale NV, Murphy TH. Mapping cortical mesoscopic networks of single spiking cortical or sub-cortical neurons. eLife. 2017;6:e19976. doi: 10.7554/eLife.19976. [DOI] [PMC free article] [PubMed] [Google Scholar]
- Zhou Y, Liang M, Tian L, Wang K, Hao Y, Liu H, Liu Z, Jiang T. Functional disintegration in paranoid schizophrenia using resting- state fMRI. Schizophr Res. 2007;97:194–205. doi: 10.1016/j.schres.2007.05.029. [DOI] [PubMed] [Google Scholar]


