

Abstract
The challenges of evolution in a complex biochemical environment—coupling genotype to phenotype and protecting the genetic material—are solved elegantly in biological systems by nucleic acid encapsulation. In the simplest examples, viruses use capsids to surround their genomes. While these naturally occurring systems have been modified to change their tropism1 and to display proteins or peptides2–4, billions of years of evolution have favored efficiency at the expense of modularity, making viral capsids difficult to engineer. Synthetic systems composed of non-viral proteins could provide a “blank slate” to evolve desired properties for drug delivery and other biomedical applications, while avoiding the safety risks and engineering challenges associated with viruses. Here we create synthetic nucleocapsids—computationally designed icosahedral protein assemblies5, 6 with positively charged inner surfaces capable of packaging their own full-length mRNA genomes—and explore their ability to evolve virus-like properties by generating diversified populations using Escherichia coli as an expression host. Several generations of evolution resulted in drastically improved genome packaging (>133-fold), stability in whole murine blood (from less than 3.7% to 71% of packaged RNA protected after 6 hours of treatment), and in vivo circulation time (from less than 5 minutes to 4.5 hours). The resulting synthetic nucleocapsids package one full-length RNA genome for every 11 icosahedral assemblies, similar to the best recombinant adeno-associated virus (AAV) vectors7, 8. Our results show that there are simple evolutionary paths through which protein assemblies can acquire virus-like genome packaging and protection. Considerable effort has been directed at “top-down” modification of viruses to be safe and effective for drug delivery and vaccine applications1, 9, 10; the ability to computationally design synthetic nanomaterials and to optimize them through evolution now enables a complementary “bottom-up” approach with considerable advantages in programmability and control.
What minimal features are required for a synthetic system to encapsulate its own genome and to evolve biological functionality similar to viruses? In the nearly 40 years since the first high-resolution structure of an icosahedral virus11, the structures and functions of a wide array of viral capsids have been characterized. This has inspired efforts to reengineer naturally occurring protein containers12 and to design new polypeptides13 to package biological molecules. In one case, lumazine synthase—a naturally occurring, non-viral protein container—was evolved in E. coli to sequester a toxic protein14. However, there have been no reports of non-viral containers capable of encapsulating their own genomes and evolving in complex biochemical environments outside of cells.
We recently reported the design, with atomic-level accuracy, of two-component, 120-subunit icosahedral protein assemblies with internal volumes large enough to package biological macromolecules5. These highly stable and engineerable assemblies5, 6 in principle could be redesigned to package their own genomes: bicistronic mRNAs encoding the two protein subunits. We investigated this possibility by modifying two assemblies with accessible protein termini and no large pores, I53-47 and I53-505, either by introducing positively charged residues on their interior surfaces (I53-47-v1 and I53-50-v1; Fig. 1a; Extended Data Table 1a) or by genetically fusing the Tat RNA-binding peptide from Bovine Immunodeficiency Virus15 to the interior-facing C-terminus of one subunit (I53-50-Btat and I53-47-Btat). After expression and intracellular assembly in E. coli (Fig. 1b), intact protein assemblies were purified from cell lysates using immobilized metal affinity chromatography (IMAC) and size exclusion chromatography (SEC). The assemblies eluted as a single peak at the same retention volume as the original design5 (Extended Data Fig. 1), and intact particles were observed by negative-stain transmission electron microscopy (Fig. 1c, Extended Data Fig. 1a). After purification, the assemblies were incubated with RNase A for 10 minutes at 25 °C to degrade any RNA not protected inside the synthetic capsid-like proteins. Nucleic acid and protein co-migrated on native agarose gels (Fig. 1d,e, Extended Fig. 1b,c), suggesting the remaining nucleic acid was encapsulated in the protein assembly. Nucleic acid extraction followed by reverse transcription quantitative PCR (RT-qPCR) and Sanger sequencing confirmed that full-length RNA genomes were packaged and protected from RNase by I53-50-v1 and I53-50-Btat but not the original I53-50 design (Fig. 1f); all versions of I53-47 could package their genomes (Extended Data Fig. 1d). In all cases, RT-PCR products were only obtained upon addition of reverse transcriptase, indicating that the protected nucleic acids were RNA and not DNA. We refer to these designed RNA-protein complexes as synthetic nucleocapsids.
Figure 1. Biochemical characterization of synthetic nucleocapsids.
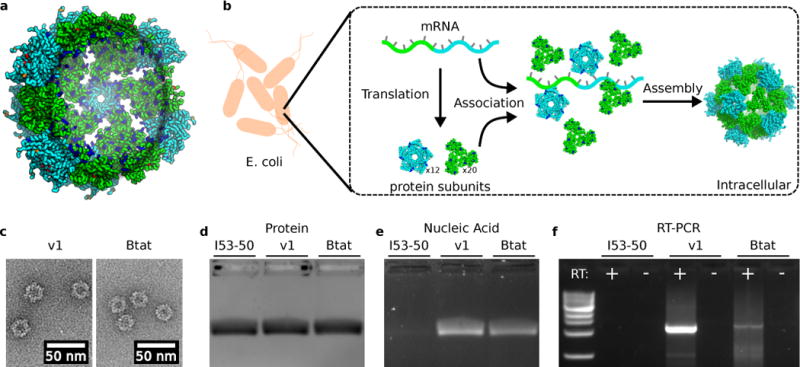
a. Design model of I53-50-v1. Increasing the net positive interior charge permits RNA encapsulation. Trimeric subunits are colored green and pentameric subunits are colored cyan. Mutations with respect to the original I53-50 protein assembly7 are colored blue (increases positive charge and/or decreases negative charge [e.g., E→N, N→K, E→K]), orange (no change in charge [e.g., E→D, N→T, K→R]), or red (decreases positive charge and/or increases negative charge [e.g., N→E, K→N, K→E]). b. Synthetic nucleocapsids encapsulate their own mRNA genomes while assembling into icosahedral capsids inside E. coli cells. c. Negative-stain electron micrographs of I53-50-v1 (positively-charged interior) and I53-50-Btat (RNA binding tat peptide from bovine immunodeficiency virus). Micrographs shown are representative of the entire sample tested on between one and three different grids, each at a different concentration. d,e. Synthetic nucleocapsids were purified, treated with RNase A, and electrophoresed on non-denaturing 1% agarose gels then stained with Coomassie (protein, d) and SYBR gold (nucleic acid, e). Nucleic acids co-migrated with capsid proteins for I53-50-v1 and I53-50-Btat, but not for the original I53-50. f. Full-length synthetic nucleocapsid genomes were recovered from each sample by RT-PCR. White + and – indicate PCR performed on template prepared with and without reverse transcriptase, respectively, confirming that I53-50-v1 and I53-50-Btat package their own full-length RNA genomes. This procedure is part of our standard quality control for synthetic nucleocapsids and has been performed reproducibly more than 10 times.
To investigate whether synthetic nucleocapsids can evolve, we generated combinatorial libraries of synthetic nucleocapsid variants and selected for improved genome packaging and fitness against nuclease challenge. Nine positions on the interior surfaces of I53-50-v1 and I53-50-Btat were mutated to positive, negative, or uncharged polar amino acids (Table S1) to produce variants with a wide range of interior charge distributions. We performed three rounds of selection comprising expression, purification, RNase challenge, RNA recovery, and re-cloning (Fig. 2a). The RNA recovered from the selected population after each round was reverse-transcribed and sequenced on an Illumina MiSeq. The net interior charge of the evolved population converged to narrow distributions around 388 ± 87 (mean ± standard deviation of the population) in the absence of Btat and 662 ± 91 (480 of which are from 60 copies of Btat) in the presence of Btat (Fig. 2b). 1170 different variants exhibited higher enrichment than I53-50-v1 (Fig. 2c); there are evidently many solutions to the genome packaging problem. The presence or absence of the positively charged Btat peptide influenced the identities of beneficial mutations—all except two of the lysine residues were beneficial in the absence of Btat (Fig. 2d), whereas most lysine residues were disfavored in the presence of Btat (Fig. 2e). We combined the substitutions from one of the most highly enriched variants from the library lacking Btat (Fig. 2c; trimeric subunit: K178N, K183N, E189K; pentameric subunit: K123N, H125K) with the most enriched substitution from a separate library of mutants in the trimer-pentamer interface (pentameric subunit: E24F; fig. S2; Table S1) to produce I53-50-v2, which exhibited improved genome packaging efficiency as assessed by RT-qPCR (Extended Data Fig. 2a). The net interior charge did not change between I53-50-v1 and I53-50-v2—the improved genome packaging and protection results from reconfiguration of the position of the charges (Fig. 2f). I53-50-v2 outperformed the best variants from the I53-50-Btat library (Extended Data Fig. 2a), so we focused on I53-50-v2 for subsequent evolution experiments.
Figure 2. Evolution of optimal interior charge for RNA packaging.
a. A library of plasmids encoding synthetic nucleocapsid variants is transformed into E. coli. Each cell in the population produces a unique synthetic nucleocapsid variant. Nucleocapsids are purified en masse from cell lysates and challenged (e.g., RNase, heat, blood, mouse circulation). The capsid-protected mRNA is then recovered and amplified using RT-qPCR, re-cloned into a plasmid library, and transformed into E. coli for another generation. b-f. Combinatorial libraries targeting nine residues on the interior surface of I53-50 (Table S1) were used to investigate how interior surface charge affects RNA packaging in the presence or absence of a positively charged RNA binding peptide (Btat). Three rounds of evolution were performed with two independent biological replicates. b. The evolved populations converged toward narrow distributions of interior net charge: Btat- library from 215 ± 114 (mean ± standard deviation) to 388 ± 87, Btat+ library from 733 ± 119 to 662 ± 91. The net interior charge of each variant was calculated from its sequence by summing the positive and negative residues on the interior surface. Black lines are without Btat and gray lines are with Btat; dashed lines are naïve populations and solid lines are round 3 selected populations. These results represent the combined population distribution of two independent evolutionary trajectories. c. Rank order list of variants observed in both biological replicates; 1170 unique variants outperformed I53-50-v1. I53-50-v2 was created based on the second most highly enriched variant from the Btat- library. d,e. Heatmap of log enrichments for each mutation explored in the combinatorial surface charge optimization library. All except two of the lysine residues were beneficial in the absence of the positively charged Btat, whereas most lysine residues were disfavored in the presence of Btat. Purple and orange indicate mutations that were depleted or enriched in the selected population, respectively. Blue squares and black dots indicate the I53-50-v1 starting sequence and I53-50-v2 selected sequence, respectively. f. Design model of I53-50-v2. Although the net interior surface charge did not change from I53-50-v1 to I53-50-v2, the spatial configuration of charged residues impacted genome packaging efficiency (see Fig. 4a). Coloring is as described in Fig. 1a.
The ability to evolve the nucleocapsids enabled comprehensive mapping of how each residue affects the fitness of a synthetic, 2.5 megadalton complex comprising 22,920 amino acids and 1,370 RNA bases. We produced a deep mutational scanning library16, 17 of I53-50-v2 with every residue in each protein subunit substituted with each of the 20 amino acids, and performed two consecutive rounds of selection with two biological replicates. Selection in the first round was performed at room temperature with 10 μg/mL RNase A for 10 minutes to deplete non-assembling variants from the population, and selection in the second round was at 37 °C for 1 hour with either 10 μg/mL RNase A or heparinized whole murine blood. Each biological replicate of the naive, round 1, and round 2 populations was sequenced on an Illumina MiSeq, and enrichment values were calculated from the fraction of the population corresponding to each variant before and after selection (Fig. 3a, b; 7,156 out of the possible 7,240 single mutants were observed with at least 10 counts in the pre-selection population). The enrichments of individual mutations were correlated between the RNase A and whole murine blood selections (Fig. 3c), suggesting that similar mechanisms underlie the increased genome protection in both cases.
Figure 3. Synthetic nucleocapsid fitness landscape.
Deep mutational scanning of I53-50-v2 enables comprehensive mapping of how each residue affects nucleocapsid fitness. a. Average log enrichments for all 20 amino acids at each position in the 2.5 megadalton capsid revealed that many native lysine and arginine residues (red circles) favor being mutated to other amino acids. b. Heatmap of log enrichments for all amino acids at the positions exhibiting the highest and lowest conservation. Purple and orange indicate mutations that were depleted or enriched in the selected population, respectively. Blue squares and black dots indicate the I53-50-v2 starting sequence and I53-50-v3 selected sequence, respectively. c. Average log enrichment was highly correlated between the RNase A (10 μg/mL RNase A, 37 °C, 1 hour) and heparinized murine blood (37 °C, 1 hour) selections, indicating that the beneficial mutations shared a common mechanism for improving nucleocapsid stability (RNase A vs blood: Pearson correlation r = 0.79; n = 1 biological replicate of each selection condition for the trimeric subunit and 2 independent biological replicates for the pentameric subunit). d. The core and interface residues of the capsid pentameric and trimeric subunits are more highly conserved than the surface residues. The color spectrum in panels d and g represents the average log enrichment of all 20 amino acids at the indicated position and is rescaled relative to that in panel c for clarity (purple is conserved and orange is highly mutated; see Methods). e. I53-50 design model with pentameric subunit (cyan), trimeric subunit (green), and pore indicated. f. Surface electrostatics (–, red; +, blue) and g. sequence conservation show that lysine and arginine residues are highly depleted in the capsid pore during evolution (in particular, trimeric subunit residues K8, K9, K11, K61, K145, K152). By contrast, the negatively charged E4 is highly conserved. These data suggest that positively charged residues in the capsid pore are deleterious for RNA packaging and protection.
Evaluating the enrichment values in the context of the I53-50 design model (Fig. 3d-g) provides insight into the features important for genome encapsulation and protection. I53-50 is composed of 20 trimers and 12 pentamers; the hydrophobic protein cores, intra-oligomer interfaces, and designed inter-oligomer interface were conserved (Fig. 3d, fig. S3)—proteins bearing mutations that disrupt the stability of the assembly likely fail to protect their genomes and are removed from the population. Strong selective pressure also operated on the electrostatics of the surface lining the pore between trimeric subunits of I53-50-v2—all highly depleted residues were lysines or arginines, whereas the nearby glutamate (residue E4) was highly conserved (Fig. 3f-g). Lysine removal around the pore also occurred in the earlier transition from I53-50-v1 to I53-50-v2—K179N in the trimer and K124N in the pentamer (Fig. 2d, fig. S4). Positively charged residues near the pores may compromise genome protection either by promoting protrusion of the encapsulated RNA from the interior of the icosahedral assembly—thereby rendering it susceptible to RNases—or by destabilizing the assembly through electrostatic repulsion between trimeric subunits. To test whether several of the most enriched mutations could be combined to produce a synthetic nucleocapsid with superior fitness, a combinatorial library was constructed containing charged and uncharged polar residues at positions where positively charged residues were deleterious in the deep mutational scanning data (trimeric subunit: K2, K8, K9, K11, K61). After selection in 10 μg/mL RNase A at 37 °C for 1 hour, the six most enriched variants were tested individually to evaluate their improvements over I53-50-v2 (Extended Data Fig. 2b-c). The one best protected under these conditions was designated I53-50-v3 (trimeric subunit: K2T, K9R, K11T, K61D). The failure of an assembly-defective variant to protect its genome (I53-50-v3-KO; trimeric subunit: V29R, pentameric subunit: A38R; fig. S5) confirmed that encapsulation was required for RNA protection.
We next investigated whether synthetic nucleocapsids can evolve inside an animal. As long circulation times are desirable for in vivo applications such as drug delivery, we decided to focus on this property. We hypothesized that the histidine tag might mediate undesired interactions in vivo, so we created cleavable versions that were used for all subsequent experiments (see supplementary methods). We produced two populations of synthetic nucleocapsids, one displaying hydrophilic 60-residue polypeptides of varying compositions intended to mimic viral glycosylation or PEGylation18 (Table S2) and another with 14 exterior surface positions combinatorially mutated to polar charged and uncharged amino acids (D, E, N, Q, K, R; Table S1). We administered each population of nucleocapsids to mice by retro-orbital injection (n = 5 mice for hydrophilic peptides and 6 for surface positions), and evaluated the survival of each member of the population in vivo by blood draws from the tail vein at successive time points. From both libraries, a number of distinct sequences drastically improved circulation times. An optimal amino acid composition emerged in the hydrophilic peptide library (Extended Data Fig. 3a-c). Arbitrary polypeptides with similar amino acid composition (e.g., 4.5 repeats of PETSPASTEPEGS or 4 repeats of PESTGAPGETSPEGS) increased circulation time, whereas other polypeptides composed of different amino acids (e.g., 12 repeats of ESESG) did not (Extended Data Fig. 3d-e). From the exterior surface library (Extended Data Fig. 4a-b), we isolated several variants exhibiting drastically enhanced circulation time compared to I53-50-v3 (Extended Data Fig. 4c-d) and found that the majority contained the E67K substitution in the pentameric subunit. We generated I53-50-v4 by incorporating E67K along with a set of other consensus mutations that were enriched in the selected population of synthetic nucleocapsids and may also contribute to increased expression and stability (Extended Data Table 1a; as the hydrophilic polypeptides reduced nucleocapsid yield, they were not included). Negative-stain electron micrographs of I53-50-v1, I53-50-v2, I53-50-v3, and I53-50-v4 showed that the functional improvements introduced by evolution did not compromise the designed icosahedral architecture (fig. S6), and dynamic light scattering indicated uniform populations of nucleocapsids around the expected size (radius = 13.5 nm; Extended Data Fig. 5).
What fraction of the I53-50-v4 synthetic nucleocapsids are filled, and with which RNAs? Negative-stain electron microscopy analysis of 15,119 particles suggests that the majority of I53-50-v4 nucleocapsids are more electron-dense—likely due to encapsulated nucleic acid—than the unfilled I53-50-v0 assemblies (Extended Data Fig. 6). Quantitation of bulk RNA and protein indicated that there is approximately one nucleocapsid genome-equivalent (1,433 nt) of total RNA encapsulated per 6.6 (I53-50-v1) and 4.8 (I53-50-v4) capsids (Extended Data Table 1b). Given that RNAseq showed that ~74% of this total RNA was derived from the nucleocapsid genome (I53-50-v4, Fig. 4e-f) and may include genome fragments, these data are consistent with our RT-qPCR quantitation of one full-length genome per 11 capsids (Extended Data Fig. 7). While capsid genomes are modestly enriched and ribosomal RNA is depleted in nucleocapsids relative to cells (Fig. 4e-f), I53-50-v4 does not exhibit increased specificity for its genome relative to I53-50-v1 (Extended Data Fig. 8a). Instead, packaging correlates strongly with expression level (Extended Data Fig. 8b), accounting for the encapsulation of a modest amount of host cell RNA. The ability to package arbitrary RNA sequences combined with the ability to assemble in vitro from purified subunits5 could make synthetic nucleocapsids the basis of a highly flexible platform for RNA delivery.
Figure 4. Increased fitness of evolved synthetic nucleocapsids.
Evolution drastically increases the property under selection without compromising previously evolved properties. a-c. Time courses of full-length RNA genomes per 1000 capsids isolated after challenge: a. 10 μg/mL RNase A at 37 °C (RNase, n = 3 independent reactions), b. Heparinized whole murine blood at 37°C (Blood, n = 3 independent reactions), and c. in vivo circulation in mice (Live mouse, n = 5 biologically independent animals). Error bars represent standard error of the mean. d. Summary of improved nucleocapsid properties, including total packaged RNA (10 μg/mL RNase A for 10 min at 25 °C to degrade non-encapsulated RNA, n = 3 independent reactions). The colored arrows in a-c indicate the 6-hour time point represented in the summary plot. Five synthetic nucleocapsids were tested: I53-50-v0 (original assembly which did not package its full length mRNA), I53-50-v1 (design with positive interior surface for packaging RNA), I53-50-v2 (evolution-optimized interior surface), I53-50-v3 (evolution-optimized residues lining the capsid pore), and I53-50-v4 (evolution-optimized exterior surface for increased circulation in living mice). Evolution resulted in efficient genome encapsulation for I53-50-v2 and its derivatives (approximately 1 RNA genome per 14 icosahedral capsids for I53-50-v2), protection from blood for I53-50-v3 and I53-50-v4 (82% and 71% protection, respectively), and increased circulation half-life for I53-50-v4 (4.5 hours serum half-life). Full-length RNA genomes were quantitated by RT-qPCR, capsid proteins were quantitated by Qubit, and genomes per capsid were calculated based on these values by dividing the number of genomes by the number of capsids. e. Nucleocapsid genomes are enriched and ribosomal RNA is depleted in nucleocapsids. f. Top 13 RNA transcripts encapsulated in I53-50-v4. Nucleocapsid genomes account for more than 74% of the packaged transcripts. g,h. The relative biodistribution of intact I53-50-v3 (g) and I53-50-v4 (h) nucleocapsids was evaluated by RT-qPCR of their full-length genomes recovered from mouse organs harvested 5 minutes or 4 hours after retro-orbital injection (n = 3 biologically independent animals at each time point for each nucleocapsid, I53-50-v3 and I53-50-v4). Red (5 minutes) and blue (240 minutes) bars represent the mean of three biologically independent animals, error bars represent the standard error of the mean, and thick black bars represent the detection limit of the assay. No obvious tissue tropism was observed for either nucleocapsid. At four hours post injection, I53-50-v3 had largely disappeared, while I53-50-v4 remained predominantly in the blood with lower levels in the other tissues.
Like modern viruses, our evolved synthetic nucleocapsids exhibit genome packaging, nuclease protection, and sustained circulation in vivo. Each evolutionary step (Extended Data Table 1a; Extended Data Fig. 9) improved the particular property under selection without compromising gains from previous steps (Fig. 4). The I53-50-v1 design provided a starting point for evolution, inefficiently packaging its own full-length genome. Evolving the interior surface produced I53-50-v2, which packages ~1 RNA genome for every 14 capsids, rivaling the best recombinant AAVs8, 9 (Fig. 4d). Subsequently, evolving the capsid pore for improved stability resulted in I53-50-v3, which protects 44% of its RNA when challenged by RNase A (10 μg/mL, 37 °C, 6 hours) and 82% of its RNA when challenged by whole murine blood (37 °C, 6 hours), whereas I53-50-v2 only protects 1.0% and 1.2%, respectively (Fig. 4a-b). Evolving the exterior surface of the capsid in circulation in live mice produced I53-50-v4, with a >54-fold increase in circulation half-life from less than 5 minutes for I53-50-v3 to 4.5 hours for I53-50-v4 (Fig. 4c). To further characterize the difference in behavior between these two nucleocapsids, we determined the relative biodistribution of intact nucleocapsids by RT-qPCR of full-length genomes at both 5 minutes and 4 hours. As expected, no obvious tissue tropism was observed for either nucleocapsid. Furthermore, there is no substantial intact I53-50-v3 remaining in any organs by 4 hours post-injection, consistent with the rapid elimination of I53-50-v3 compared to I53-50-v4 (Fig 4g-h).
This work demonstrates that by acquiring positive charge on its interior, an otherwise inert self-assembling protein nanomaterial can package its own RNA genome and evolve under selective pressure. Starting from this “blank slate”, evolution uncovered multiple simple mechanisms to improve complex properties such as genome packaging, nuclease resistance, and in vivo circulation time. This suggests paths by which viruses could have arisen from protein assemblies that adopted simple mechanisms to package their own genetic information. Modern viruses are much more complex, having evolved under selective pressure to minimize genome size and to optimize multiple capsid functions required for a complete viral life cycle. However, this makes it difficult to change one property (e.g., alter tropism or remove epitopes for pre-existing antibodies19, 20) without compromising other functions. By contrast, the simplicity of our synthetic nucleocapsids should allow them to be further engineered more freely. Combining the evolvability of viruses with the accuracy and control of computational protein design, synthetic nucleocapsids can be custom-designed and then evolved to optimize function in complex biochemical environments.
Methods
Solutions and buffers
Lysogeny Broth (LB)
Autoclave 10 g tryptone, 5 g yeast extract, 5 g NaCl, 1 L dH2O.
LB agar plates
Autoclave LB with 15 g/L bacto agar.
Terrific Broth (TB)
Autoclave 12 g tryptone, 24 g yeast extract, 4 mL glycerol, 950 mL dH2O separately from KPO4 salts (23.14 g KH2PO4, 125.31 g K2HPO4, 1 L dH2O); Mix 950 mL broth with 50 mL KPO4 salts at room temperature.
Antibiotics
Kanamycin (50 μg/mL final).
Inducers
β-d-1-thiogalactopyranoside (IPTG, 500 μM final).
Tris-buffered saline with imidazole (TBSI)
250 mM NaCl, 20 mM imidazole, 25 mM Tris-HCl, pH 8.0.
Lysis buffer
TBSI supplemented with 1 mg/mL lysozyme (sigma, L6876, from chicken egg), 1 mg/mL DNase I (sigma, DN25, from bovine pancreas), and 1 mM phenyl methane sulfonyl fluoride (PMSF).
Elution buffer
250 mM NaCl, 500 mM imidazole, 25 mM Tris-HCl, pH 8.0.
Phosphate-buffered saline (PBS)
150 mM NaCl, 20 mM NaPO4.
20x lithium borate buffer (use at 1x)
1 L dH2O, 8.3 g lithium hydroxide monohydrate, 36 g boric acid.
Tris-glycine buffer
25 mM Tris-HCl, 192 mM glycine, 0.1% SDS, pH 8.3.
DNA cloning by PCR mutagenesis and isothermal assembly
Synthetic genes encoding I53-50 and I53-475 were amplified using Kapa High Fidelity Polymerase according to manufacturer’s protocols with primers incorporating the desired mutations or the Btat peptide. The resulting amplicons were isothermally assembled21 with PCR-amplified or restriction digested (NdeI and XhoI) pET29b fragments and transformed into chemically competent E. coli XL1-Blue cells. Monoclonal colonies were verified by Sanger sequencing. Plasmid DNA was purified using a Qiagen miniprep kit and transformed into chemically competent E. coli BL21(DE3)* cells for protein expression.
Kunkel mutagenesis
Kunkel mutagenesis was performed as previously described22. Briefly, E. coli CJ236 was transformed with the desired pET vector and then infected with bacteriophage M13K07. Single-stranded DNA (ssDNA) was purified from PEG/NaCl-precipitated bacteriophage using a Qiaprep M13 kit. Oligonucleotides were phosphorylated for 1 hour with T4 polynucleotide kinase (NEB, M0201) and annealed to purified ssDNA plasmids. For routine cloning, annealing was performed using a temperature ramp from 95 °C to 25 °C over 30 minutes. For library generation, annealing mixtures were denatured at 95 °C for 2 minutes, followed by annealing for 5 minutes at either 55 °C (220bp agilent oligonucleotides) or 50 °C (all other oligonucleotides). Oligonucleotides were extended using T7 DNA polymerase (NEB) for one hour at 20 °C and transformed into E. coli as described for either routine cloning or library generation.
Transformation of DNA libraries
Plasmid DNA libraries generated as described above by isothermal assembly or kunkel mutagenesis were purified by SPRI purification23 and electrotransformed into E. coli DH10B (Invitrogen 18290-015) to produce libraries with at least 10x coverage. Transformed libraries were grown as lawns on LB agar plates containing 50 μg/mL kanamycin. Additionally, a 10-fold dilution series of the transformed library was spotted onto an additional plate to assess library size. After 12-18 hours of growth, the resulting lawn of cells was scraped from the plate into 1 mL of LB and pelleted at 16,000 rcf for 30 seconds. Plasmid DNA was purified directly from this cell pellet using a Qiagen miniprep kit and electrotransformed into E. coli BL21(DE3)* with a minimum of 10x coverage of the library. The resulting bacterial lawns were then lifted from plates in 1mL TB and inoculated directly into expression cultures.
Deep mutational scanning library design, amplification, and purification
For the deep mutational scanning library, the DNA sequence encoding the two components of I53-50-v2 was divided into 7 windows of 159 bp. For each window, a pool of oligonucleotides was synthesized to mutate every residue of I53-50-v2 in the specified window (Agilent SurePrint Oligonucleotide Library Synthesis, OLS). Each oligonucleotide encoded a single amino acid change using the most common codon in E. coli for that amino acid. To disambiguate bona fide mutations from sequencing and reverse transcription errors, mutagenic oligos included silent mutations on either side of the mutagenized position. Each of the 7 oligonucleotide pools was amplified from the OLS pool using primers annealing to constant regions flanking the mutagenic sequences. Reaction progress was monitored by SYBR green fluorescence on a Bio-Rad CFX96 to prevent over-amplification. The resulting amplicons were then PAGE purified and subjected to an additional round of amplification and SPRI purification. A final PCR reaction was set up with only the reverse primer to perform linear amplification of the desired primer sequence (50 cycles of temperature cycling were performed to generate a DNA sample highly enriched for the reverse strand). This sample was then purified using a Qiagen QIAquick PCR Purification Kit. The resulting pool of single stranded oligonucleotides was then used in a kunkel reaction as described above for library generation.
Hydrophilic polypeptide library design, amplification, and purification
The hydrophilic polypeptide library was generated by alternating sets of hydrophilic amino acids (DE, ST, QN, GE, EK, ES, EQ, EP, PAS) with a guest residue (A, S, T, E, D, Q, N, K, R, P, G, L, I) introduced between every 1, 2, or 5 occurrences to generate a final peptide of 59 amino acids in length. An additional 21 peptides were generated by splitting known hydrophilic peptides24, 25 into 59 amino acid chunks or repeating one of their primary repeating units. All polypeptide sequences were reverse translated to DNA using codon frequencies found in E. coli K1226, and flanking sequences were added for amplification. These oligo sequences were synthesized using Agilent OLS technology. After amplification, flanking regions were removed using the AgeI and HindIII restriction enzymes, and cloned onto the C-terminus of the I53-50-v3 pentamer subunit by ligation (T4 ligase, NEB M0202, Final Concentration: 40 units/μL, 1X T4 ligase buffer with 1mM ATP). The resulting DNA was SPRI purified and transformed as described above.
Protein expression and purification
E. coli BL21(DE3)* expression cultures were grown to an optical density of 0.6 in 500 mL TB supplemented with 50 μg/mL kanamycin at 37 °C with shaking at 225 rpm. Expression was induced by the addition of IPTG (500 μM final). Expression proceeded for 4 hours at 37 °C with shaking at 225 rpm. Cultures were harvested by centrifugation at 5,000 rcf for 10 minutes and stored at −80 °C.
Cell pellets were resuspended in TBSI and lysed by sonication or homogenization using a Fastprep96 with lysing matrix B. Lysate was clarified by centrifugation at 24,000 rcf for 30 minutes and passed through 2 mL of Nickel-Nitrilotriacetic acid agarose (Ni-NTA) (Qiagen cat No. 30250), washed 3 times with 10 mL TBSI, and eluted in 3 mL of Elution buffer, of which only the second and third mL were kept. EDTA was immediately added to 5mM final concentration to prevent Ni-mediated aggregation.
For in vitro evolution (Fig. 1–3, Extended Data Fig. 1, Extended Data Fig. 2, Extended Data Fig. 3d, Extended Data Fig. 4c, and fig. S2-S8) and all experiments involving hydrophilic tails, synthetic nucleocapsids were prepared with a C-terminal histidine tag on the pentameric subunit. For these constructs, purification proceeded immediately from IMAC elution to size exclusion chromatography (SEC) using a Superose 6 Increase column (GE healthcare, 29-0915-96) in TBSI.
For all in vivo evolution experiments (Fig. 4, Extended Data Fig. 3a,b,c,e, Extended Data Fig. 4a,d, fig. S8-S9), synthetic nucleocapsids were prepared with a N-terminal, thrombin cleavable histidine tag on the pentameric subunit to allow scarless removal. This was done to allow removal of the affinity tag for in vivo use and to prevent the divalent cation-dependent aggregation observed in the C-terminal histidine-tagged constructs. After elution from the IMAC column, these samples were dialyzed into PBS, treated with thrombin at a final concentration of 0.00264 units/μL for 90 minutes at 20 °C to remove the histidine tag. Thrombin was inactivated by addition of PMSF (1mM final concentration), and nucleocapsids were purified by SEC using a Superose 6 Increase column in PBS.
Endotoxin was removed from all samples intended for animal studies. Endotoxin removal was performed after thrombin cleavage by addition of triton x-114 (1% final concentration volume/volume) followed by incubation at 4 °C for 5 minutes, incubation at 37 °C for 5 minutes, and centrifugation at 24,000 rcf at 37 °C for 2 minutes. The supernatant was then removed, incubated 4 °C for 5 minutes, incubated at 37 °C for 5 minutes, and centrifuged at 24,000 rcf at 37 °C for 2 minutes to ensure optimal endotoxin removal before continuing with SEC purification in PBS.
Gel electrophoresis
Native agrose gels: Agarose gels were prepared using 1% ultrapure agarose (Invitrogen) in lithium borate buffer. For synthetic nucleocapsid samples, 20 μL purified synthetic nucleocapsids were treated with 10 μg/mL RNase A (20 °C for 10 minutes), mixed with 4 μL 6x loading dye (NEB B7025S, no SDS), and electrophoresed at 100 volts for 45 minutes. Gels were then stained with SYBR gold (Thermo-fischer S11494) for RNA followed by Gelcode (Thermo-fischer 24590) for protein.
DNA gels: 1% agarose gels were prepared containing SYBR Safe (Invitrogen) according to the manufacturer’s protocols.
Protein SDS-PAGE: SDS-PAGE was performed using 4-20% polyacrylamide gels (Bio-Rad) in tris-glycine buffer.
RNA purification and reverse transcription
RNA was purified using TRIzol (Thermofisher Scientific, 15596018) and the Qiagen RNeasy kit (Qiagen, 74106) according to the manufacturers’ instructions. Briefly, 100 μL synthetic nucleocapsid samples were mixed vigorously with 500 μL TRIzol. 100μL chloroform was added and mixed vigorously, and then the solution was centrifuged for 10 min at 24,000 rcf. 150 μL of the aqueous phase was mixed with 150 μL of 100% ethanol, transferred to a RNeasy spin column for purification according to manufacturer’s instructions, and eluted in 50 μL nuclease-free dH2O. For samples intended for absolute quantification (including standards) yeast tRNA was added to 100 ng/μL final concentration to ensure consistent sample complexity.
Reverse transcription was carried out using Thermoscript reverse transcriptase according to the manufacturer’s instructions for one hour at 53 °C, with the only modifications being that a gene-specific primer (skpp_reverse) was used. Thus, a 10 μL reaction contained: 1 μL dNTPs (10 mM each), 1 μL DTT (100 μM), 1 μL Thermoscript reverse transcriptase, 2 μL cDNA synthesis buffer, 1 μL RNase-Out, 1 μL skpp_reverse (10 μM), 2 μL purified RNA template, and 1 μL nuclease-free dH2O. Controls lacking reverse transcriptase were set up identically except with the substitution of nuclease-free dH2O in place of Thermoscript reverse transcriptase.
Quantitative PCR
Quantitative PCR was performed in a 10 μL reaction using a Kapa High Fidelity PCR kit (Kapa Biosystems, KK2502) according to the manufacturer’s instructions with the addition of SYBR green at 1x concentration and 0.5 μM forward and reverse primers (skpp_fwd and skpp_Offset_Rev) for quantification of nucleocapsid RNA. Thermocycling and Cq calculations were performed on a Bio-Rad CFX96 with the following protocol: 5 min at 95 °C, then 40 cycles of: 98 °C for 20 seconds, 64 °C for 15 seconds, 72 °C for 90 seconds.
Allele specific qPCR was performed using Kapa 2G Fast polymerase readymix along with 1x SYBR green, 3 μL of 100x diluted cDNA template, and 0.5 μM each of the forward and reverse allele specific primer specific for each construct. Thermocycling and Cq calculations were performed on a Bio-Rad CFX96 with the following protocol: 5 min at 95 °C, then 40 cycles of: 95 °C for 15 seconds, 58 °C for 15 seconds, 72 °C for 90 seconds.
Absolute quantitation of full length RNA per protein capsid was calculated from Cq values using a linear fit (-log([RNA]) = m*(Cq) + b) of a standard curve comprised of in vitro transcribed nucleocapsid RNA. In vitro transcription was performed using a NEB HiScribe T7 high yield RNA synthesis kit (NEB, E2040S) according to the manufacturer’s protocols. Excess DNA was degraded using RNase-free DNAse I (NEB, M0303), and RNA was purified using Agencourt RNAClean XP (Beckman Coulter, A63987) according to manufacturer protocols. The concentration of this standard was measured using a Qubit RNA HS Assay Kit (Life Technologies, Q32852), and a 10-fold dilution series was prepared in nuclease-free dH2O supplemented with 100 ng/μL yeast tRNA. The dilution series samples were then processed in parallel with the synthetic nucleocapsid samples using the RNA purification and reverse transcription protocol above, and run on the same qPCR plate as the samples quantified.
In the pooled samples used to compare the fitness of I53-50-v1, I35-50-v2, I53-50-v3, and I53-50-v4, the total amount of full-length nucleocapsid genome was quantified by qPCR performed with skpp_fwd and skpp_rev using the Kapa High Fideltiy PCR kit as described above. Subsequently, the relative fraction of RNA corresponding to each version was determined by allele specific qPCR as described above using allele-specific primers (Table S6) unique to each version. Absolute quantitation was with respect to a standard curve for each version prepared as described above. The fractional RNA content from each version was then multiplied by total amount of full-length genomes.
In vitro synthetic nucleocapsid selection conditions
The total amount of RNA packaged in nucleocapsids was evaluated by treating 100 μL synthetic nucleocapsids with 10 μg/mL RNase A at 20 °C for 10 minutes (“Total RNA”) so as to degrade non-encapsulated RNA. Reaction buffer was PBS for N-terminal histidine-tagged constructs or TBSI for C-terminal histidine-tagged constructs. More stringent RNase protection assays were performed with 10 μg/mL RNase A at 37 °C for the specified duration (“RNase”). Protection from blood was assessed by diluting synthetic nucleocapsids 1:10 in heparinized whole murine blood (collected from the vena cava of mice sacrificed using a lethal dose of avertin and stabilized in 6 units/mL heparin) and incubating at 37 °C for the specified duration (“Blood”). Samples were then centrifuged at 24,000 rcf for 2 minutes before adding the supernatant to TRIzol. RNA was purified as described in the RNA Purification and RT-qPCR sections. All reactions were quenched by adding the sample directly to 500μL TRIzol.
General information about mouse work
6 – 8 week old Balbc mice were selected randomly and retro-orbitally injected with 150 μL of synthetic nucleocapsids. All mice were female to minimize any unknown variability in tissue distribution bias attributed to animal sex. No blinding was performed. The Institutional Animal Care and Use Committee (IACUC) at the University of Washington authorized all animal work in accordance with ethical animal use and regulations.
In vivo synthetic nucleocapsid selection conditions
Synthetic nucleocapsid libraries containing either hydrophilic polypeptides (104 μg/mL) or exterior surface mutations (570 μg/mL) were created and selected for circulation time in live mice. Five mice per library underwent retro-orbital injections and tail lancet blood draws at 5, 10, 15, and 30 minutes, with a final sacrifice and blood draw at 60 minutes. Following Illumina MiSeq sequencing of the selected nucleocapsid libraries, the circulation times of several selected variants (10 hydrophilic polypeptide variants, 4 surface mutation variants, I53-50-v1, I53-50-v2, and I53-50-v3 were pooled to 570μg/mL total protein) were compared in 5 mice with tail lancet blood draws at 5, 15, 30, 60, and 120 minutes, submental collection10 at 4 hours, and final sacrifice and blood draw at 6 hours. I53-50-v4 was created based on the consensus sequence of the most common residues in the library after in vivo selection.
Synthetic Nucleocapsid characterization for Fig. 4a-d
I53-50-v1, I53-50-v2, I53-50-v3, and I53-50-v4 were expressed in E. coli BL21(DE3)*, harvested, purified by IMAC, dialyzed into PBS, cleaved by thrombin, subjected to endotoxin removal, and purified by SEC as described above. The protein concentrations for each sample were determined using a Qubit Protein Assay Kit (Thermofisher Scientific, Q33211) and samples were mixed to give a final concentration of 170 μg/mL nucleocapsid protein for each version (680 μg/mL total). This pool was split into four different samples that were each subjected to the Total RNA, RNase, Blood, and in vivo selection conditions described above (n = 3 independent replicates for each in vitro selection condition). For in vivo selections, 150 μL of the pool was injected retro-orbitally, and tail lancet draws were performed at 5 minutes, 1 hour, 3 hours, and 6 hours, submental collection10 at 10 hours, and final sacrifice and blood draw at 24 hours.
Synthetic Nucleocapsid biodistribution
I53-50-v3 and I53-50-v4 were injected into 6 mice each. Animals were then sacrificed after either 5 minutes or 4 hours (3 animals per nucleocapsid version at each time point). Half of each bisected organ and 20 μL of whole blood were collected into tubes containing 500 μL TRIzol and homogenized. RNA was purified, total tissue RNA was measured by either A260 (organs) or Qubit RNA HS Assay Kit (Blood, due to its lower total RNA), and full-length nucleocapsid genomes were quantitated by RT-qPCR as described above.
Negative-stain electron microscopy specimen preparation, data collection, and data processing
6 μl of purified protein (I53-50-v0, I53-50-v1, I53-50-v2, I53-50-v3, I53-50-v4, I53-50-Btat, I53-47-v0, I53-47-v1, I53-47-Btat) at 0.04 – 0.3 mg/mL were applied to glow discharged, carbon-coated 300-mesh copper grids (Ted Pella), washed with Milli-Q water and stained with 0.75% uranyl formate as described previously27. Screening and sample optimization was performed on a 100 kV Morgagni M268 transmission electron microscope (FEI) equipped with an Orius charge-coupled device (CCD) camera (Gatan). Data were collected with Leginon automatic data-collection software28 on a 120 kV Tecnai G2 Spirit transmission electron microscope (FEI) using a defocus of 1 μm with a total exposure of 30 e-/A2. All final images were recorded using an Ultrascan 4000 4k × 4k CCD camera (Gatan) at 52,000× magnification at the specimen level. For data collection used in two-dimensional class averaging, the dose of the electron beam was 80 e-/Å2, and micrographs were collected with a defocus range between 1.0 and 2.0 μm. Coordinates for unique particles (7,979 for I53-50-v0 and 7,130 for I53-50-v4) were obtained for averaging using EMAN229. Boxed particles were used to obtain two-dimensional class averages by refinement in EMAN2.
Illumina sequencing sample preparation evolution experiments
Evolution experiments were analyzed by performing targeted RNAseq on full-length nucleocapsid genomes surviving the specified selection condition (RT-qPCR using skpp_reverse as the RT primer and qPCR with skpp_fwd and skpp_Offset_Rev). The starting populations and selected populations were evaluated by sequencing nucleocapsid genomes extracted from producer cells or nucleocapsids, respectively. Following SPRI purification, two sequential Kapa HiFi qPCR reactions were performed using Kapa HiFi polymerase to add sequencing adapters and barcodes, respectively. qPCR reactions were monitored by SYBR green fluorescence and terminated prior to completion so as to prevent over-amplification. The resulting amplicons were purified using SPRI purification or a Qiagen QIAquick Gel Extraction Kit. The resulting amplicons were then denatured and loaded into a Miseq 600 cycle v3 (Illumina) kit and sequenced on an Illumina MiSeq according to the manufacturer’s instructions.
Illumina sequencing sample preparation for comprehensive RNAseq
The composition of encapsulated RNA was evaluated by performing comprehensive RNAseq on total RNA from producer cells (representing expression levels) and nucleocapsids (representing encapsulated RNA). RNA was extracted using TRIzol and purified using a Direct-zol™ RNA MiniPrep Plus kit (Zymo Research, R2072) with on-column DNAse digestion. The purified RNA was quantitated using a Qubit RNA HS Assay Kit, and 100 ng of RNA was used to prepare each RNAseq library with a NEBNext® Ultra™ RNA Library Prep Kit for Illumina® kit (NEB, E7530S). Each library was PCR amplified using Kapa HiFi polymerase to add sequencing barcodes before being pooled for sequencing. The resulting libraries were then denatured and loaded into an Illumina NextSeq 500/550 High Output Kit v2 (75 cycles) and sequenced on an Illumina NextSeq according to the manufacturer’s instructions.
Sequencing analysis for evolution experiments
Raw sequencing reads were converted to fastq format and parsed into separate files for each sequencing barcode using the Generate Fastq workflow on the Illumina MiSeq. Forward and reverse reads were combined using the read_fuser script from the enrich package30.
For all libraries, enrichment values were calculated as the change in fraction of the library corresponding to each linked sequence (rank order of variants) or unlinked substitutions (heatmaps) that were observed at least 10 times in the naïve library. The base 10 logarithm of each value was then taken in order to give enrichment values that more symmetrically span enrichment and depletion.
For the charge optimization library, the total interior charge of each variant was calculated by summing the number of Lys and Arg residues, and subtracting the number of Asp and Glu residues in the regions of the sequence determined to be on the interior surface by visual inspection of the design model. For the deep mutational scanning library, substitutions were only counted if they contained the expected silent mutation barcodes as described in oligonucleotide design. This greatly reduces the effect of both RT-PCR errors and sequencing errors because instead of a minimum of one error allowing a miscalled amino acid mutation, a minimum of three errors are required for a mutation to be miscalled.
Heatmaps were generated using a custom MatPlotLib31 script by mapping the calculated log enrichment values onto a LinearSegmentedColormap (purple, white, orange; rgb = (0.75,0,0.75), (1,1,1), (1.0,0.5, 0)) using the pcolormesh function. The minimum and maximum values of the colormesh were set as shown in each figure to fully utilize the dynamic range of the colormap. A pymol session colored by the average log enrichment of all 20 amino acids at each position was created by substituting average log enrichment values for B-factors in the pdb file and running the command: spectrum b, purple_white_white_orange, minimum = −1.5, maximum = 0.6. Note that this is rescaled relative to the coloring of individual residues because the averages span a smaller range than the individual values and thus a different color range is needed to clearly differentiate values.
Sequencing analysis for comprehensive RNAseq
RNAseq data was converted from bcl format to fastQ format using Illumina’s bcl2fastq script. HISAT232 converted fastQ to sam, and SAMtools33 converted sam files to sorted bam files. StringTie34 was used to calculate gene expression as TPM (Transcripts Per kilobase Million).
Dynamic Light Scattering
Dynamic Light Scattering was performed on a DynaPro NanoStar (Wyatt) DLS setup. I53-50-v0, I53-50-v1, and I53-50-v4 were evaluated with 0.2 mg/mL of nucleocapsid protein in PBS at 25 °C. Data analysis was performed using DYNAMICS v7 (Wyatt) with regularization fits.
Code availability
Custom scripts for Illumina sequencing analysis are available on github (https://github.com/mlajoie/Synthetic_Nucleocapsid).
Data availability
Nucleocapsid genome files (genbank format) and design models (pdb format) are available on github (https://github.com/mlajoie/Synthetic_Nucleocapsid). All raw sequencing data from Fig. 2–4, Extended Data Fig. 2–4, and fig. S3, S7-S9 are available at the NCBI Sequence Read Archive under BioProject accession PRJNA417493. Source data for Fig. 1d-f, Fig. 4a-d, Extended Data Fig. 1b-d, Extended Data Fig. 3d-e, Extended Data Fig. 4c-d, and fig. S8 are provided with the paper. All other raw data not included in the manuscript are available from the corresponding author upon request.
Extended Data
Extended Data Figure 1. I53-47 nucleocapsids and Size Exclusion Chromatography.
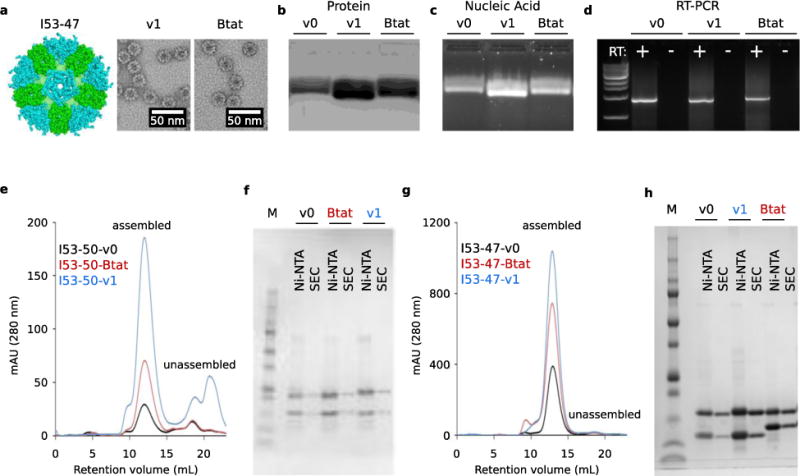
a. Design model of I53-47 and negative-stain electron micrographs of I53-47-v1 (designed positively charged interior) and I53-47-Btat (BIV Tat RNA-binding peptide translationally fused to the C-terminus of the capsid trimeric subunit). Micrographs shown are representative of the entire sample tested on between one and three different grids, each at different concentrations. b. Synthetic nucleocapsids were Ni-NTA-purified, RNase-treated, and electrophoresed on non-denaturing 1% agarose gels. The gels were stained with Coomassie (protein; b) and SYBR gold (nucleic acid, c). Nucleic acids co-migrated with capsid proteins for all three versions of I53-47, suggesting that all versions package nucleic acid. d. Full-length synthetic nucleocapsid genomes were recovered from each sample by RT-PCR. White + and – headings indicate PCR performed on template prepared with and without reverse transcriptase, respectively, confirming that all versions package their own full-length RNA genomes. This procedure is part of our standard quality control for synthetic nucleocapsids and has been performed reproducibly more than 10 times, including once on the I53-47 nucleocapsid shown here. e-h. Size Exclusion Chromatography of nucleocapsids. RNA-packaging capsids show identical size exclusion chromatography (SEC) retention volume as the original published capsid5. Three versions of I53-50 and I53-47 were analyzed: v0 is the original published design, v1 has the designed positively charged interior, and Btat has the BIV Tat RNA-binding peptide translationally fused to the C-terminus of the capsid trimer subunit. e. SEC traces of I53-50 capsids were performed on a GE superose 6 increase column. f. SDS-PAGE of samples before and after SEC purification shows both subunits in the expected 1:1 stoichiometry. g, h. SEC traces and SDS-PAGE for I53-47 capsids. This procedure is part of our standard quality control for synthetic nucleocapsids and has been performed reproducibly more than 10 times.
Extended Data Figure 2. Top synthetic nucleocapsid candidates for I53-50-v2 and I53-50-v3.
a. Top candidate testing to choose I53-50-v2 with improved genome packaging. New variants were created rationally based on the best sequences from the evolved interior charge optimization (Fig. 2) and interface (fig. S2) libraries. The amount of packaged full-length mRNA was compared for each of these nucleocapsids. Each nucleocapsid was expressed, purified by IMAC, and treated with 10 μg/mL RNAse A at 20 °C for 10 minutes in triplicate. RT-qPCR was used to determine the relative amount of full length mRNA packaged in each variant. Cq values are reported relative to those of I53-50-v1 (CqI53-50-v1 – Cqvariant). The charge-optimized variant with E24F was chosen as I53-50-v2 based on this data. In the absence of a discernable difference in packaging between E24M and E24F, E24F was selected due to the apparent preference for hydrophobic residues at that position (fig. S2). Data points represent the values of three independent biological replicates, and error bars represent standard error of the mean. b-c. Top candidate testing to choose I53-50-v3 with improved nuclease resistance. b. Heatmap of log enrichments for each mutation explored in the combinatorial library to remove positively charged residues near the nucleocapsid pore. A single round of selection (10 μg/mL RNAse A, 37 °C, 1 hour) was performed. Purple and orange indicate mutations that were depleted or enriched in the selected population, respectively. Blue squares and black dots indicate the I53-50-v2 starting sequence and I53-50-v3 selected sequence, respectively. c. Enriched variants selected from the combinatorial library were expressed, purified by IMAC and SEC, and treated with 10 μg/mL RNAse A at 37 °C for 1 hour in duplicate. RT-qPCR was used to determine the relative amount of full length mRNA packaged in each variant. Cq values are reported relative to those of I53-50-v2 (CqI53-50-v2 – Cqvariant). Data points represent the values of two independent biological replicates, and bars represent the mean of these values. The variant labeled Pore_Mut_4 was chosen as I53-50-v3 based on this data.
Extended Data Figure 3. Evolution and performance of nucleocapsids modified with hydrophilic polypeptides in vitro or in vivo.
a. The change in population fraction corresponding to each variant was calculated from Illumina MiSeq counts for the input pool (t = 0), RNA recovered from circulation after 30 minutes (n = 3 biologically independent mice), and RNA recovered from circulation after 60 minutes (n = 2 biologically independent mice). b. Scatter plot of log10 enrichment of each hydrophilic polypeptide versus its net charge as calculated from the total number of charged residues in its sequence. c. Scatter plot of log10 enrichment of each polypeptide versus the number of unique amino acids in its sequence. d. Each of 11 variants were individually expressed and purified by IMAC before being pooled (equal protein concentration) and purified en masse by SEC. The resulting nucleocapsid pool was then incubated in heparinized whole blood at 37 °C (n = 3 independent reactions per time point). RNA was recovered at the indicated time points, and the fraction of each variant was determined by Illumina MiSeq counts taken at each time point. e. The same nucleocapsid pool used in (d) was injected retro-orbitally into mice (n = 5 biologically independent mice). RNA content was then assessed as in (d) using RNA isolated from tail vein draws at the indicated time points. All variants exhibit high stability in blood; however, the unmodified I53-50-v3 nucleocapsid (no polypeptide, blue) and a negative control polypeptide (ESESG, red) are cleared rapidly from circulation in vivo. Error bars represent standard error of the mean.
Extended Data Figure 4. Evolution and performance of nucleocapsids with exterior surface mutations in vitro or in vivo.
a. Heatmap of log enrichments between the injected pool and RNA recovered from the tail vein 60 minutes later. Purple and orange indicate mutations that were depleted or enriched in the selected population, respectively. Blue squares and black dots indicate the I53-50-v3 starting sequence and I53-50-v4 selected sequence, respectively. Residues not in the designed combinatorial library are colored gray. Note the strong enrichment of the E67K mutation and corresponding depletion of the native E67 allele. b. Design model of I53-50-v4. Coloring is as described in Fig. 1a. c. Four variants were tested: a consensus sequence based on the most common residue at each position after selection in murine circulation (Consensus, I53-50-v4), the full length sequence with the greatest fold increase in population fraction (Most_enriched), the sequence with the most total counts (Top_count), and I53-50-v3 with only the E67K mutation (v3_E67K). Previous versions (I53-50-v1 through I53-50-v3) were also included as benchmarks. Each variant was individually expressed and purified by IMAC before being pooled (equal protein concentration) and purified en masse by SEC. The resulting nucleocapsid pool was then incubated in whole blood (n = 3 independent reactions). RNA was recovered at the indicated time points, and the fraction of each variant was determined by Illumina MiSeq counts taken at each time point. d. The same nucleocapsid pool used in (c) was injected retro-orbitally into mice (n = 5 biologically independent mice). I53-50-v3 was evaluated with (v3) and without (v3H) the H6Q and H9Q mutations, and both variants were found to have similar behavior. Error bars represent standard error of the mean.
Extended Data Figure 5. Dynamic Light Scattering of nucleocapsids.
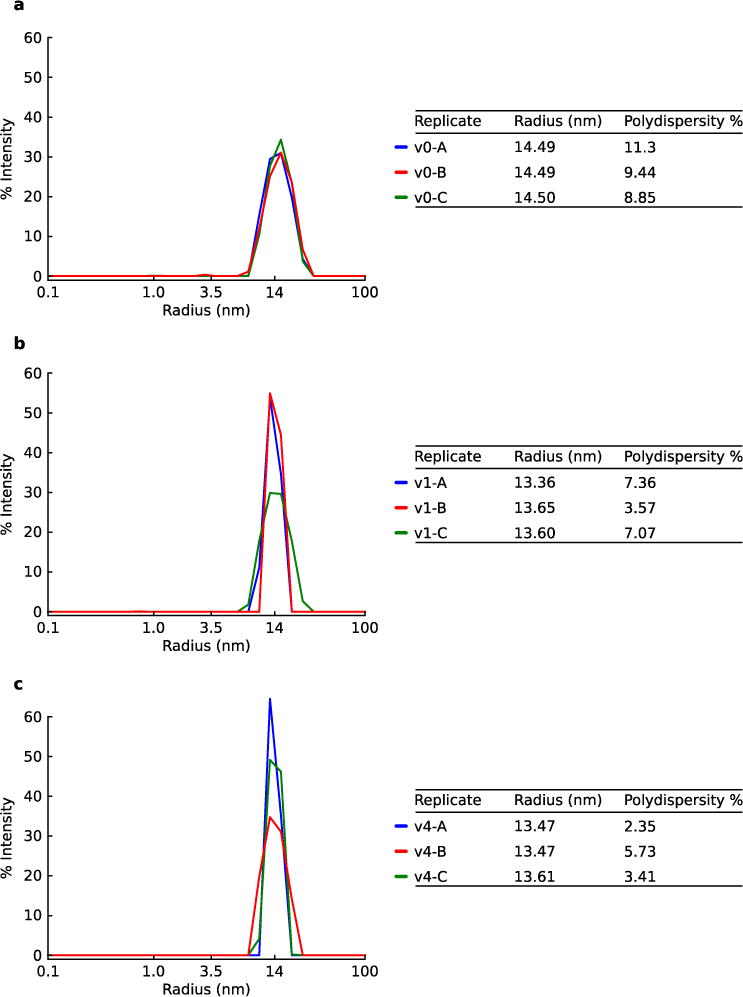
DLS was performed on synthetic nucleocapsids and fitted with regularization analysis, confirming uniform populations of nucleocapsids around the expected size. a. I53-50-v0 has a C-terminal histidine tag. b. I53-50-v1 has an N-terminal histidine tag that was cleaved prior to DLS. c. I53-50-v4 has an N-terminal histidine tag that was cleaved prior to DLS. The experiment was independently repeated three times (data for independent replicates are shown in the figure).
Extended Data Figure 6. Negative-stain transmission electron microscopy class averages.
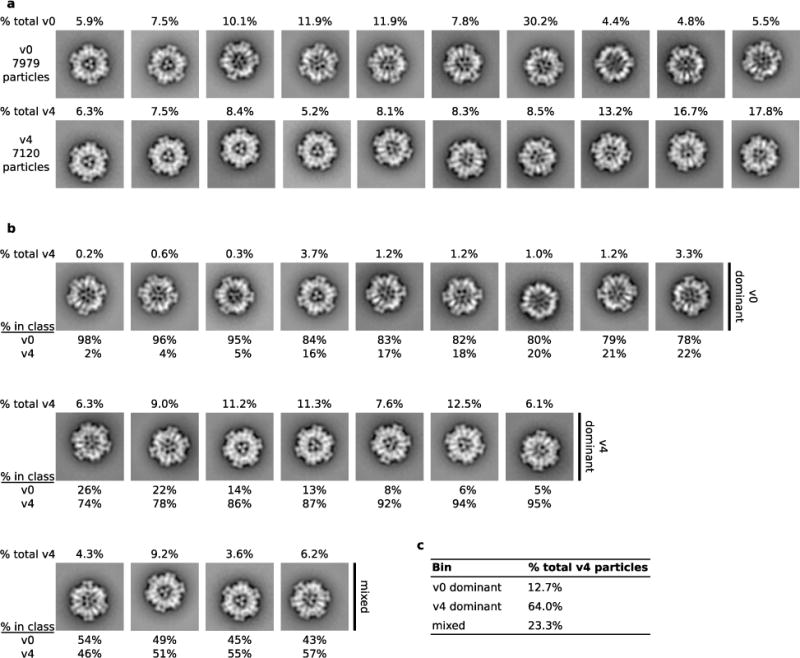
a. Two-dimensional class averages of I53-50-v0 (7979 particles) and I53-50-v4 (7120 particles) datasets showing the percentage of the total particles present in each class. I53-50-v4 nucleocapsids are on average denser than unfilled I53-50-v0 assemblies, especially near the inner surface of the capsid. b. All I53-50-v0 and I53-50-v4 particles from (a) were combined into a single set (15,119 particles), and twenty class averages were made from the combined data. Class averages were grouped into three bins (v0 dominant has ≤ 25% I53-50-v4, v4 dominant has ≥ 74% I53-50-v4, and mixed has the rest) and arranged from left to right with increasing fraction of I53-50-v4 particles (shown below each class). The v0 dominant classes appear more similar to the I53-50-v0 class averages in (a), while the v4 dominant classes appear more similar to the I53-50-v4 class averages. The percentage of the complete I53-50-v4 dataset found in each class is shown above each class average. c. Table presenting the bins into which I53-50-v4 particles were assigned. We found that 64% of I53-50-v4 particles were present in the v4 dominant classes, which also appear to be more filled than the v0-dominant classes. Although TEM cannot determine the nature of the contents, encapsulated RNA is plausible.
Extended Data Figure 7. Summary of encapsulated RNA composition analysis.
a. Flow chart explaining the relationship between bulk RNA measurements and RT-qPCR quantitation. Bulk RNA measurements also account for cellular RNA and nucleocapsid genome fragments, whereas RT-qPCR only quantitates full-length genomes. Nucleocapsid genome : capsid ratios based on these measurements are reported in parentheses. b. Stacked bar blot describing the fractions of total encapsulated RNA that are full-length or fragmented nucleocapsid genome.
Extended Data Figure 8. Packaging correlates strongly with expression level in producer cells.
a. Log enrichment (fraction packaged in nucleocapsid divided by fraction produced in cells) for I53-50-v4 versus I53-50-v1. Each point represents a unique RNA (red squares are protein coding mRNAs, green triangles are non-coding RNAs such as ribosomal RNA, and the blue circle is the nucleocapsid genomic RNA). No increase in specificity was observed over the course of evolution from the rationally designed I53-50-v1 to the in vivo circulating I53-50-v4. This is not surprising because no attempt was made to evolve increased specificity. The diagonal line is y = x. b. Log fraction of total reads in nucleocapsids versus log fraction of total reads in cells shows that packaging correlates strongly with expression level (Pearson values for I53-50-v1 and I53-50-v4 are 0.83 and 0.86, respectively). Each point represents a unique RNA. The diagonal line is y = x. RNAs above the line are enriched in nucleocapsids, and RNAs below the line are depleted in nucleocapsids. Although the nucleocapsid genome is slightly enriched, its high packaging yield appears to arise because T7 RNA Polymerase floods the cell with genomes, thereby increasing the chance that the capsid randomly packages the genome. Conversely, ribosomal RNA may be restricted from nucleocapsids because intact ribosomes are too large to be encapsulated. All data points represent the average of two independent biological replicates.
Extended Data Figure 9. Design models of synthetic nucleocapsid versions 1 through 4.
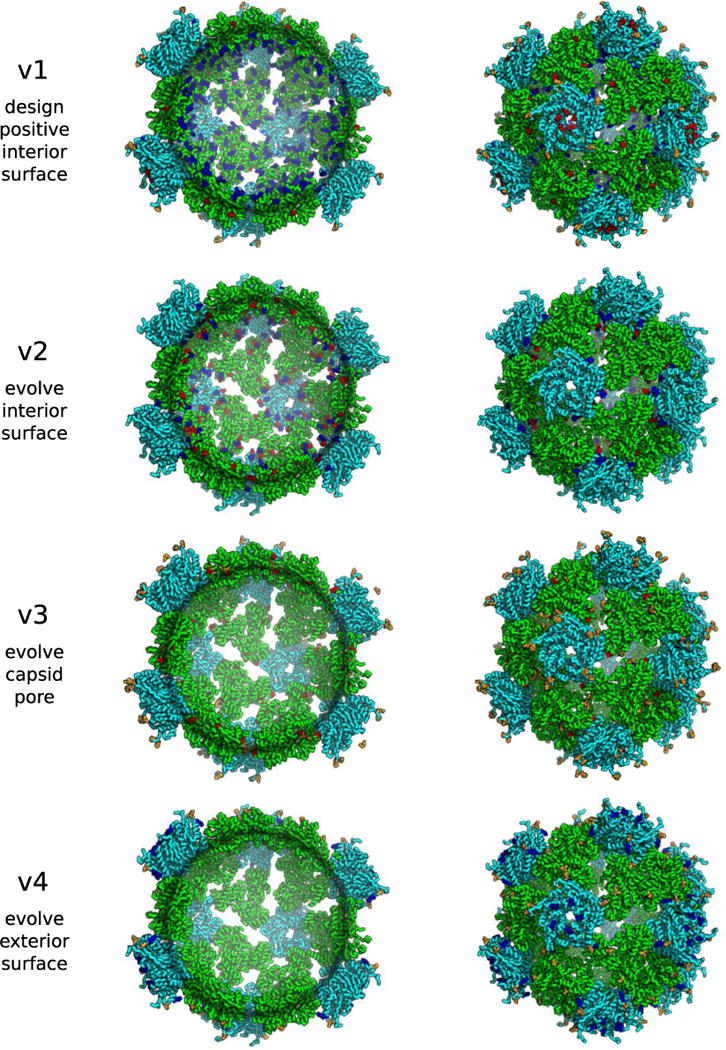
Trimer subunits are colored green and pentamer subunits are colored cyan. Mutations with respect to the previous version are colored blue (increases positive charge and/or decreases negative charge [e.g., E→N, N→K, E→K]), orange (no change in charge [e.g., E→D, N→T, K→R]), or red (decreases positive charge and/or increases negative charge [e.g., N→E, K→N, K→E]).
Extended Data Table 1.
All amino acid substitutions made for each version relative to the previous version
| Version | Changes in trimer with respect to previous version | Changes in pentamer with respect to previous version |
|---|---|---|
| I53-50-V1 | T126D, E166K, S179K, T185K, A195K, E198K | Y9H, A38R, S105D, D122K, D124K |
| I53-50-V2 | K179N, K185N, E188K | E24F, K124N, H126K |
| I53-50-V3 | K9R, K11T, K61D | H6Q, H9Q |
| I53-50-V4 | E74D | D39K, D43E, E67K |
Extended Data Table 2.
Genomes per nucleocapsid by bulk RNA and protein measurements
| Sample | Protein (ug/mL) | Total encapsulated RNA (ng/uL)* | Capsids (M)† | Total RNA (M)‡ | Capsids/Genome equiv.§ | % RNA is NC genome‖ | Capsids/genome |
|---|---|---|---|---|---|---|---|
| I53-50-V0 (rep 1) | 184 | bd | 7.4E-08 | bd | bd | bd | bd |
| I53-50-v0 (rep 2) | 188 | bd | 7.6E-08 | bd | bd | bd | bd |
| I53-50-V1 (rep 1) | 436 | 14.0 | 1.7E-07 | 3.0E-08 | 5.7 | 64% | 8.9 |
| I53-50-V1 (rep 2) | 504 | 12.3 | 2.0E-07 | 2.6E-08 | 7.5 | 64% | 11.7 |
| I53-50-v4 (rep 1) | 217 | 8.0 | 8.5E-08 | 1.7E-08 | 5.0 | 74% | 6.7 |
| I53-50-v4 (rep 2) | 217 | 8.7 | 8.5E-08 | 1.9E-08 | 4.6 | 74% | 6.2 |
bd = below detection
Capsid MW: v0 = 2479.440 kDa, v1 = 2544.300 kDa, v4 = 2539.320 kDa
Total RNA calculated by assigning nucleocapsid genome MW to total RNA: v0 = 443.618 kDa, v1 = 464.212 kDa, v4 = 463.971 kDa
Genome equivalents of total RNA (includes cellular RNA)
Determined by RNAseq
Supplementary Material
Acknowledgments
We thank Raj Chari for RNAseq advice; Stephen Bustin for RT-qPCR advice; Betsy Gray and Nicole Arroyo for heparinized mouse blood; David Veesler, Justin Kollman, and Matt Johnson for EM advice; Yang Hsia for DLS advice; Carl Walkey, Yang Hsia, Gabriel Rocklin, Jorgen Nelson, Sriram Kosuri, George Church, Jesse Bloom, and Andrew Hessel for helpful suggestions. This work was supported by the Howard Hughes Medical Institute (DB), the Bill and Melinda Gates Foundation (DB and NPK, grant no. OPP1118840), the Defense Advanced Research Projects Agency (DB and NPK, grant no. W911NF-15-1-0645), and the NIH (SHP, grant no. NIH1R01CA177272; DLS, grant no. 1R21NS099654-01A1). GLB was supported with a National Science Foundation Graduate Fellowship. MJL is a Washington Research Foundation Innovation Postdoctoral Fellowship and a Cancer Research Institute Irvington Fellow supported by the Cancer Research Institute. HHG was supported by an NIH training grant (NIH5T31HL0071312). UN was supported in part by a PHS National Research Service Award (T32GM007270) from NIGMS.
Footnotes
Competing financial interests:
JBB, NPK, and DB are listed as inventors on patent US9630994B2. GLB, MJL, NPK, and DB have filed a provisional patent application describing synthetic nucleocapsids (62/583,937).
Author contributions statement:
GLB and MJL designed the research and the experimental approach with guidance from NPK and DB; GLB and MJL performed the evolution, nucleocapsid characterization, Illumina sequencing, and data analysis; HHG and DLS designed and performed the in vivo mouse experiments, and samples were processed by GLB and MJL; UN designed, performed, and analyzed electron microscopy experiments; DE and JBB designed the starting protein assemblies that were subsequently used for RNA packaging; SK, GHL, AY, and RR assisted with cloning and protein purification; SHP, NPK, and DB supervised the research; GLB and MJL wrote the manuscript and produced the figures with guidance from HHG, DLS, UN, SHP, NPK, and DB; GLB, MJL, HHG, DLS, UN, JBB, SHP, NPK, and DB revised the manuscript.
Supplementary Information is linked to the online version of the paper at www.nature.com/nature.
References
- 1.Deverman BE, et al. Cre-dependent selection yields AAV variants for widespread gene transfer to the adult brain. Nat Biotechnol. 2016;34:204–209. doi: 10.1038/nbt.3440. [DOI] [PMC free article] [PubMed] [Google Scholar]
- 2.Chackerian B, Caldeira Jdo C, Peabody J, Peabody DS. Peptide epitope identification by affinity selection on bacteriophage MS2 virus-like particles. J Mol Biol. 2011;409:225–237. doi: 10.1016/j.jmb.2011.03.072. [DOI] [PMC free article] [PubMed] [Google Scholar]
- 3.Smith GP. Filamentous fusion phage: novel expression vectors that display cloned antigens on the virion surface. Science. 1985;228:1315–1317. doi: 10.1126/science.4001944. [DOI] [PubMed] [Google Scholar]
- 4.Soderlind E, Simonsson AC, Borrebaeck CA. Phage display technology in antibody engineering: design of phagemid vectors and in vitro maturation systems. Immunol Rev. 1992;130:109–124. doi: 10.1111/j.1600-065x.1992.tb01523.x. [DOI] [PubMed] [Google Scholar]
- 5.Bale JB, et al. Accurate design of megadalton-scale two-component icosahedral protein complexes. Science. 2016;353:389–394. doi: 10.1126/science.aaf8818. [DOI] [PMC free article] [PubMed] [Google Scholar]
- 6.Hsia Y, et al. Design of a hyperstable 60-subunit protein icosahedron. Nature. 2016;535:136–139. doi: 10.1038/nature18010. [DOI] [PMC free article] [PubMed] [Google Scholar]
- 7.Drouin LM, et al. Cryo-electron Microscopy Reconstruction and Stability Studies of the Wild Type and the R432A Variant of Adeno-associated Virus Type 2 Reveal that Capsid Structural Stability Is a Major Factor in Genome Packaging. J Virol. 2016;90:8542–8551. doi: 10.1128/JVI.00575-16. [DOI] [PMC free article] [PubMed] [Google Scholar]
- 8.Sommer JM, et al. Quantification of adeno-associated virus particles and empty capsids by optical density measurement. Mol Ther. 2003;7:122–128. doi: 10.1016/s1525-0016(02)00019-9. [DOI] [PubMed] [Google Scholar]
- 9.Pascual E, et al. Structural basis for the development of avian virus capsids that display influenza virus proteins and induce protective immunity. J Virol. 2015;89:2563–2574. doi: 10.1128/JVI.03025-14. [DOI] [PMC free article] [PubMed] [Google Scholar]
- 10.Waehler R, Russell SJ, Curiel DT. Engineering targeted viral vectors for gene therapy. Nat Rev Genet. 2007;8:573–587. doi: 10.1038/nrg2141. [DOI] [PMC free article] [PubMed] [Google Scholar]
- 11.Harrison SC, Olson AJ, Schutt CE, Winkler FK, Bricogne G. Tomato bushy stunt virus at 2.9 A resolution. Nature. 1978;276:368–373. doi: 10.1038/276368a0. [DOI] [PubMed] [Google Scholar]
- 12.Lilavivat S, Sardar D, Jana S, Thomas GC, Woycechowsky KJ. In vivo encapsulation of nucleic acids using an engineered nonviral protein capsid. J Am Chem Soc. 2012;134:13152–13155. doi: 10.1021/ja302743g. [DOI] [PubMed] [Google Scholar]
- 13.Hernandez-Garcia A, et al. Design and self-assembly of simple coat proteins for artificial viruses. Nat Nanotechnol. 2014;9:698–702. doi: 10.1038/nnano.2014.169. [DOI] [PubMed] [Google Scholar]
- 14.Worsdorfer B, Woycechowsky KJ, Hilvert D. Directed evolution of a protein container. Science. 2011;331:589–592. doi: 10.1126/science.1199081. [DOI] [PubMed] [Google Scholar]
- 15.Puglisi JD, Chen L, Blanchard S, Frankel AD. Solution structure of a bovine immunodeficiency virus Tat-TAR peptide-RNA complex. Science. 1995;270:1200–1203. doi: 10.1126/science.270.5239.1200. [DOI] [PubMed] [Google Scholar]
- 16.Starita LM, Fields S. Deep Mutational Scanning: A Highly Parallel Method to Measure the Effects of Mutation on Protein Function. Cold Spring Harb Protoc. 2015;2015:711–714. doi: 10.1101/pdb.top077503. [DOI] [PubMed] [Google Scholar]
- 17.Whitehead TA, et al. Optimization of affinity, specificity and function of designed influenza inhibitors using deep sequencing. Nat Biotechnol. 2012;30:543–548. doi: 10.1038/nbt.2214. [DOI] [PMC free article] [PubMed] [Google Scholar]
- 18.Knop K, Hoogenboom R, Fischer D, Schubert US. Poly(ethylene glycol) in drug delivery: pros and cons as well as potential alternatives. Angew Chem Int Ed Engl. 2010;49:6288–6308. doi: 10.1002/anie.200902672. [DOI] [PubMed] [Google Scholar]
- 19.Hui DJ, et al. AAV capsid CD8+ T-cell epitopes are highly conserved across AAV serotypes. Mol Ther Methods Clin Dev. 2015;2:15029. doi: 10.1038/mtm.2015.29. [DOI] [PMC free article] [PubMed] [Google Scholar]
- 20.Mingozzi F, et al. CD8(+) T-cell responses to adeno-associated virus capsid in humans. Nat Med. 2007;13:419–422. doi: 10.1038/nm1549. [DOI] [PubMed] [Google Scholar]
- 21.Gibson DG, et al. Enzymatic assembly of DNA molecules up to several hundred kilobases. Nat Methods. 2009;6:343–345. doi: 10.1038/nmeth.1318. [DOI] [PubMed] [Google Scholar]
- 22.Kunkel TA. Rapid and efficient site-specific mutagenesis without phenotypic selection. Proc Natl Acad Sci U S A. 1985;82:488–492. doi: 10.1073/pnas.82.2.488. [DOI] [PMC free article] [PubMed] [Google Scholar]
- 23.Rohland N, Reich D. Cost-effective, high-throughput DNA sequencing libraries for multiplexed target capture. Genome Res. 2012;22:939–946. doi: 10.1101/gr.128124.111. [DOI] [PMC free article] [PubMed] [Google Scholar]
- 24.Alvarez P, Buscaglia CA, Campetella O. Improving protein pharmacokinetics by genetic fusion to simple amino acid sequences. J Biol Chem. 2004;279:3375–3381. doi: 10.1074/jbc.M311356200. [DOI] [PubMed] [Google Scholar]
- 25.Schellenberger V, et al. A recombinant polypeptide extends the in vivo half-life of peptides and proteins in a tunable manner. Nat Biotechnol. 2009;27:1186–1190. doi: 10.1038/nbt.1588. [DOI] [PubMed] [Google Scholar]
- 26.Benson DA, et al. GenBank. Nucleic Acids Res. 2013;41:D36–42. doi: 10.1093/nar/gks1195. [DOI] [PMC free article] [PubMed] [Google Scholar]
- 27.Nannenga BL, Iadanza MG, Vollmar BS, Gonen T. Overview of electron crystallography of membrane proteins: crystallization and screening strategies using negative stain electron microscopy. Curr Protoc Protein Sci. 2013 doi: 10.1002/0471140864.ps1715s72. Chapter 17, Unit17.15. [DOI] [PMC free article] [PubMed] [Google Scholar]
- 28.Suloway C, et al. Automated molecular microscopy: the new Leginon system. J Struct Biol. 2005;151:41–60. doi: 10.1016/j.jsb.2005.03.010. [DOI] [PubMed] [Google Scholar]
- 29.Tang G, et al. EMAN2: an extensible image processing suite for electron microscopy. J Struct Biol. 2007;157:38–46. doi: 10.1016/j.jsb.2006.05.009. [DOI] [PubMed] [Google Scholar]
- 30.Fowler DM, Araya CL, Gerard W, Fields S. Enrich: software for analysis of protein function by enrichment and depletion of variants. Bioinformatics. 2011;27:3430–3431. doi: 10.1093/bioinformatics/btr577. [DOI] [PMC free article] [PubMed] [Google Scholar]
- 31.Hunter JD. Computing In Science \& Engineering. 2007;9:90–95. [Google Scholar]
- 32.Kim D, Langmead B, Salzberg SL. HISAT: a fast spliced aligner with low memory requirements. Nat Methods. 2015;12:357–360. doi: 10.1038/nmeth.3317. [DOI] [PMC free article] [PubMed] [Google Scholar]
- 33.Li H, et al. The Sequence Alignment/Map format and SAMtools. Bioinformatics. 2009;25:2078–2079. doi: 10.1093/bioinformatics/btp352. [DOI] [PMC free article] [PubMed] [Google Scholar]
- 34.Pertea M, Kim D, Pertea GM, Leek JT, Salzberg SL. Transcript-level expression analysis of RNA-seq experiments with HISAT, StringTie and Ballgown. Nat Protoc. 2016;11:1650–1667. doi: 10.1038/nprot.2016.095. [DOI] [PMC free article] [PubMed] [Google Scholar]
Associated Data
This section collects any data citations, data availability statements, or supplementary materials included in this article.
Supplementary Materials
Data Availability Statement
Nucleocapsid genome files (genbank format) and design models (pdb format) are available on github (https://github.com/mlajoie/Synthetic_Nucleocapsid). All raw sequencing data from Fig. 2–4, Extended Data Fig. 2–4, and fig. S3, S7-S9 are available at the NCBI Sequence Read Archive under BioProject accession PRJNA417493. Source data for Fig. 1d-f, Fig. 4a-d, Extended Data Fig. 1b-d, Extended Data Fig. 3d-e, Extended Data Fig. 4c-d, and fig. S8 are provided with the paper. All other raw data not included in the manuscript are available from the corresponding author upon request.