Abstract
Oligoclonal expansion of CD8+ CD28− lymphocytes has been considered indirect evidence for a pathogenic immune response in acquired aplastic anemia. A subset of CD8+ CD28− cells with CD57 expression, termed effector memory cells, is expanded in several immune-mediated diseases and may have a role in immune surveillance. We hypothesized that effector memory CD8+CD28−CD57+ cells may drive aberrant oligoclonal expansion in aplastic anemia. We found CD8+CD57+ cells frequently expanded in the blood of aplastic anemia patients, with oligoclonal characteristics by flow cytometric Vβ usage analysis: skewing in 1–5 Vβ families and frequencies of immunodominant clones ranging from 1.98% to 66.5%. Oligoclonal characteristics were also observed in total CD8+ cells from aplastic anemia patients with CD8+CD57+ cell expansion by T-cell receptor deep sequencing, as well as the presence of 1–3 immunodominant clones. Oligoclonality was confirmed by T-cell receptor repertoire deep sequencing of enriched CD8+CD57+ cells, which also showed decreased diversity compared to total CD4+ and CD8+ cell pools. From analysis of complementarity-determining region 3 sequences in the CD8+ cell pool, a total of 29 sequences were shared between patients and controls, but these sequences were highly expressed in aplastic anemia subjects and also present in their immunodominant clones. In summary, expansion of effector memory CD8+ T cells is frequent in aplastic anemia and mirrors Vβ oligoclonal expansion. Flow cytometric Vβ usage analysis combined with deep sequencing technologies allows high resolution characterization of the T-cell receptor repertoire, and might represent a useful tool in the diagnosis and periodic evaluation of aplastic anemia patients. (Registered at clinicaltrials.gov identifiers: 00001620, 01623167, 00001397, 00071045, 00081523, 00961064)
Introduction
Acquired aplastic anemia (AA) is a bone marrow (BM) failure syndrome characterized by peripheral blood (PB) pancytopenia and BM hypocellularity due to hematopoietic stem and progenitor cell destruction.1–7 There is indirect evidence to support the hypothesis of autologous immune attack: clinical response to immunosuppressive therapies (IST),1,2,8–10 the predominant role of activated cytotoxic T cells (CTLs) in BM growth inhibition,1,10–12 identification of putative autoantigens,13,14 and oligoclonal expansion of CD8+ lymphocytes.8,14–17
Oligoclonality of T-cell populations has been defined by flow cytometry and deep sequencing of the T-cell receptor (TCR) Vβ repertoire and by spectratyping of complementarity-determining region 3 (CDR3) length skewing.18–21 The TCR, an αβ or γδ heterodimer, is responsible for antigen recognition and T-cell activation.22–26 Each chain is the result of a complex gene locus rearrangement, known as VDJ recombination.23 On a rearranged VDJ segment, a terminal deoxynucleotidyl transferase enzyme increases TCR variability through insertions/deletions within a hypervariable region, the CDR3, generating a unique potential antigen-specific sequence.23 Early in infection, CD28+ CTLs with different antigen affinity are selected and expanded (polyclonal phase).27 In late stages, high antigen-affinity CD28− T cells are in resting state as memory T cells.28–29 The expression of CD57 on CD8+CD28− T cells identifies a subset of memory T cells termed effector memory because of their high antigen-affinity and ability to be rapidly activated after antigen stimulation, as “tissue-guards”.29,30 Direct evidence of their high antigen-affinity is decreased diversity in the CD8+CD57+ TCR repertoire (oligoclonality) due to the presence of only a few selected clones of memory cells.27
In this work, we investigated the frequency and oligoclonal expansion of effector CD28−CD57+ memory cells in CD4+ and CD8+ T cells and the TCR Vβ repertoire in AA patients by flow cytometry and deep sequencing technologies, to provide additional evidence for the immune hypothesis in AA pathophysiology.
Methods
Human samples
Heparinized whole PB was collected from patients and healthy subjects after informed consent, in accordance with the Declaration of Helsinki31 and protocols approved by the National Heart, Lung, and Blood Institute Institutional Review Board (National Institutes of Health, Bethesda, MD, USA) (see Online Supplementary Table S1 for clinical characteristics). HLA haplotypes are reported in Online Supplementary Table S2. All patients received a diagnosis of severe AA (SAA) according to the International Study of Aplastic Anemia and Agranulocytosis32 and to the criteria of Camitta.33 At the time of blood sampling, none of the patients had received therapy. Peripheral blood mononuclear cells (PBMCs) were isolated by Ficoll-Paque density gradient centrifugation (MP Biomedicals, LLC, Santa Ana, CA, USA) according to the manufacturer’s instructions.
Flow cytometry
A minimum of 4×10⁶ PBMCs from each subject were stained for TCR Vβ repertoire analysis (Online Supplementary Figure S1). The manufacturer’s instructions for the IOTest Beta Mark (Beckman Coulter, Miami, FL, USA) were optimized to avoid incorrect compensation due to the existence of FITC/PE double positive antibodies in the kit, as described in Online Supplementary Methods. Expansion of CD8+CD57+ cells was defined using as a threshold the mean frequency calculated in healthy subjects. Vβ skewing in SAA patients was described when the frequency of one Vβ family was higher than the mean+3Standard Deviation (SD) in healthy subjects.16 The term “immunodominant clone” was defined as the Vβ+ population by flow cytometry or the DNA sequence by deep sequencing present in the highest abundance.17
TCR repertoire deep sequencing
For VDJ combination and CDR3 sequence profiling,34 DNA was isolated from FACS− or beads- (Miltenyi Biotec Inc., San Diego, CA, USA) sorted CD4+ and CD8+ T cells from 12 SAA patients with CD8+CD57+ cell expansion and 9 healthy subjects (mean: 3.2 μg of DNA; range: 0.2–27.4 μg) (Online Supplementary Table S2). DNA was also isolated from beads-sorted CD8+CD57+ cells from 2 of the 12 SAA patients with enough cells for further analysis (mean: 1.6 μg of DNA). TCR repertoire sequencing was performed with an Illumina HiSeq 2000 sequencer (Illumina Inc., San Diego, CA, USA). Detailed information is provided in the Online Supplementary Methods. Data have been deposited in the NCBI GEO database (accession n. GSE101660).
Statistical analysis
Data were analyzed using R (RStudio, Boston, MA, USA) and Prism (v.7.02; GraphPad software Inc., La Jolla, CA, USA). Mann-Whitney U test, Wilcoxon signed rank sum test, pair and unpaired t-tests, or χ2 test were used for data with abnormal distributions. Bonferroni and Dunn’s corrections were used for multiple comparisons. P≤0.05 was considered statistically significant, after adjustment with Bonferroni and false discovery rate (FDR).35 Linear regression was performed for correlations. Log-rank (Mantel-Cox) test was used for progression-free survival data analysis. Simpson’s diversity index was calculated according to the following formula:
in which ni represents the clone size as the number of copies of each clonotype (i) or the total number of CDR3 sequences belonging to each i clonotype, and n is the total number of different clonotypes in the sample or the total number of sequences for each sample.
Results
Effector memory CD8+CD57+ T cells frequently show oligoclonal expansion of TCR Vβ repertoire by flow cytometry
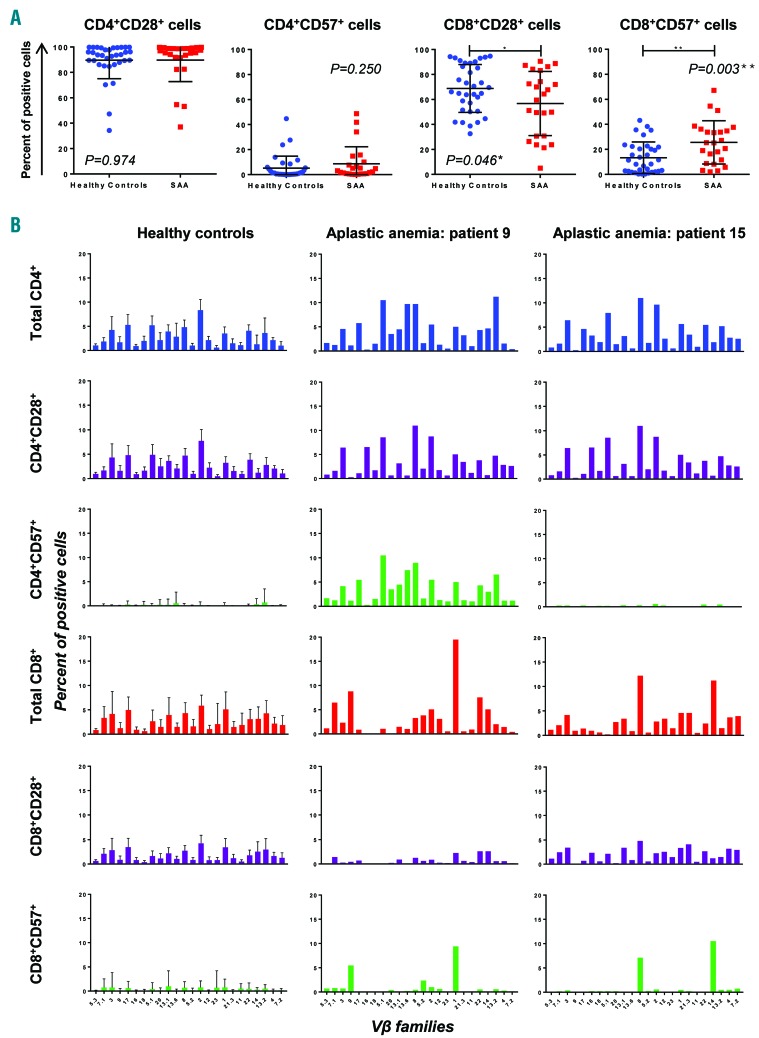
Immunophenotyping and flow-cytometry Vβ usage were performed in 24 SAA patients. Clinical characteristics are reported in Online Supplementary Table S1. A group of 34 healthy subjects was studied in order to define normal ranges of T-cell populations and Vβ family expression. SAA patients showed higher frequencies of CD8+CD57+ cells (25.6±17.3% vs. 13.3±12.6% in healthy individuals; P=0.003), and decreased frequency of CD8+CD28+ cells (56.8±25.7% vs. 68.8±19.1%; P=0.046). A negative correlation between CD57 and CD28 expression was also present (r2=0.601, P<0.0001). No differences were found for CD28+ and CD57+ cells within the CD4+ subset (P=0.974 and P=0.250, respectively) (Figure 1A).
Figure 1.
Immunophenotyping and flow cytometry analysis of Vβ usage in severe aplastic anemia (SAA) patients and healthy subjects. (A) Percentages of CD28+ and CD57+ cells were calculated in both CD4+ and CD8+ compartments for healthy controls and SAA patients. Data are shown as mean±Standard Deviation (SD). Unpaired t-test was performed. *P<0.05; **P<0.01. (B) Vβ usage was studied in T-cell compartments (by row), and percentages of each Vβ family were reported as total CD4+ or CD8+ cell percentage. For Vβ usage in healthy subjects, data are shown as mean+SD, combining the results from all 34 healthy donors. For SAA patients, 2 representative cases are shown.
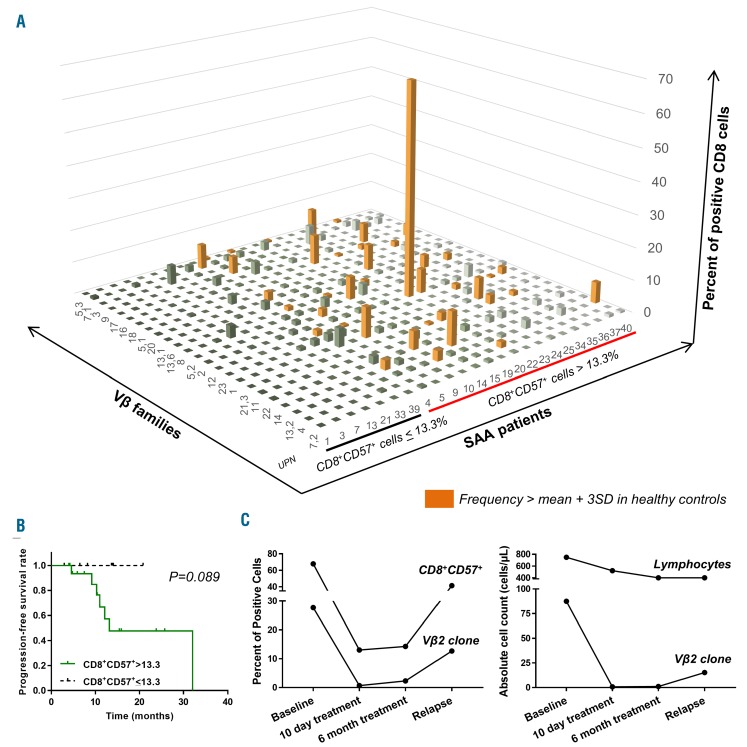
By Vβ usage, polyclonal expansion was observed in total CD4+, CD4+CD28+, CD4+CD57+ and CD8+CD28+ cells in both healthy subjects and SAA patients (Figure 1B and Online Supplementary Figure S2). Oligoclonal expansion of CD8+CD57+ cells was present in 92% of SAA patients with 1–3 immunodominant clones, while in total CD8+ cells oligoclonality was reported only in 33% of cases (Online Supplementary Figure S3). Patients did not show expansion of a shared Vβ family, as each subject carried a different TCR Vβ rearrangement in effector memory CD8+ T cells (Figure 2A). None of the 7 patients without CD8+CD57+ cell expansion showed Vβ skewing in any subgroup, with mean frequency of the immunodominant clone of 3.8% (range: 0.21–6.01%). Conversely, all 17 patients with effector memory CD8+ cell expansion showed Vβ skewing in 1–5 Vβ subgroups, and frequencies of the immunodominant clones ranged from 2.1% to 66.5% (mean: 9.9%).
Figure 2.
Vβ usage at diagnosis and during treatment. (A) Percentages of Vβ family in CD8+CD57+ cells were calculated on total CD8+ cells, and Vβ skewing in severe aplastic anemia (SAA) patients was defined using the mean+3Standard Deviation (SD) of a given Vβ group in healthy donors. Relative expansion of each Vβ subgroup is shown in the bar graph. Patients were divided based on the absence or presence of expanded CD8+CD57+ cells, using the mean in healthy donors (13.3%). Skewing of one Vβ family is reported as an orange bar. (B) Progression-free survival rate of SAA patients with CD8+CD57+ cells ≤13.3% (n=7) or >13.3% (n=17) prior to treatment. Log-rank (Mantel-Cox) test was performed. (C) Vβ usage was performed in Patient 22 at diagnosis, at 10 days of treatment, and at 6 and 9 months (relapse). Perturbations during treatment and relapse are reported as percentage of positive CD8+CD57+ and Vβ2+ cells (left), or absolute lymphocyte and Vβ2 clone count (right).
Progression-free survival (PFS) analysis was performed on all SAA patients, divided according to pre-treatment frequencies of effector memory CD8+ T cells (cut-off value 13.3%) (Figure 2B). No patients with low CD8+CD57+ cell frequency (n=7) experienced relapse (median survival not reached; median follow-up time: 13.6 months), while 7 of the 17 SAA subjects with expanded effector memory T cells relapsed or died (median survival 13.2 months; median follow up: 10.4 months). However, statistical significance between the two curves was not reached (P=0.089). Vβ usage was analyzed in CD4+ and CD8+ T-cell subsets in serial samples available for Patients 4, 22, and 34 in order to understand the correlation of Vβ usage with clinical course (Figure 2C and Online Supplementary Figure S4A). For Patient 22, at baseline, Vβ was the immunodominant clone and mostly enriched in CD8+CD57+ cell population, rather than in CD4+CD28+, CD4+CD57+, and CD8+CD28+ cells. After ten days of IST, the size of the CD8+CD57+ clone was greatly reduced. The clone was detected again at six months (3 months before clinical relapse) and further increased at relapse (Figure 2C), suggesting association of Vβ expansion with clinical status. Patients 4 and 34 were non-responders at three months, and non- and minimal partial-responders at the 6-month time point. However, no significant changes in immunodominant clone size were observed (Online Supplementary Figure S4A). Vβ usage was also investigated at baseline in the BM of these 2 patients (Online Supplementary Figure S4B), and high concordance with Vβ usage of PB CD8+CD57+ cells was described.
Increased expansion of effector memory CD8+ T cells with age has been reported;36 therefore, we used a pool of age-matched healthy controls to assess the effect of age. There was no correlation between the size of the immunodominant clone in CD8+CD57+ cells and age in healthy subjects (r2=0.0003, P=0.919) or in SAA patients (r2=0.140, P=0.079) (Online Supplementary Figure S5). However, a correlation was found between CD57 expression and age in SAA patients (r2=0.552, P<0.0001).
We then assessed the effect of transfusion history on oligoclonal expansion of effector memory T cells, as transfusions expose T cells to multiple foreign epitopes.37 A group of 5 pure red cell aplasia (PRCA) patients, 10 sickle cell disease (SCD) subjects, and 8 myelodysplastic (MDS) patients who had been heavily transfused before sampling were studied for CD8+CD57+ cell expansion and Vβ usage (Online Supplementary Table S1). No variations were observed in CD8+CD57+ cell frequencies when PRCA, MDS, and SCD patients were compared to healthy subjects (22.8±25.1% vs. 21.6±9.7% vs. 30.6±28.3% vs. 13.3±12.6%, respectively; P=0.216) (Online Supplementary Figure S6A). Vβ skewing was described in 4 PRCA patients in 1–8 subgroups, in all 8 MDS subjects in 1–4 Vβ families, and in 7 SCD patients in 1–5 subgroups (Online Supplementary Figure S6B). Oligoclonal expansion was described in 91% of cases and subjects without skewing did not present effector memory T-cell expansion. Subsequently, we combined all subjects and divided them according to their transfusion history and the presence of CD8+CD57+ T-cell expansion. By χ2 test, transfusion history did not correlate to CD8+CD57+ expansion (P=0.255).
Total CD8+ cell TCR repertoires are polyclonal in healthy subjects
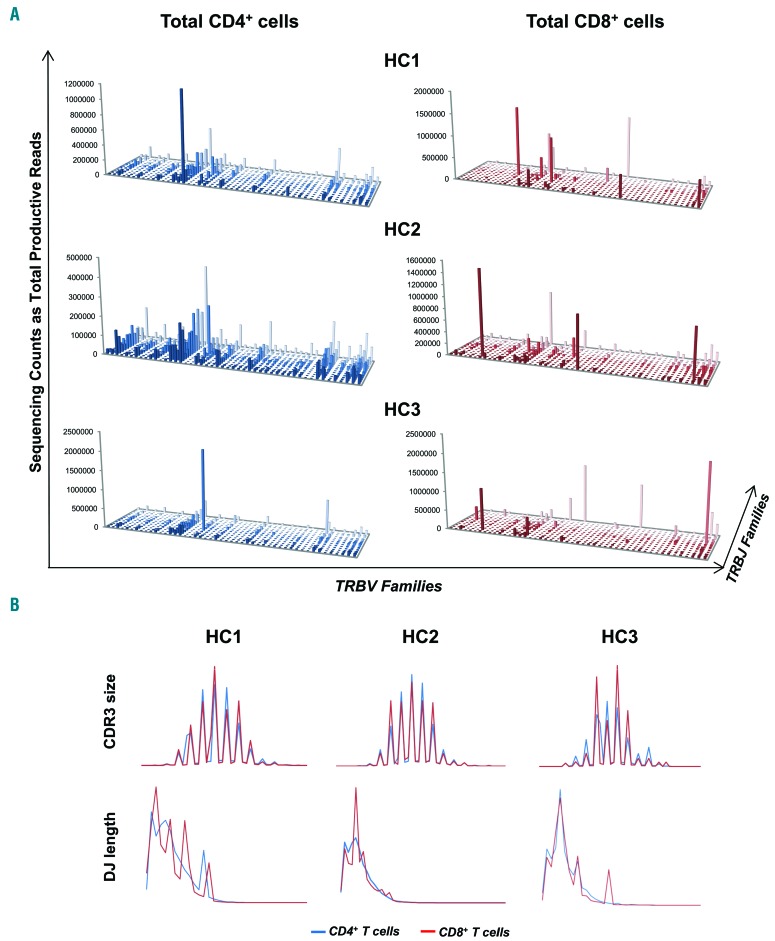
Deep sequencing of TCR repertoire was performed in CD4+ and CD8+ populations sorted from 9 healthy donors. The average depth of sequencing was 10,790,646±4,050,138 in CD4+ T cells, and 10,961,961±3,879,596 in CD8+ populations. The mean frequency of the immunodominant clone was 4.1±4.1% in CD4+ cells and 17.3±16.9% in CD8+ cells. By plotting the number of reads of each Vβ and Jβ matching,17 a “citylike” landscape was described for total CD4+ and CD8+ T-cell populations (Figure 3A and Online Supplementary Figure S7A), because of the presence of a more homogenous distribution of TCR rearrangement frequencies (“midtown”). The normal CDR3 size and DJ length profiles were defined by comparing distributions among healthy donors (Figure 3B and Online Supplementary Figure S7B). In CD4+ and CD8+ cells, profiles were typically distributed in a Gaussian manner with 10–12 different size classes of 30–65 nucleotides (nt) sizes at 3 nt intervals, and they completely overlapped. Similarly, DJ length profiles assumed an asymmetric Gaussian distribution with 2–5 predominant length classes without nt intervals in CD4+ and CD8+ subsets.
Figure 3.
Characterization of Vβ/Jβ plot, CDR3 size and DJ length profiles in healthy donors by deep sequencing. (A) T-cell receptor β variable (TRBV)/T-cell receptor β joining (TRBJ) plots showed a “citylike” landscape for total CD4+ and CD8+ cell populations in healthy subjects (HC). (B) The size of the complementarity region 3 (CDR3) and DJ length profiles were also defined, showing similar features in CD4+ and CD8+ cells.
Deep sequencing allows detailed characterization of oligoclonality in SAA
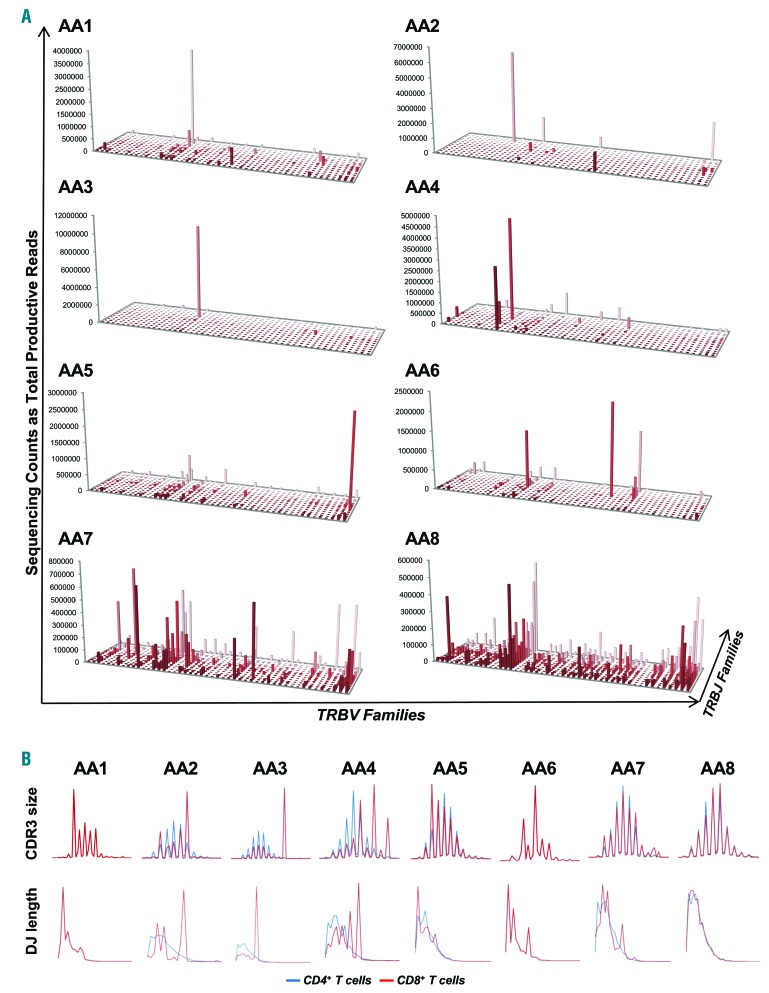
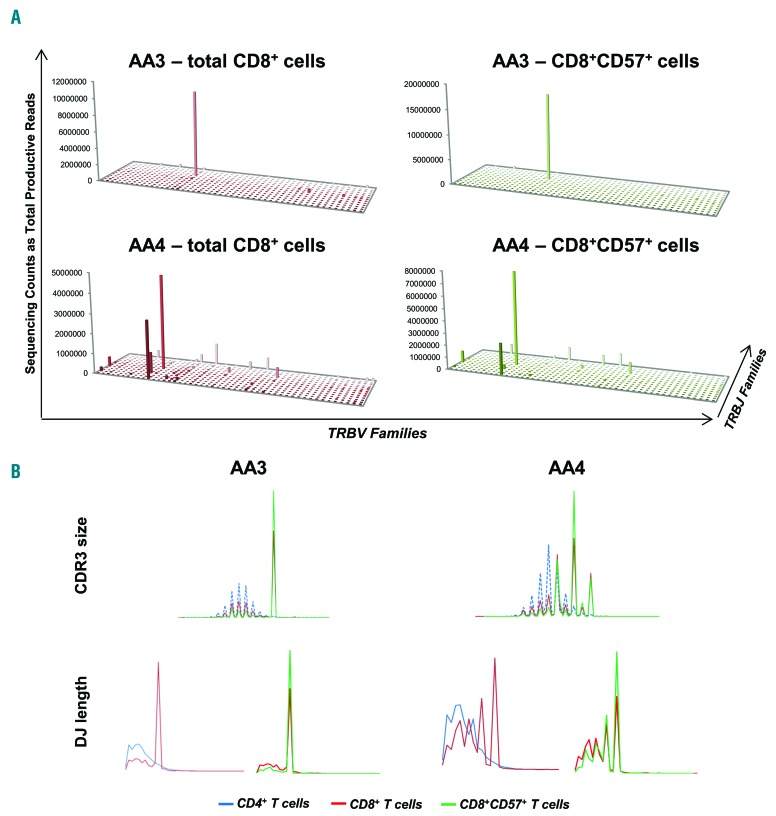
Deep sequencing of TCR repertoire was performed in CD4+ and CD8+ cells from 12 SAA patients who had demonstrated CD8+CD57+ cell expansion by flow cytometry, and also in CD8+CD57+ cells from 2 of these patients. The average depth of sequencing was 13,861,048±4,992,677 in CD4+ T cells, 13,873,207±5,029,195 in CD8+ T cells, and 21,030,616±1,238,660 in CD8+CD57+ cells. The mean frequency of the immunodominant clone was 3.3±3.4% (range: 0.2–11.8%) in CD4+, 18.2±14.9% (range: 3.3–54.1%) in CD8+ cells, and 59±28.9% in CD8+CD57+cells. By plotting TRBV/TRBJ rearrangements from CD4+ cells, the “citylike” landscape was found in 11 out of 12 patients (Figure 4A and Online Supplementary Figure S8A). In the CD8+ cell pool, the “citylike” landscape was found in 3 patients (AA7, AA8, and AA11), whose clones showed very low frequencies (4.3%, 3.4%, and 3.3%, respectively). The remaining patients displayed a “skyscraper” landscape due to the presence of 1–3 immunodominant clones. CDR3 size and DJ length profiles were defined in total CD4+ and CD8+ cells and compared within each patient (Figure 4B and Online Supplementary Figure S8B). In CD4+ cells, all patients displayed CDR3 profiles with normal Gaussian distribution, as described in healthy subjects. In CD8+ cells, Patients AA7, AA8, and AA10 to AA12 had CDR3 size profiles with Gaussian distributions. In the remaining patients, CDR3 profiles showed different shapes with 8–13 different classes and 1 or 2 predominant peaks of various nt sizes (36–57). For DJ length profiles in SAA patients, the asymmetric Gaussian distribution was described in all CD4+ cells, and in 6 (AA5-AA8 and AA11-AA12) CD8+ populations. Similarly, TRBV/TRBJ rearrangement plots from the CD8+CD57+ cell pool of AA3 and AA4 showed the same “skyscraper” landscape, but more enriched (Figure 5A), as well as CDR3 size and DJ length profiles that overlapped those in total CD8+ cells, although these were again more enriched (Figure 5B).
Figure 4.
The TCR repertoire by deep sequencing analysis from total CD8+ cells in severe aplastic anemia (SAA) patients with CD8+CD57+ cell expansion. In contrast to healthy CD8+ profiles, most SAA patients (AA) displayed oligoclonal features in a TRBV/TRBJ rearrangement plot (A) and CDR3 size and DJ length profiles (B). CD4+ and CD8+ profiles are shown for each SAA patient. In AA1 and AA6, only CD8+ cells were sufficient for deep sequencing.
Figure 5.
The TCR repertoire by deep sequencing of enriched CD8+CD57+ cells in severe aplastic anemia (SAA) patients. (A) The enrichment of the clone in effector memory CD8+ T cells, comparing TRBV/TRBJ rearrangement in total CD8+ cells (left) with those in CD8+CD57+ cells (right) from the same patients. (B) CDR3 size and DJ length profiles from CD8+CD57+ cells also overlapped with those in CD4+ and CD8+ profiles.
TCR repertoire diversity and shared CDR3 sequences in SAA patients and healthy subjects
Simpson’s index of diversity was calculated for each healthy and each SAA subject. This index is used in ecology for in-depth assessment of the degree of diversity of a system, related to the richness (or number of species present) and evenness (or relative abundance of each).38 Thus, this index assesses the probability that 2 randomly selected individuals from a system belong to the same species. For a TCR repertoire, the index measures the probability that 2 CDR3 sequences randomly selected from CD4+ or CD8+ pools of one subject could be identical.17,38 A value close to 0 means infinite diversity, and a value close to 1 no diversity.36 In our cohort, Simpson’s indexes were similar in healthy controls and SAA patients for CD4+ (0.990±0.005 vs. 0.991±0.005, respectively; P=0.537) and CD8+ cells (0.983±0.013 vs. 0.927±0.084, respectively; P=0.060). By paired t-test, Simpson’s indexes in SAA subjects were significantly different between CD4+ and CD8+ cells (P=0.047) (Online Supplementary Figure S9A). When compared to those indices in CD8+CD57+ cells, decreased diversity in the CD8+ effector memory compartment was described (total CD4+ cells vs. CD8+CD57+ cells, P<0.0001; total CD8+ cells vs. CD8+CD57+ cells, P=0.0003) (Online Supplementary Figure S9B).
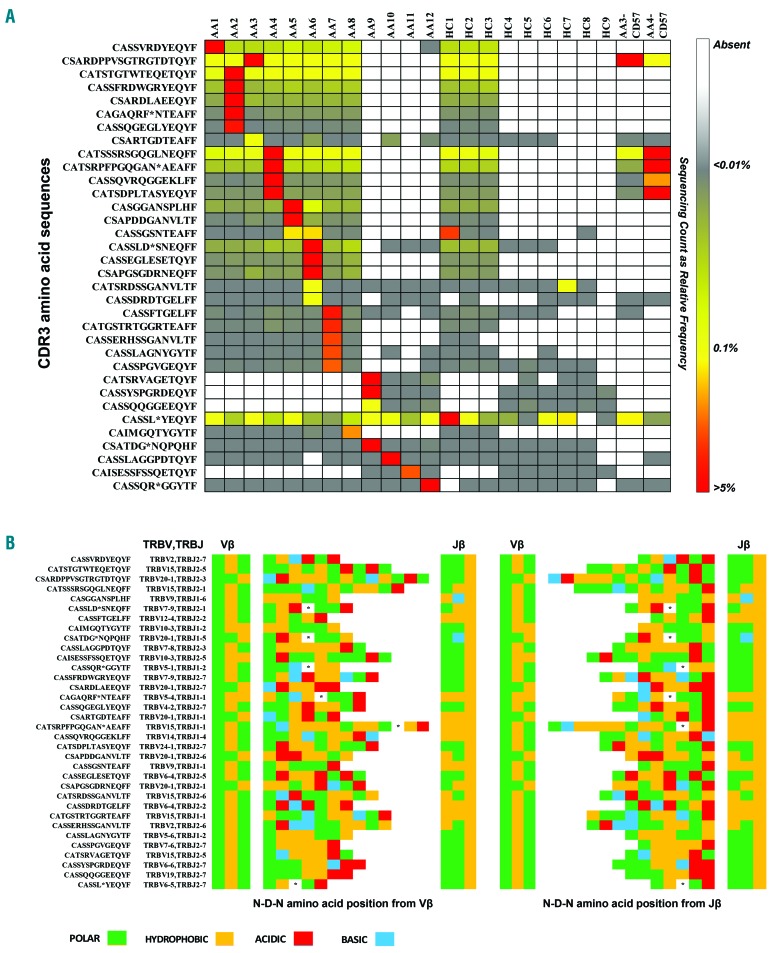
In order to test the hypothesis that an autoreactive clone is triggered by autoantigens, CDR3 amino acid sequences from healthy subjects and patients were screened for homology and then compared to public and private TCR repertoires reported in literature,39 as described in the Online Supplementary Methods. From analysis of sequences in the CD8+ cell pool, a total of 29 CDR3 sequences were shared between patients and controls, but these sequences were highly expressed in SAA patients and also present in their immunodominant clones (Figure 6A). When we searched for these common sequences in the whole CDR3 sequence repertoire from CD8+CD57+ cells in AA subjects, CD8+CD57+ cell pools from AA3 and AA4 showed enrichment in frequencies of the immunodominant clones (from 53.61% to 79.12% for AA3 patient and from 23.45% to 38.14% for AA4 patient). Structural analysis of shared and immunodominant sequences did not show a pattern of common charged residue among patients (Figure 6B and Online Supplementary Methods). Immunodominant and shared CDR3 sequences were compared with CDR3 β repertoires reported in literature for infectious, autoimmune and malignant diseases.39 For confirmation, the VDJdb database, a database of known antigen specific sequences (https://vdjdb.cdr3.net), was also used. No matches were found for infectious diseases, while 2 sequences present in AA9 were reported previously in AA and paroxysmal nocturnal hemoglobinuria (PNH).8,40 Lastly, we sought to perform homology assessment for reported PNH-related clonotypes on the entire TCR repertoire without frequency restriction, as small PNH clones could be present in healthy individuals.40 Two of the reported 12 CDR3 sequences (CATSRTGGETQYF and CATSRV-VAGETQYF) were found in our TCR repertoires with a mean frequency of 0.1±0.2% and 4.7±9.4% in SAA patients, and 0.0003±0.0001% and 0.01±0.002% in healthy subjects. No matches were found in the enriched CD8+CD57+ T-cell pool (Online Supplementary Table S3).
Figure 6.
Homology assessment. (A) CDR3 sequence pools were analyzed among patients (AA) and healthy subjects (HC) for the presence of homology. Shared and immunodominant sequences were reported as a heatmap based on their relative expression: in the same row, from lowest (gray; <0.01%) to highest (red; >5%) values. (B) Structural analysis was performed comparing the sequences for common pattern, using both alignments at the N-terminal of Vβ gene (left) or at the C-terminal of Jβ gene (right).
Discussion
The character of oligoclonal expansion of CD8+CD28− lymphocytes in AA, described by Risitano et al.,8,41 strongly suggests an antigen driven mechanism of T-cell activation, ultimately leading to destruction of hematopoietic stem and progenitor cells. In this study, we focused on a subset of CD8+CD28−CD57+ T lymphocytes, termed effector memory cells because of their high antigen-affinity and their ability to undergo activation after antigen stimulation.27,36 Others have reported the expansion of effector memory CD8+ T cells in the tumor microenvironment and in PB from patients with solid tumors, hematologic malignancies, chronic infections and autoimmune disorders.36,41–44 In cancers, effector memory T cells appear to have an important role in immune surveillance; for example, their increase after interferon (IFN)a treatment correlates to better prognosis in melanoma patients,43 and expanded CD8+CD57+ T cells reach normal levels after removal of head and neck cancer.36 Higher frequencies of CD8+CD57+ cells have also been described in SAA and MDS patients, which decrease in responders after anti-thymocyte globulin treatment.44 The expansion of effector memory cells could also occur in older healthy subjects as a result of lifelong exposure to common pathogens, but it is related to reduced overall immune responsiveness to novel antigens.45,46 Consistent with previous studies, the SAA patients in our cohort had higher frequencies of CD8+CD57+ cells at diagnosis (25.6% in SAA patients vs. 13.3% in healthy subjects). Moreover, patients with CD8+ effector memory T-cell expansion at diagnosis experienced shorter PFS. No age-effects were seen for clone size in either patients or healthy subjects.
There is indirect evidence of immune pathophysiology of AA, including oligoclonal expansion of effector CD8+ T lymphocytes.8,41 Clonality of T-cell subsets can be studied by flow cytometry analysis of Vβ usage, CDR3 size spectratyping or deep sequencing of VDJ combinations, and CDR3 nucleotide and amino acid sequences.17–20,47 In SAA patients, expansion of at least one Vβ family in both CD4+ and CD8+ effector CD28dim cells by flow cytometry with polyclonal features in CD4+ and oligoclonal characteristics in CD8+ cells has been described.1,8,15,41,44 The CDR3 size skewing by spectratyping in the CD8+ population but not in CD4+ cells confirmed clonality in CD8+ cells.8,21,41 In our current work, we demonstrate by flow cytometry and deep sequencing that oligoclonal expansion occurs mainly in effector memory CD8+ cell compartment, as the immunodominant clones were highly enriched in CD8+CD57+ cells and had decreased diversity on deep sequencing. Effector memory T cells are a circulating T-cell population that can migrate to the BM under different types of stimulation.30 Vβ usage of peripheral CD8+CD57+ T cells may mirror that in the BM, as suggested by the high concordance between PB and BM in our AA patients. In our cohort, 75% of SAA patients with effector memory cell expansion also showed oligoclonal features by deep sequencing of the total CD8+ cell compartment: TRBV/TRBJ rearrangement plots with a “skyscraper” profile due to the presence of 1–3 immunodominant clones, and predominant classes in CDR3 size and DJ length profiles. These findings were confirmed by TCR repertoire sequencing of CD8+CD57+ enriched cells from SAA patients. Similar deep sequencing features have been described in whole blood in T-cell large granular lymphocyte leukemia (T-LGLL).17 T-LGLL, a chronic lymphoproliferation of TCRaβ+CD3+CD5dimCD8+CD57+CD16+ cells with monoclonal TCRγ-chain rearrangement and prevalence in the elderly, is frequently associated with autoimmune diseases.16,17 Thus, similarities between our SAA cohort and T-LGLL patients suggest a common pathophysiology of expanded autoreactive T lymphocytes. Characterization of long-term Vβ usage has already been proposed as a biomarker of disease progression in T-LGLL and AA,8,16 given that immunodominant clones can remerge during relapse.16 However, high heterogeneity in the TCR repertoire during immunosuppressive therapies has been reported.8,16 In our study, immunodominant clones were longitudinally investigated in 3 AA patients. In Patient 4, expanded clones slightly decreased during treatment but did not disappear, as no hematologic improvements were observed. In Patient 34, clone 17 remained stable during the course of the disease, while clone 13.6 increased at three months and slightly decreased at six, concomitantly with a minimal partial response. In Patient 22, clone 2 completely disappeared at six months of treatment and the patient achieved hematologic remission; however, at the time of relapse the clone increased again. Our data suggest that Vβ typing of the CD8+ CD57+ T-cell population by flow cytometry might be a useful biomarker to monitor clonal kinetics during the course of AA, but a larger cohort of patients and a more sensitive technique, such as deep sequencing, are needed to validate the clinical usefulness.
Chronic antigen exposure is required to trigger T-cell activation, as in persistent viral infections or with antigen spread during autoimmune and malignant diseases.17 For viral infections, CDR3 homology in public sequence repertoires, and also cross-reactivity between viruses, is limited by the number of possible epitopes.41,48 For autoimmune diseases, including T-LGLL, clonotypes can be private to a specific disease because of the unlimited number of possible epitopes.17,41,49 Despite the large diversity of TCR CDR3 sequences, only 29 shared CDR3 sequences were found in our cohort; these were highly expressed in SAA patients and enriched in the CD8+ CD57+ T-cell population. By using sensitive techniques such as deep sequencing, we detected sequences at very low frequencies. However, the finding that a group of clonotypes is shared between SAA patients and healthy subjects suggests the existence of common epitopes driving activation of T-cell autologous clones (as also described by Gargiulo et al. in PNH patients40). As chronic transfusion could be the source of antigen exposure, we investigated its effect on effector memory T-cell expansion in other hematologic diseases. A comparison between transfused patients and healthy subjects showed no significant variations in CD8+ CD57+ cell frequencies (P=0.216).
Oligoclonal expansion of effector memory CD8+ T cells is frequent in AA and may correlate with prognosis, consistent with a role of effector memory T cells in BM destruction during active disease. Deep sequencing technologies allow in-depth characterization of the TCR repertoire, and flow cytometric analysis of Vβ usage may be useful to determine diagnosis and prognosis of SAA patients, and to monitor their clinical course.
Supplementary Material
Acknowledgments
The authors would like to thank Sachiko Kajigaya and Keyvan Keyvanfar (Hematology Branch, NHLBI), Ying Rao (BGI Genomics), and Swee Lay Thein (Sickle Cell Branch, NHLBI) for assistance; Kinneret Broder (Hematology Branch, NHLBI) for assistance in obtaining healthy volunteer samples; and Barbara Weinstein (Hematology Branch, NHLBI) and Jim Nichols (Sickle Cell Branch, NHLBI) for obtaining patient samples.
Footnotes
Check the online version for the most updated information on this article, online supplements, and information on authorship & disclosures: www.haematologica.org/content/103/5/759
Funding
This research was supported by the Intramural Research Program of the NIH, National Heart, Lung, and Blood Institute.
References
- 1.Young NS, Calado RT, Scheinberg P. Current concepts in the pathophysiology and treatment of aplastic anemia. Blood. 2006;108(8):2509–2519. [DOI] [PMC free article] [PubMed] [Google Scholar]
- 2.Young NS. Current concepts in the pathophysiology and treatment of aplastic anemia. Hematology Am Soc Hematol Educ Program. 2013;2013:76–81. [DOI] [PMC free article] [PubMed] [Google Scholar]
- 3.Maciejewski JP, Selleri C, Sato T, Anderson S, Young NS. A severe and consistent deficit in marrow and circulating hematopoietic cells (long-term culture-initiating cells) in acquired aplastic anemia. Blood. 1996;88(6):1983–1991. [PubMed] [Google Scholar]
- 4.Maciejewski JP, Kim S, Sloand E, Selleri C, Young NS. Sustained long-term hematologic recovery despite a marked quantitative defect in the stem cell compartment of patients with aplastic anemia after immunosuppressive therapy. Am J Hematol. 2000;65(2):123–131. [DOI] [PubMed] [Google Scholar]
- 5.Risitano AM, Maciejewski JP, Selleri C, Rotoli B. Function and malfunction of hematopoietic stem cells in primary bone marrow failure syndromes. Curr Stem Cell Res Ther. 2007;2(1):39–52. [DOI] [PubMed] [Google Scholar]
- 6.Maciejewski JP, O’Keefe C, Gondek L, Tiu R. Immune-mediated bone marrow failure syndromes of progenitor and stem cells: molecular analysis of cytotoxic T cell clones. Folia Histochem Cytobiol. 2007;45(1):5–14. [PubMed] [Google Scholar]
- 7.Feng X, Scheinberg P, Wu CO, et al. Cytokine signature profiles in acquired aplastic anemia and myelodysplastic syndromes. Haematologica. 2011;96(4):602–606. [DOI] [PMC free article] [PubMed] [Google Scholar]
- 8.Risitano AM, Maciejewski JP, Green S, Plasilova M, Zeng W, Young NS. In-vivo dominant immune responses in aplastic anaemia: molecular tracking of putatively pathogenetic T-cell clones by TCR beta-CDR3 sequencing. Lancet. 2004; 364(9431):355–364. [DOI] [PubMed] [Google Scholar]
- 9.Young NS. Hematopoietic cell destruction by immune mechanisms in aquired aplastic anemia. Semin Hematol. 2000;37(1):3–14. [DOI] [PubMed] [Google Scholar]
- 10.Sloand EM, Kim S, Maciejewski JP, et al. Intracellular interferon- in circulating and marrow T cells detected by flow cytometry and the response to imunosuppressive therapy in patients with aplastic anemia. Blood. 2002;100:(4)1185–1191. [DOI] [PubMed] [Google Scholar]
- 11.Maciejewski JP, Selleri C, Anderson S, Young NS. Fas antigen expression on CD34+ human marrow cells is induced by interferon-gamma and tumor necrosis factor-alpha and potentiates cytokine-mediated hematopoietic suppression in vitro. Blood. 1995;85:(11)3183–3190. [PubMed] [Google Scholar]
- 12.Selleri C, Maciejewski JP, Sato T, Young NS. Interferon-γ constitutively expressed in the stromal microenviroment of human marrow cultures mediates potent hematopoietic inhibition. Blood. 1996; 87:(10)4149–4157. [PubMed] [Google Scholar]
- 13.Hirano N, Butler MO, von Bergwelt-Baildon MS, et al. Autoantibodies frequently detected in patients with aplastic anemia. Blood. 2003;102:(13)4567–4575. [DOI] [PubMed] [Google Scholar]
- 14.Feng X, Chuhjo T, Sugimori C, et al. Diazepam-binding inhibitor-related protein 1: a candidate autoantigen in acquired aplastic anemia patients harboring a minor populatoin of paroxysmal nocturnal hemoglobinuria-type cells. Blood. 2004; 104:(8)2425–2431. [DOI] [PubMed] [Google Scholar]
- 15.Kook H, Risitano AM, Zeng W, et al. Changes in T-cell receptor VB repertoire in aplastic anemia: effects of different immunosuppressive regimens. Blood. 2002;99(10):3668–3675. [DOI] [PubMed] [Google Scholar]
- 16.Clemente MJ, Wlodarski MW, Makishima H, et al. Clonal drift demonstrates unexpected dynamics of the T-cell repertoire in T-large granular lymphocyte leukemia. Blood. 2011;118(16):4384–4393. [DOI] [PMC free article] [PubMed] [Google Scholar]
- 17.Clemente MJ, Przychodzen B, Jerez A, et al. Deep sequencing of the T-cell receptor repertoire in CD8+ T-large granular lymphocyte leukemia identifies signature landscapes. Blood. 2013;122(25):4077–4085. [DOI] [PMC free article] [PubMed] [Google Scholar]
- 18.Calis JJ, Rosenberg BR. Characterizing immune repertoires by high throughput sequencing: strategies and applications. Trends Immunol. 2014;35(12):581–590. [DOI] [PMC free article] [PubMed] [Google Scholar]
- 19.Langerak AW, van Den Beemd R, Wolvers-Tettero IL, et al. Molecular and flow cytometric analysis of the Vbeta repertoire for clonality assessment in mature TCRalphabeta T-cell proliferations. Blood. 2001;98(1):165–173. [DOI] [PubMed] [Google Scholar]
- 20.Wlodarski MW, Gondek LP, Nearman ZP, et al. Molecular strategies for detection and quantitation of clonal cytotoxic T-cell responses in aplastic anemia and myelodysplastic syndrome. Blood. 2006;108(8):2632–2641. [DOI] [PMC free article] [PubMed] [Google Scholar]
- 21.Schuster FR, Hubner B, Führer M, et al. Highly skewed T-cell receptor V-beta chain repertoire in the bone marrow is associated with response to immunosuppressive drug therapy in children with very severe aplastic anemia. Blood Cancer J. 2011;1(3):e8. [DOI] [PMC free article] [PubMed] [Google Scholar]
- 22.Schatz DG, Ji Y. Recombination centres and the orchestration of V(D)J recombination. Nat. Rev. Immunol. 2011;11:(4)251–263. [DOI] [PubMed] [Google Scholar]
- 23.Gauss GH, Lieber MR. Mechanistic constraints on diversity in human V(D)J recombination. Mol Cell Biol. 1996;16(1):258–269. [DOI] [PMC free article] [PubMed] [Google Scholar]
- 24.Teng G, Papavasiliou FN. Immunoglobulin somatic hypermutation. Annu Rev Genet. 2007;41:107–120. [DOI] [PubMed] [Google Scholar]
- 25.Matthews AJ, Zheng S, DiMenna LJ, Chaudhuri J. Regulation of immunoglobulin class-switch recombination: choreography of noncoding transcription, targeted DNA deamination, and long-range DNA repair. Adv Immunol. 2014;122:1–57. [DOI] [PMC free article] [PubMed] [Google Scholar]
- 26.Arstila TP, Casrouge A, Baron V, Even J, Kanellopoulos J, Kourilsky P. A direct estimate of the human alphabeta T cell receptor diversity. Science. 1999;286(5441):958–961. [DOI] [PubMed] [Google Scholar]
- 27.Bretschneider I, Clemente MJ, Meisel C, et al. Discrimination of T-cell subsets and T-cell receptor repertoire distribution. Immunol Res. 2014;58(1):20–27. [DOI] [PubMed] [Google Scholar]
- 28.Araki K, Youngblood B, Ahmed R. The role of mTOR in memory CD8 T-cell differentiation. Immunol Rev. 2010;235(1):234–243. [DOI] [PMC free article] [PubMed] [Google Scholar]
- 29.Appay V, van Lier RA, Sallusto F, Roederer M. Phenotype and function of human T lymphocyte subsets: consensus and issues. Cytometry A. 2008;73(11):975–983. [DOI] [PubMed] [Google Scholar]
- 30.Farber DL, Yudanin NA, Restifo NP. Human memory T cells: generation, compartmentalization and homeostasis. Nat Rev Immunol. 2014;14(1):24–35. [DOI] [PMC free article] [PubMed] [Google Scholar]
- 31.World Medical Association. World Medical Association Declaration of Helsinki: ethical principles for medical research involving human subjects. JAMA. 2013;310(20):2191–2194. [DOI] [PubMed] [Google Scholar]
- 32.International Agranulocytosis and Aplastic Anaemia Study. Incidence of aplastic anemia: the relevance of diagnostic criteria. By the International Agranulocytosis and Aplastic Anemia Study. Blood. 1987;70(6):1718–1721. [PubMed] [Google Scholar]
- 33.Camitta BM, Thomas ED, Nathan DG, et al. Severe aplastic anemia: a prospective study of the effect of early marrow transplantation on acute mortality. Blood. 1976;48(1):63–70. [PubMed] [Google Scholar]
- 34.Bolotin DA, Shugay M, Mamedov IZ, et al. MiTCR: software for T-cell receptor sequencing data analysis. Nat Methods. 2013;10(9):813–814. [DOI] [PubMed] [Google Scholar]
- 35.Benjamini Y, Yekutieli D. The control of the false discovery rate in multiple testing under dependency. Ann Stat. 2001; 29:(4)1165–1188. [Google Scholar]
- 36.Strioga M, Pasukoniene V, Characiejus D. CD8+ CD28− and CD8+ CD57+ T cells and their role in health and disease. Immunology. 2011;134(1):17–32. [DOI] [PMC free article] [PubMed] [Google Scholar]
- 37.Nickel RS, Horan JT, Fasano RM, et al. Immunophenotypic parameters and RBC alloimmunization in children with sickle cell disease on chronic transfusion. Am J Hematol. 2015;90(12):1135–1141. [DOI] [PubMed] [Google Scholar]
- 38.Hill MO. Diversity and evenness: a unifying notation and its consequences. Ecology. 1973;54:(2)427–432. [Google Scholar]
- 39.Li H, Ye C, Ji G, Han J. Determinants of public T cell responses. Cell Res. 2012;22(1):33–42. [DOI] [PMC free article] [PubMed] [Google Scholar]
- 40.Gargiulo L, Lastraioli S, Cerruti G, et al. Highly homologous T-cell receptor beta sequences support a common target for autoreactive T cells in most patients with paroxysmal nocturnal hemoglobinuria. Blood. 2007;109(11):5036–5042. [DOI] [PubMed] [Google Scholar]
- 41.Risitano AM, Kook H, Zeng W, Chen G, Young NS, Maciejewski JP. Oligoclonal and polyclonal CD4 and CD8 lymphocytes in aplastic anemia and paroxysmal nocturnal hemoglobinuria measured by V beta CDR3 spectratyping and flow cytometry. Blood. 2002;100(1):178–183. [DOI] [PubMed] [Google Scholar]
- 42.Filaci G, Fenoglio D, Fravega M, et al. CD8+ CD28− T regulatory lymphocytes inhibiting T cell proliferative and cytotoxic functions infiltrate human cancers. J Immunol. 2007; 179:(7)4323–4334. [DOI] [PubMed] [Google Scholar]
- 43.Characiejus D, Pasukoniene V, Jonusauskaite R, et al. Peripheral blood CD8high CD57+ lymphocyte levels may predict outcome in melanoma patients treated with adjuvant interferon-alpha. Anticancer Res. 2008;28:(2B)1139–1142. [PubMed] [Google Scholar]
- 44.Kook H, Zeng W, Guibin C, Kirby M, Young NS, Maciejewski JP. Increased cytotoxic T cells with effector phenotype in aplastic anemia and myelodysplasia. Exp Hematol. 2001;29:(11)1270–1277. [DOI] [PubMed] [Google Scholar]
- 45.Boucher N, Dufeu-Duchesne T, Vicaut E, Farge D, Effros RB, Schächter F. CD28 expression in T cell aging and human longevity. Exp Gerontol. 1998;33(3):267–282. [DOI] [PubMed] [Google Scholar]
- 46.Wikby A, Ferguson F, Forsey R, et al. An immune risk phenotype, cognitive impairment, and survival in very late life: impact of allostatic load in Swedish octogenarian and nonagenarian humans. J Gerontol A Biol Sci Med Sci. 2005;60(5):556–565. [DOI] [PubMed] [Google Scholar]
- 47.Fozza C, Barraqueddu F, Corda G, et al. Study of the T-cell receptor repertoire by CDR3 spectratyping. J Immunol Methods. 2017;440:1–11. [DOI] [PubMed] [Google Scholar]
- 48.Zeng W, Maciejewski JP, Chen G, Young NS. Limited heterogeneity of T cell receptor BV usage in aplastic anemia. J Clin Invest. 2001;108(5):765–773. [DOI] [PMC free article] [PubMed] [Google Scholar]
- 49.Le Gal FA, Ayyoub M, Dutoit V, et al. Distinct structural TCR repertoires in naturally occurring versus vaccine-induced CD8+ T-cell responses to the tumor-specific antigen NY-ESO-1. J Immunother. 2005;28(3):252–257. [DOI] [PubMed] [Google Scholar]
Associated Data
This section collects any data citations, data availability statements, or supplementary materials included in this article.


