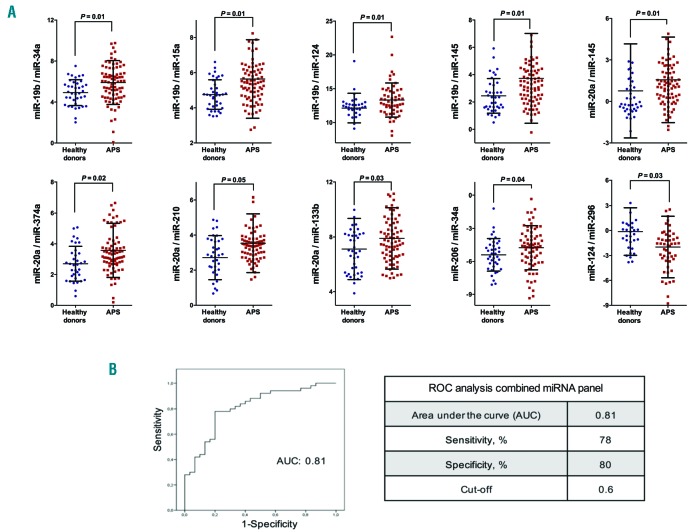
Figure 3.
A circulating miRNA signature in antiphospholipid syndrome (APS) might have potential value as biomarkers of disease. (A) Selected microRNAs (miRNAs or miR) were analyzed in the whole cohort, including 90 APS patients and 42 healthy donors, and reciprocal ratios were performed. Beeswarm plot of each differentially expressed miR ratio is shown, along with mean, Standard Deviation, and P-value. For statistical analysis, after normality and equality of variance tests, comparisons were made by paired Student t-test or a non-parametric test (Mann-Whitney rank sum test). (B) A combination of the 10 miRNA ratios as a panel was carried out by using logistic regression on the data set. ROC curve of miRNA panel and cut off were generated based on the predicted probability (P) for each subject as a single score. The equation used in our model was: “Combined miRNA-ratio panel [Logit(p)] = − 0.64 + 0.034x(miR-19b/miR-34a) + 1.061x(miR-19b/miR-15a) + 0.248x(miR-19b/miR-124) − 1.704x(miR-19b/miR-145) + 2.34x(miR-20a/miR-145) − 0.729x(miR-20a/miR-374a) − 0.624x(miR-20a/miR-210) + 0.088x(miR- 20a/miR-133b) + 0.166x(miR-206/miR-34a) + 0.056x(mir-124/miR-296)”. The area under the curve (AUC), sensitivity and specificity are displayed, and a cut-off value with higher specificity was selected.

