Abstract
Background:
One of the challenges of PET/MRI combined systems is to derive an attenuation map to correct the PET image. For that, the pseudo-CT image could be used to correct the attenuation. Until now, most existing scientific researches construct this pseudo-CT image using the registration techniques. However, these techniques suffer from the local minima of the non-rigid deformation energy function which leads to unsatisfactory results.
Objective:
We propose in this paper a new approach for the generation of a pseudo-CT image from an MR image.
Materials and Methods:
This approach is based on a dense stereo matching concept, for that, we encode each pixel according to a shape related coordinates method, and we apply a local texture descriptor to put into correspondence pixels between MRI patient and MRI atlas images. The proposed approach was tested on a real MRI data, and in order to show the effectiveness of the proposed local descriptor, it has been compared to three other local descriptors: SIFT, SURF and DAISY. Also it was compared to registration method.
Results:
The calculation of structural similarity (SSIM) index and DICE coefficients, between the pseudo-CT image and the corresponding real CT image show that the proposed stereo matching approach outperforms a registration one.
Conclusion:
The use of dense matching with atlas promises good results in the creation of pseudo-CT. The proposed approach can be recommended as an alternative to registration techniques.
Keywords: Pseudo-CT , Attenuation Correction , Stereo Matching , Local Texture Descriptor for Matching , PET/MRI
Introduction
Attenuation correction (AC) is an important step in the analysis of PET images. In current PET/CT systems, the attenuation coefficients are calculated directly from CT images; this one provides a good separation between the bone and other tissues, but unfortunately the patient’s body is exposed to additional radiation. PET/MRI systems do not have that drawback, but they cannot distinguish between some tissues, since bone and air show the same signal on MR images. In addition, magnetic resonance imaging (MRI) cannot precisely define the attenuation coefficients of tissues [1].
Atlas-based methods are mostly used for estimating pseudo-CT using conventional MRI sequences. However, these techniques suffer from the local minima of the non-rigid deformation energy function leading to unsatisfactory results, and there is a non-negligible discrepancy in terms of quality of matching between non-rigid registrations techniques [2]. To overcome these issues, a new prediction of pseudo-CT images from a given MR image is proposed in this paper. This approach is based on a stereo matching of pairs of patient’s MRI and MRI atlas images.
After discussing related work, we introduce in section 2, our new dense stereo matching approach based on the shape related coordinates method to encode pixels, and on a local texture descriptor to put pixels into correspondence. In next sections, we describe other descriptors and the data set used in this work. Then, we present a quantitative and qualitative evaluation of our approach.
In order to obtain attenuation correction (AC) maps from MRI for PET/MRI systems, many studies have been reported. In general, there are two main methods to correct the attenuation: the segmentation-based methods and the atlas-based methods.
In segmentation-based methods, MRIs are divided into three classes (bone, soft tissue and air) after that, the attenuation coefficients at 511 kev corresponding to the biological tissues of each class, are assigned to the voxels belonging to that class. Unlike atlas-based methods, the main advantage of this method is its ability to give an interesting result even if there were anatomical differences between subjects (patients). However, the most challenging issue in this particular context is that direct bone segmentation, using MR image intensities, is a very difficult task [3]. A particular pulse sequence such as the ultra-short echo time (UTE) has been proposed recently in order to distinguish between bones and air cavities [4,5]. These authors have obtained an interesting result; nevertheless, they show that the classification of the bone using UTE is still subject to an over- or under-segmentation of bony structures. Some recent studies have exploited the information contained in PET emission data as well as the anatomical information from MRI, to estimate the attenuation maps. They have been mainly suggested to use the information from the time of flight (TOF) [6,7]. In general, we can conclude that the segmentation methods have the disadvantage of just providing discrete AC maps.
In atlas-based methods, the used atlas is a set of MRI/CT or MRI/PET images of the same subject. These methods consist of registering the MRI images atlas to MR image of the patient for whom the attenuation map must be derived. The resulting spatial transformations are then applied to all corresponding images in the CT atlas. Thereafter, a pseudo-CT image is generated, where each voxel is obtained as an average of the intensities of the registered CT atlas images. The pseudo-CT is then used for the correction of attenuation. These methods have the advantage of providing continuous values in addition to robustness, because they are less affected by the acquisition artefacts such as movement. However, the disadvantage of these methods is the possibility of making an erroneous representation of different pathological anatomical regions of the atlas image [8].
The first atlas approaches used PET template as the atlas [9,10]. Hofmann and Al [1] were the first to have developed an atlas approach with CT images, they proposed to combine the atlas approach and pattern recognition, consequently, for each voxel in the image of the patient, a pseudo-CT value based on the nearest voxels of images in the atlas database, is predicted using a Gaussian process regression. This one is considered as the first original approach which offers a significant improvement of the simple registration methods. Schreibmann [11] proposed an alternative method for constructing a pseudo-CT; however, they obtain significant errors on bone structures in the sinus area which presents great anatomical variability. Subsequently, several research works have been conducted in order to improve the quality of pseudo-CT, and to avoid local registration errors. The authors in [12] have recently proposed an improved Hofmann’s method for generating a pseudo-CT in the case of the study of whole body images. In [13], the authors developed a pseudo-CT from the fusion of special sequences of MRI, UTE and FLASH, but they did not give a quantitative evaluation of their approach. In [14], the authors proposed a fast pseudo-CT volume generation, using a group-wise patch-based approach, along with an MRI-CT atlas dictionary, for each voxel of the input MR image, the similarity between the patch containing that voxel and the patches of all MRI images existing in the database is calculated. The pseudo-CT image is obtained as a weighted linear combination of CT values. We notice that this method does not use the atlas-based registration technique, the problem of homogeneity of intensities in MR images penalizes that technique, because it is based on the use of pixel patches. More recent studies have used multi-atlas methods to improve the quality of pseudo-CT images, these methods are based on the fusion of results obtained by the registration of several atlases [15,16].
Image-registration methods often do not yield satisfactory results, because of local minima of the no-rigid deformation energy function [1]. To overcome this issue, we propose in this study, a new approach to create a pseudo-CT, it is based on a stereo correspondence concept in order to provide an increased robustness to handle the prediction local defects in registration.
Material and Methods
Principle of the Approach
Our proposed approach uses an atlas without registration. It is based on a stereo correspondence concept to find each corresponding pairs of pixels. Stereo matching methods are widely used in digital image processing field, we can cite for example image alignment, object recognition, remote sensing, motion tracking, indexing and content-based search [17-21]. A proposed method consists of finding the points of interest (salient points or vertices) in both images, each point is indicated by a vector (local descriptor), and an algorithm is used to find the corresponding pairs of points from the two images.
Compared with other types of imaging, images in MRI, CT or PET have got two specific properties: the first one is that these images can be in the same space (space of coordinates), and the second one is that their content sizes are approximately equal (Figure 1). These properties allow us to reduce the field of correspondence search to a local one, which is only around the position of the point of interest, and not in the entire image. Thus, our approach is based on the assumption that the pixel and its homologous (called corresponding point) are located roughly at two similar positions with the same spatial coordinates. So, grateful to this local search specificity and the local descriptor (the vector used to describe the pixel), it is possible to match each pixel of the first image to one pixel of the second image.
Figure1.
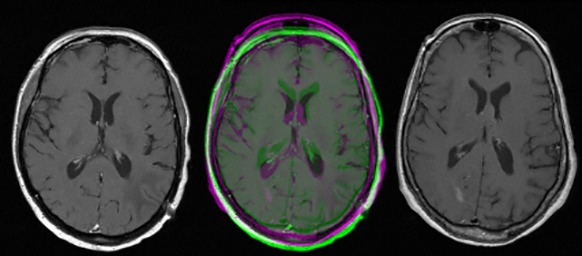
Left: MR image of patient 1, right: MR image of patient 2, middle: the two images juxtaposed.
If this approach is used with an atlas (MR images + CT images), it becomes possible to create a pseudo-CT image from an MR image of a patient. The proposed method uses a local correspondence search process with an atlas, in order to spread the intensities of the atlas to the relevant MR image.
In the remainder of this article, we use the following notations:
AMR: Atlas Magnetic resonance image
ACT: Atlas CT image
PMR: Patient magnetic resonance image
PPC: Patient pseudo-CT image
A local descriptor should be calculated for all pixels of both images PMR and AMR.Take a pixel p in image PMR, defined by the descriptor vector V. Consider a search window of pixels [q1...qk] in the image AMR of the atlas. These pixels are defined by the descriptor vectors [W1...Wk]. This search window is around the same position of pixel p. Consider a pixel q in the search window, and defined by the vector W. This pixel corresponds to pixel p, when it meets the following formula (1):
W = arg min (Dist (V, [W1...Wk])) (1)
A look-up table is built by calculating the matches for all pixels in image PMR. This table is used with the CT image atlas ACT to build the pseudo-CT PPC. The intensity values in PPC are deduced using the formula (2):
(2)
Shape-related Coordinates (SRC)
In the remainder of the article, the shape is the organ shown in the image. A new concept for encoding pixel positions in an image is defined in the present work. The principle is to encode the coordinates of a pixel within the shape, with the objective to have a relative position at the centre of the shape. This centre is the point from which a circle can be drawn around that shape. In the present article, this concept concerns images of the head.
Consider a pixel p with the coordinate (X,Y). The new shape-related coordinates (XSRC,YSRC) are calculated (eq.3):
Where (X0,Y0>) are the coordinates of the centre of the shape, LH is the distance from the centre of the shape to the horizontal boundary of the shape, and LV is the distance from the centre to the vertical boundary of the shape (Figure 2).
Figure2.
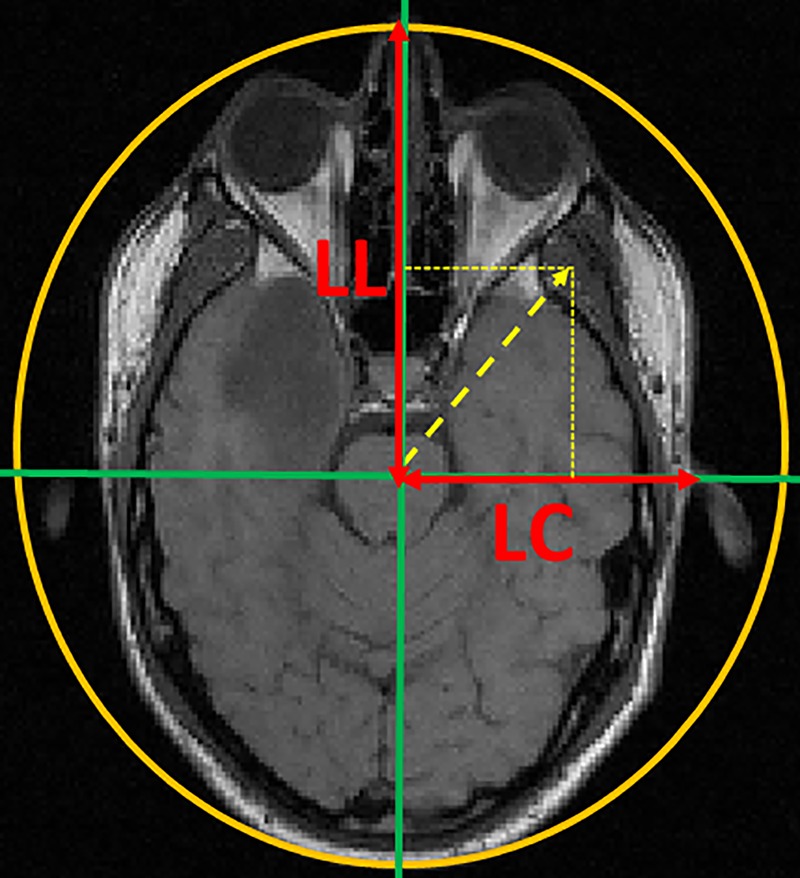
The principle of shape-related coordinates
Figure 3 shows a set of pixels in MR images of two subjects, each pixel in the first image is connected to the pixel in the other image which has the same SRC coordinates. We note that the pixels that are in the same anatomical areas in the two images are connected, although the differences in the size and shape of the two heads. This encoding method (SRC) allows a first mapping between two images.
Figure3.
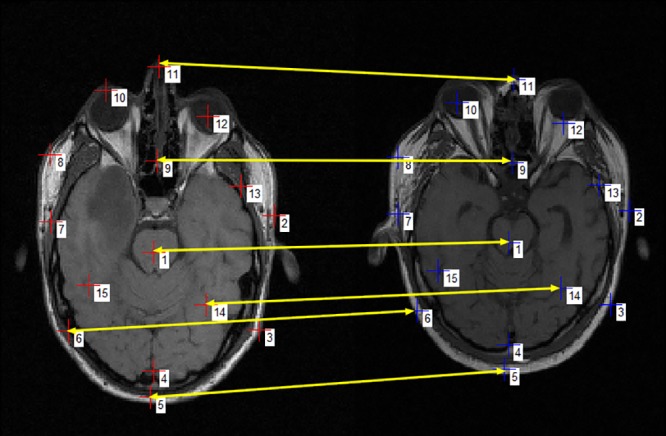
Matches between points with the same shape-related coordinates
To find the exact matching of a pixel in the left image, just search around the pixel (with the same SRC coordinates) in the other right image. SRC method reduces the search field at the nearest neighbourhood, which promises a better match. The use of SRC allows us to achieve a guided local search.
Local Texture Descriptor for Matching (LTEMA)
Several local descriptors have been developed to put into correspondence pairs of images. A descriptor is used to identify each pixel in the image; it defines and distinguishes the pixels in the local neighbourhood. We use LTEMA descriptor in our proposed approach.
In magnetic resonance imaging (MRI), bone and air produce no signal, so additional information is needed to distinguish the two classes, i.e. bone and air. For that, we propose to use a texture analysis like LTEMA to define a set of measurements. We will show in the following that it allows an interesting performance.
We notice that the property of texture as an important characteristic for image analysis has been proved by a large majority of researchers. In [22], the authors noted that some texture features are very robust to changes in MRI acquisition settings, invariant to changes in image resolution, and unaffected by the corruption of the MRI image by magnetic field inhomogeneity. Moreover in [23], the authors concluded that the texture features extracted from MR images (sequence T1) from different MRI devices are statistically very similar for the same type of tissue.
Therefore, the texture properties should be used instead of the values of the neighbourhood. Since we have to calculate a descriptor for each pixel in the image, we have chosen to use measurements easy to calculate. First order textural properties are selected; these are statistics that are calculated from the pixel values such as variance; they do not include neighbourhood relations among the pixels. Our method uses three texture measurements:
-
Mean: it is a measure of the brightness of pixel Pr,s located at position (r,s).
(4)
-
Standard deviation: it is a measure of contrast
(5)
-
Entropy: it is a statistical measure of randomness
(6)
Where p(b) = N(b)/n2for {0 ≤ b ≤ L-1}, where L is the number of different values which pixels can adopt, N(b) is the number of pixels of amplitude b in the pixel window of size (n × n).
To extract the most significant features of MR images, the textural properties (mean, standard deviation and entropy) are calculated from different neighbourhood window sizes. For the neighbourhood of a pixel in MR images, eight windows were selected, and the pixel is a corner, beside two windows centred on the pixel as shown in Figure 4. The normalized vector contains a total of 30 characteristics (3 measurements * 10 windows).
Figure4.
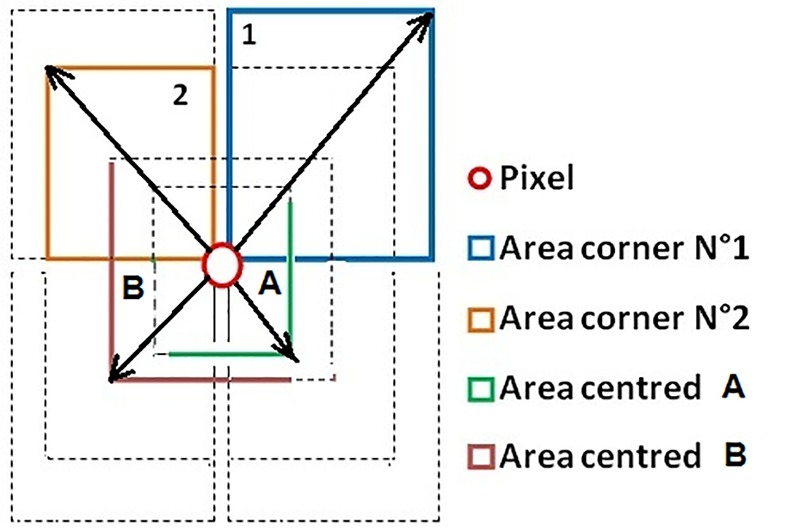
Distribution of used neighbourhood in LTEMA
In MR images, we faced a problem of the signal heterogeneity. Indeed, similar tissues do not give the same signal intensity, and each tissue does not have the same intensity. Our descriptor contains two types of data which were used to describe the pixel with the minimum of confusion. The first data include the information of close neighbourhood (windows centred on the pixel, with sizes 3 * 3 and 5 * 5), and the second are the information on the distant neighbourhood (windows of corners, with sizes 10 * 10 and 12 * 12). We mention that these values are obtained from a set of tests intended to determine the optimum values; the objective is to introduce one descriptor able to describe a pixel in both near and distant neighbourhoods. Therefore, if there is confusion with the close data (which is often the case with the problem of heterogeneity in MR images), the information in the distant description may help to eliminate that confusion. This descriptor was used for the segmentation of bone structures in a previous study [24].
Several local descriptors have been developed in a stereo matching process and some descriptors were tested in order to define the pixels in MR images. In this section, the chosen descriptors in this paper are introduced in the following:
─ SIFT (Scale-Invariant Feature Transform): it is one of the oldest local descriptors, it uses a vector having 128 dimensions to describe a point [25].
─ SURF (Speeded-Up Robust Features): this local descriptor is similar to SIFT. The main advantage of SURF over SIFT is its processing speed, because SURF uses a vector having only 64 dimensions [26].
─ DAISY is a new local descriptor, it is inspired from previous descriptors, and it can be calculated more efficiently in a dense matching case. Its fast computational time results from the replacement of the weighted sums, used by previous descriptors, by the sum of convolutions [27].
Main Steps of the Approach
Algorithm: Construction of a pseudo-CT
-
Input:
AMR: MR Image atlas
ACT: CT Image atlas
PMR: MR Image patient
k: number of neighborhood search
-
Output:
PPC: pseudo-CT image
Start:
L = length of PMR
C = width of PMR
Calculate the shape-related coordinates of all pixels in the image PMR
Calculate the shape-related coordinates of all pixels in the image AMR
Calculate descriptors [V1,1...VL,C] of all pixels in the image PMR
Calculate descriptors [W1,1...WL,C] of all pixels in the image AMR
% Access to all pixels using shape-related coordinates% Access to all pixels using shape-related coordinates
-
For x = 1 to L
For y = 1 to C
D = [] % initialization of table distances between descriptor vectors
% browse a neighbourhood in e AMR
-
For i = (x - k) to (x + k)
For j = (y-k) to (y + k)
D[i,j] = distance (Vx,y,Wi,j) % calculate the distance
End for
End for
[x’,y’]=Min (D) % Select the candidate P(x’,y’) with minimum distance
Pseudo CT [x, y] = Act [x’, y’]
End for
End for
% A median filter is applied to the resulting image to harmonize intensities.
Median_Filter (PseudoCT)
End.
Results
Data Set
Our method was applied on MRI data of a patient’s brain. These data are obtained from the Vanderbilt database, called the Retrospective Image Registration Evaluation Project (RIRE). These datasets are now available as open-access data [28]. In this database, T1-weighted MR data were obtained using a Magnetization Prepared Rapid Gradient Echo (MP-RAGE) sequence. This is a quick gradient-echo technique in which a preparation pulse is applied before the acquisition sequence to enhance contrast. The MR data dimensions were 256 x 256 x 128 with an average resolution of 0.98mm x 0.99mm x 1.484mm. The corresponding CT scans had a 3mm slice thickness with slice dimensions 512 x 512 with an average resolution of 0.419mm x 0.419mm, the number of slices for each volume varied between 42 and 49.
Performance Assessment Metrics
The index of Structural Similarity (SSIM) is used as an evaluation measurement. SSIM measures the similarity between two images. It has been shown that SSIM is better suited than the traditional methods such as MSE and PSNR [29].
Dice similarity index (DSI) was also used to measure the quality of predictions of the three major classes of tissue, namely bone, voids and other tissues. DICE aims to quantify the intersection of our results with the ground truth masks [30]. The Dice similarity index is calculated as follows (eq7):
(7)
Where MA is the result mask, and MB is the ground truth mask.
Note that the truth mask is obtained by thresholding the real CT images, and the result mask is obtained by thresholding the pseudo-CT images. Tissue classes were obtained by thresholding CT images and pseudo-CT (HU = Hounsfield units) [31]:
- Air: < -500 HU
- Soft tissue: [-500; 300] HU
- Bone: > 300 HU
Qualitative and Quantitative Results
It should be noted that the proposed method is evaluated without the need for a pre-processing step. First to construct our atlas, CT images were registered to the corresponding MR images using SPM [32]. Secondly, several correspondence search windows were tested to adjust the proposed method. In our database, the value k = 7 was found as the optimum value, i.e. a neighbourhood window of 14 * 14 pixels. This value was used in the following tests, and the different descriptors were tested for the construction of pseudo-CT images.
Our approach proposes a new way for the atlas use and has been compared to a registration method. To check the quality of our proposed approach compared to other registration methods, Elastix was used as a registration tool [33]. As all classical methods based on atlas use for creating pseudo-CT, a rigid transformation was applied followed by a non-rigid transformation for the registration of the patient’s MRI image with the MRI atlas image, then these same transformations were applied to CT Atlas image in order to have a pseudo-CT by registration. The average values of SSIM and DICE calculated for all data are presented in Table 1. Figure 5 shows the qualitative results.
Table 1.
Test results on all data
| REGISTRATION | LTEMA | SIFT | SURF | DAISY | |
|---|---|---|---|---|---|
| SSIM | 0.685 | 0.721 | 0.708 | 0.608 | 0.606 |
| DICE AIR | 0.320 | 0.400 | 0.230 | 0.072 | 0.063 |
| DICE SOFT | 0.932 | 0.937 | 0.928 | 0.867 | 0.863 |
| DICE BONE | 0.760 | 0.774 | 0.752 | 0.360 | 0.202 |
Figure5.
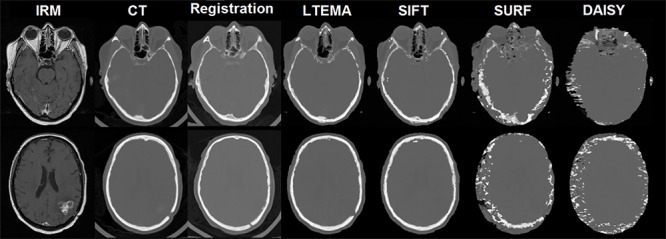
Test of different descriptors. From left to right: MRI patient image, corresponding real patient CT image, pseudo CT image by registration method, pseudo-CT image by the proposed method, with the descriptors LTEMA ,SIFT, SURF, and DAISY.
Discussion
A quantitative and qualitative evaluation of our approach is presented in this article. We notice that the intensities of the pseudo-CT images obtained (the results) are computed with continuous values (Hounsfield unit). A proposed approach shows that the use of a stereo correspondence technique with an atlas is much better than the classical registration approach (Table 1), the choice of the appropriate descriptor is also required. Compared to other descriptors, our proposed LTEMA descriptor gives the best results, it allows the best identification of bone structures and voids.
In addition, LTEMA descriptor allows a good discrimination in local search matches. SIFT comes in the second position. However, SURF and DAISY descriptors give the poorest results because they are not discriminating in non-salient regions (lines and texture regions). The bad results of SURF are due to its reduced dimensions compared to SIFT. Unlike SURF, DAISY is a descriptor designed for a dense matching case but it does not seem suitable for MR images. DAISY descriptor is probably penalized by the nature of intensities in MR images. From Figure 5, it can be seen that our descriptor LTEMA is better suitable for a dense stereo matching in MR images.
In Figure 6, we notice the differences in bone thickness between the actual CT image and the Pseudo-CT resulting from registration and from the descriptor LTEMA. When the registration technique changes the shape of the atlas to conform to the shape of the patient’s image, without taking into account the local difference between the two images, our method with LTEMA descriptor can recognize that difference, because it compares the values of all pixels. This leads to a better estimation of the thickness of bony structures.
Figure6.
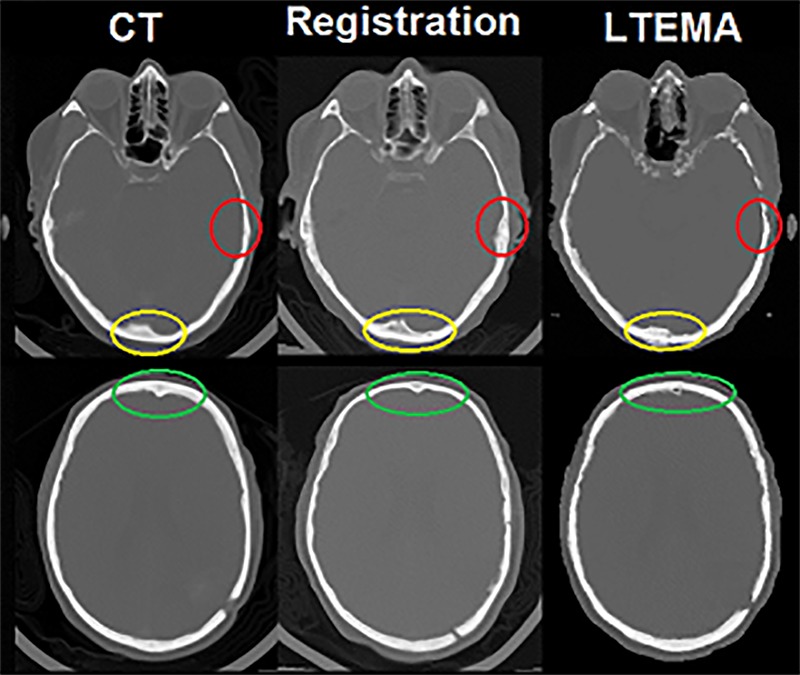
Difference in quality of pseudo-CT images. From left to right: real CT image, Pseudo-CT image by registration method, pseudo-CT image with LTEMA descriptor.
The purpose of the construction of a pseudo-CT is not only in its visual aspect, but in its use for CA. The best results were obtained in the images of the upper part of the skull, the average DICE value of bone structures is 0.774. It should be noted that the quality of the results depends on the atlas images used.
Conclusion
In this paper, a new approach is proposed to generate a pseudo-CT from an MRI image. It is a new way to use an atlas in medical image processing without the need of a registration step and pre-processing step. It has been demonstrated that it is possible to find correspondences between two MR images, pixel by pixel. Using an atlas (MRI images + CT images), it is possible to create a pseudo-CT with Hounsfield intensities. This pseudo-CT can be used for the attenuation correction in PET images.
This approach is distinguished by two main contributions. The first is SRC, a new concept for encoding pixel positions in a medical image, and the second contribution is LTEMA, the local descriptor based on texture properties. Obtained results with LTEMA are better than a registration method and other descriptors. The use of dense matching with atlas promises good results; however, we must choose the appropriate local descriptor for this task.
We can also deduce that with the use of an appropriate atlas, the proposed approach can be recommended in the segmentation of medical images as an alternative to registration techniques.
Acknowledgement
This work is supported by Lab. LITIO, University of Oran 1 Ahmed Ben Bella- Algeria.
Conflict of Interest:None.
References
- 1.Hofmann M, Steinke F, Scheel V, Charpiat G, Farquhar J, Aschoff P, et al. MRI-based attenuation correction for PET/MRI: a novel approach combining pattern recognition and atlas registration. J Nucl Med. 2008;49:1875–83. doi: 10.2967/jnumed.107.049353. [DOI] [PubMed] [Google Scholar]
- 2.Rousseau F, Habas PA, Studholme C. A supervised patch-based approach for human brain labeling. IEEE Trans Med Imaging. 2011;30:1852–62. doi: 10.1109/TMI.2011.2156806. [ PMC Free Article] [DOI] [PMC free article] [PubMed] [Google Scholar]
- 3.Ay MR, Akbarzadeh A, Ahmadian A, Zaidi H. Classification of bones from MR images in torso PET-MR imaging using a statistical shape model. Nuclear Instruments and Methods in Physics Research Section A: Accelerators, Spectrometers, Detectors and Associated Equipment. 2014;734:196–200. doi: 10.1016/j.nima.2013.09.007. [DOI] [Google Scholar]
- 4.Keereman V, Fierens Y, Broux T, De Deene Y, Lonneux M, Vandenberghe S. MRI-based attenuation correction for PET/MRI using ultrashort echo time sequences. J Nucl Med. 2010;51:812–8. doi: 10.2967/jnumed.109.065425. [DOI] [PubMed] [Google Scholar]
- 5.Ribeiro AS, Kops ER, Herzog H, Almeida P. Skull segmentation of UTE MR images by probabilistic neural network for attenuation correction in PET/MR. Nuclear Instruments and Methods in Physics Research Section A: Accelerators, Spectrometers, Detectors and Associated Equipment. 2013;702:114–6. doi: 10.1016/j.nima.2012.09.005. [DOI] [Google Scholar]
- 6.Mollet P, Keereman V, Clementel E, Vandenberghe S. Simultaneous MR-compatible emission and transmission imaging for PET using time-of-flight information. IEEE Trans Med Imaging. 2012;31:1734–42. doi: 10.1109/TMI.2012.2198831. [DOI] [PubMed] [Google Scholar]
- 7.Mehranian A, Zaidi H. Joint Estimation of Activity and Attenuation in Whole-Body TOF PET/MRI Using Constrained Gaussian Mixture Models. IEEE Trans Med Imaging. 2015;34:1808–21. doi: 10.1109/TMI.2015.2409157. [DOI] [PubMed] [Google Scholar]
- 8.Ribeiro AS, Kops ER, Herzog H, Almeida P. Hybrid approach for attenuation correction in PET/MR scanners. Nuclear Instruments and Methods in Physics Research Section A: Accelerators, Spectrometers, Detectors and Associated Equipment. 2014;734:166–70. doi: 10.1016/j.nima.2013.09.034. [DOI] [Google Scholar]
- 9.Kops ER, Herzog H, editors . Alternative methods for attenuation correction for PET images in MR-PET scanners. 22 January 2008. Honolulu: Nuclear Science Symposium Conference Record, 2007 NSS'07 IEEE; 2007. [Google Scholar]
- 10.Kops ER, Herzog H, editors . Template based attenuation correction for PET in MR-PET scanners. 2008 IEEE Nuclear Science Symposium Conference Record. IEEE: 2008. [Google Scholar]
- 11.Schreibmann E, Nye JA, Schuster DM, Martin DR, Votaw J, Fox T. MR-based attenuation correction for hybrid PET-MR brain imaging systems using deformable image registration. Med Phys. 2010;37:2101–9. doi: 10.1118/1.3377774. [DOI] [PubMed] [Google Scholar]
- 12.Arabi H, Zaidi H. Magnetic resonance imaging-guided attenuation correction in whole-body PET/MRI using a sorted atlas approach. Med Image Anal. 2016;31:1–15. doi: 10.1016/j.media.2016.02.002. [DOI] [PubMed] [Google Scholar]
- 13.Hirsch M, Hofmann M, Mantlik F, Pichler BJ, Schölkopf B, Habeck M, editors . A blind deconvolution approach for pseudo CT prediction from MR image pairs. 2012 19th IEEE International Conference on Image Processing. IEEE: 2012. [Google Scholar]
- 14.Torrado-Carvajal A, Herraiz JL, Alcain E, Montemayor AS, Garcia-Canamaque L, Hernandez-Tamames JA, et al. Fast Patch-Based Pseudo-CT Synthesis from T1-Weighted MR Images for PET/MR Attenuation Correction in Brain Studies. J Nucl Med. 2016;57:136–43. doi: 10.2967/jnumed.115.156299. [DOI] [PubMed] [Google Scholar]
- 15.Burgos N, Cardoso MJ, Thielemans K, Modat M, Pedemonte S, Dickson J, et al. Attenuation correction synthesis for hybrid PET-MR scanners: application to brain studies. IEEE Trans Med Imaging. 2014;33:2332–41. doi: 10.1109/TMI.2014.2340135. [DOI] [PubMed] [Google Scholar]
- 16.Mérida I, Costes N, Heckemann RA, Drzezga A, Förster S, Hammers A, editors . Evaluation of several multi-atlas methods for PSEUDO-CT generation in brain MRI-PET attenuation correction. 2015 IEEE 12th International Symposium on Biomedical Imaging (ISBI) IEEE: 2015. [Google Scholar]
- 17.Gui Y, Su A, Du J. Point-pattern matching method using SURF and Shape Context. Optik-International Journal for Light and Electron Optics. 2013;124:1869–73. doi: 10.1016/j.ijleo.2012.05.037. [DOI] [Google Scholar]
- 18.Toews M, Wells WM. Efficient and robust model-to-image alignment using 3D scale-invariant features. Med Image Anal. 2013;17:271–82. doi: 10.1016/j.media.2012.11.002. [ PMC Free Article] [DOI] [PMC free article] [PubMed] [Google Scholar]
- 19.Vinay A, Hebbar D, Shekhar VS, Murthy KB, Natarajan S. Two Novel Detector-Descriptor Based Approaches for Face Recognition Using SIFT and SURF. Procedia Computer Science. 2015;70:185–97. doi: 10.1016/j.procs.2015.10.070. [DOI] [Google Scholar]
- 20.Miao Q, Wang G, Shi C, Lin X, Ruan Z. A new framework for on-line object tracking based on SURF. Pattern Recognition Letters. 2011;32:1564–71. doi: 10.1016/j.patrec.2011.05.017. [DOI] [Google Scholar]
- 21.Zigh E, Belbachir MF. Soft computing strategy for stereo matching of multi spectral urban very high resolution IKONOS images. Applied soft computing. 2012;12:2156–67. doi: 10.1016/j.asoc.2012.02.014. [DOI] [Google Scholar]
- 22.Juntu J, Sijbers J, De Backer S, Rajan J, Van Dyck D. Machine learning study of several classifiers trained with texture analysis features to differentiate benign from malignant soft-tissue tumors in T1-MRI images. J Magn Reson Imaging. 2010;31:680–9. doi: 10.1002/jmri.22095. [DOI] [PubMed] [Google Scholar]
- 23.Mayerhoefer ME, Breitenseher MJ, Kramer J, Aigner N, Hofmann S, Materka A. Texture analysis for tissue discrimination on T1-weighted MR images of the knee joint in a multicenter study: Transferability of texture features and comparison of feature selection methods and classifiers. J Magn Reson Imaging. 2005;22:674–80. doi: 10.1002/jmri.20429. [DOI] [PubMed] [Google Scholar]
- 24.Chaibi H, Nourine R. Skull Segmentation of MR images based on texture features for attenuation correction in PET/MR. 2nd International Conference on Signal, Image, Vision and their Applications (SIVA’13): Guelma, Algeria; 2013. [Google Scholar]
- 25.Lowe DG. Distinctive image features from scale-invariant keypoints. International journal of computer vision. 2004;60:91–110. doi: 10.1023/B:VISI.0000029664.99615.94. [DOI] [Google Scholar]
- 26.Valenzuela REG, Schwartz WR, Pedrini H, editors . Dimensionality reduction through PCA over SIFT and SURF descriptors. 23-24 Aug. 2012. Limerick: Cybernetic Intelligent Systems (CIS), 2012 IEEE 11th International Conference on; 2012. [Google Scholar]
- 27.Tola E, Lepetit V, Fua P, editors . A fast local descriptor for dense matching. 23-28 June 2008. Anchorage: Computer Vision and Pattern Recognition, 2008. CVPR 2008. IEEE Conference on: 2008. [Google Scholar]
- 28. In: The Retrospective Image Registration Evaluation Project. The Retrospective Image Registration Evaluation Project, Version 2.0. [cited April 2013] . Available from: [http://www.insight-journal.org/rire/ ]
- 29.Wang Z, Bovik AC, Sheikh HR, Simoncelli EP. Image quality assessment: from error visibility to structural similarity. IEEE Trans Image Process. 2004;13:600–12. doi: 10.1109/TIP.2003.819861. [DOI] [PubMed] [Google Scholar]
- 30.Balan AG, Traina AJ, Ribeiro MX, Marques PM, Traina C, Jr Smart histogram analysis applied to the skull-stripping problem in T1-weighted MRI. Comput Biol Med. 2012;42:509–22. doi: 10.1016/j.compbiomed.2012.01.004. [DOI] [PubMed] [Google Scholar]
- 31.Poynton CB, Chen KT, Chonde DB, Izquierdo-Garcia D, Gollub RL, Gerstner ER, et al. Probabilistic atlas-based segmentation of combined T1-weighted and DUTE MRI for calculation of head attenuation maps in integrated PET/MRI scanners. Am J Nucl Med Mol Imaging. 2014;4:160–71. [ PMC Free Article] [PMC free article] [PubMed] [Google Scholar]
- 32.In: SPM. Statistical Parametric Mapping. Available from: http://www.fil.ion.ucl.ac.uk/spm/ [Google Scholar]
- 33.In: Elasti. A toolbox for rigid and nonrigid registration of images. Available from: http://elastix.isi.uu.nl/ [Google Scholar]


