

Abstract
Background
Lung cancer (LC) is the most common malignancy in the world. Many long non‐coding RNAs (lncRNAs) have been reported to be associated with LC; however, the function of KCNQ1OT1 in LC requires exploration.
Methods
We conducted in silico analysis with data from The Cancer Genome Atlas to investigate the association between KCNQ1OT1 and LC. A Kaplan–Meier plotter was used to analyze the function of KCNQ1OT1 on LC patient prognosis. Quantitative reverse transcription‐PCR (qRT‐PCR) was performed to confirm previous results. An A549 lung cancer cell was transfected with pcDNA‐KCNQ1OT1, and methyl thiazolyl tetrazolium assay was performed to investigate the function of KCNQ1OT1 on cell proliferation. in vivo assay was performed with nude mice.
Results
Bioinformatics analysis and qRT‐PCR indicated that KCNQ1OT1 expression was higher in stage I LC patients (P < 0.01), and survival analysis showed that high expression of KCNQ1OT1 in LC patients was associated with better prognosis (P < 0.05). qRT‐PCR showed a negative correlation between KCNQ1OT1 and Ki67 expression and tumor size (P < 0.01), which indicated that KCNQ1OT1 is associated with tumor growth in LC. There was no significant correlation between KCNQ1OT1 level and lymph node metastasis (P > 0.05). KCNQ1OT1 overexpression significantly inhibited cell proliferation and tumor growth in vitro and in vivo (P < 0.05).
Conclusion
Our preliminary data showed that KCNQ1OT1 is overexpressed in early stage LC and is correlated with better prognosis in LC patients, possibly by suppressing cell proliferation.
Keywords: KCNQ1OT1, long non‐coding RNA, lung cancer, prognosis, proliferation
Introduction
Lung cancer (LC), the most common malignancy in the world, is the first and fourth most deadly malignant disease in men and women, respectively.1, 2 According to previous studies, LC prognosis is affected by multiple factors, such as the size of the primary tumor, the involvement of regional lymph nodes, and the presence of metastases.3 Increasing studies of the oncogenetic mechanism have identified new molecules related to LC prognosis, which facilitates our understanding of LC biology. However, more novel molecular items and entities are required to develop effective anti‐cancer strategies. For instance, the discovery of non‐coding RNAs (lncRNAs) has opened up a new field for oncologists.4, 5, 6
LncRNAs are a kind of transcript with a > 200 nucleotide length. These RNAs have some characteristics in common with messenger RNA. The only difference between lncRNAs and messenger RNAs is that lncRNAs lack protein coding potential.7 More than 40 lncRNAs have been reported to be associated with the initiation, progression, and drug resistance of LC.8, 9 KCNQ1OT1, an lncRNA responsible for suppressing a cluster of genes in cis, has been shown to be involved in multiple cancers.10, 11 The loss of imprinting KCNQ1OT1 locus through epigenetic disruption plays an important role in carcinogenesis.12 In addition, KCNQ1OT1 is involved in epigenetic suppression of CDKN1C in breast cancer cells.13 However, no previous studies have explored the function of lncRNA KCNQ1OT1 in lung malignancy.
In order to reveal the relationship between KCNQ1OT1 and LC, we performed a series of bioinformatic analyses and conducted several experiments. Our results revealed that KCNQ1OT1 has an anti‐tumor function in LC.
Methods
Bioinformatics analysis
The KCNQ1OT1 expression profile and clinical data were collected from The Cancer Genome Atlas (TCGA) database (https://cancergenome.nih.gov/) and analyzed using R language (dataset: LUNG CANCER‐HiSeqV2‐2015‐02‐24, n = 1124). Kaplan–Meier plotter (http://kmplot.com) was used to analyze the association between KCNQ1OT1 expression and prognosis of cancer patients. A relationship between KCNQ1OT1 and survival was analyzed in lung, breast, gastric, and ovarian cancers. The data of this platform was gathered from TCGA and Gene Expression Omnibus databases. All patients in this analysis were postoperative. All patients were divided into two cohorts according to the level of KCNQ1OT1: the top 50% of patients were defined as KCNQ1OT1high, and the remaining 50% were defined as KCNQ1OT1low. We analyzed the association between KCNQ1OT1 level and LC survival in stage I postoperative patients, in stage II and III postoperative patients, and in all postoperative patients. For the other three types of cancers, we only analyzed the association in all postoperative patients.
Study population
Samples were collected from 130 patients who underwent surgical resection and were diagnosed with LC between May 2012 and September 2013 at the Department of Thoracic Surgery, the Affiliated Hospital of Qingdao University. Ethical approval for this study was obtained from the Ethnic Committee of the Affiliated Hospital of Qingdao University.
None of the included patients underwent preoperative radiotherapy or chemotherapy, and had not developed distant metastases. Clinicopathologic and follow‐up data were complete. Patients lost to follow‐up, who had received preoperative radiotherapy or chemotherapy, or developed recurrence or distant metastases were excluded. Samples for negative controls were taken more than 5 cm from the tumor margin of normal lung tissues. All collected tissue samples were immediately stored at −80°C until use. Postoperative pathological staging was determined in all patients based on the eighth edition of tumor node metastasis (TNM) classification. Informed consent was obtained from all participants.
Follow‐up
Follow‐up was performed every three months during the first year and every six months in later years. The median follow‐up duration was 42 months (range: 4–54). Follow‐up included clinical examination, blood analysis, and computed tomographic scans. Overall survival (OS) was defined as the period from surgery to patient death or the last follow‐up. Disease‐free survival (DFS) was defined as the period from surgery to tumor recurrence or patient death as the result of a non‐cancerous cause.
RNA extraction and quantitative reverse transcription‐PCR
Total RNA was extracted from tissues and cultured cells with TRIZOL reagent (Solarbio, Beijing, China). The SuperScript III First‐Strand Synthesis System for RT‐PCR (Thermo Fisher Scientific, Waltham, MA, USA) was used to reverse‐transcribe RNA into complementary DNA. qRT‐PCR was performed using an Applied Biosystems 7500 Real‐Time PCR system (Applied Biosystems, Foster City, CA, USA) with SYBR Green PCR Master Mix (Thermo Fisher Scientific, USA). Human KCNQ1OT1 primers were as follows: forward (5′‐GGGAGCTGTTGTCCCTTACC), reverse (5′‐TTCGGAGTGGTAACTGTGCC). Relative lncRNA levels were calculated using 2–ΔCT (where ΔCt = Ct[gene] – Ct[β‐actin]). Fold changes of lncRNA expression in tumor tissues versus adjacent normal tissues were calculated using the 2–ΔΔCT method. PCR for each sample was performed three times. Glyceraldehyde 3‐phosphate dehydrogenase was used as an internal control.
Cell culture and transfection
The LC cell line A549 was cultured at 37°C in Dulbecco's modified Eagle's medium containing 10% fetal bovine serum in a humidified incubator containing 5% CO2. The KCNQ1OT1 sequence was synthesized and subcloned into the pcDNA3.1 (Genechem, Shanghai, China) vector. PcDNA‐KCNQ1OT1 and the empty vector were transfected. After seven hours, the transfection media was replaced with normal media, and the cells were cultured for another 24 hours. The transfected cells were then placed in medium containing puromycin. Plasmid with higher transfection efficiency was selected for further assays. Each experiment was performed three times.
Cell proliferation assays
Cells were seeded in 96‐well culture plates at a density of 3.0 × 10³ cells per well. Methyl thiazolyl tetrazolium (MTT) assay was performed to detect the proliferation of A549 cells after treatment with pcDNA‐KCNQ1OT1, the empty vector, or left untreated. In each well, cells were exposed to 10 μL MTT (5.0 mg/mL) for four hours at 37°C. The supernatant was then removed and 150 μL dimethyl sulfoxide was added to determine the optical density (OD) value at 570 nm using an enzyme‐linked immunosorbent assay reader (Thermo Fisher Scientific, USA). The proliferation rate was calculated as follows: cell viability rate = (OD sample‐OD blank)/(OD control‐OD blank) × 100%. The viability of untreated cells was regarded as 100%. Each group included five wells. Experiments were repeated three times.
Tumor growth in nude mice
Ten four‐week‐old female nude mice were purchased from Vital River Laboratories (VRL, Beijing, China) and bred at the animal center of Medical College of Qingdao University for the study. Cells were washed with phosphate buffered saline and harvested with 1640 culture medium, and then resuspended in 1640 culture medium. Equal amounts of matrix gum were mixed in single cell suspension. Subsequently, 2 × 10⁶ cells (0.1 mL) were injected subcutaneously into the neck of mice. Five mice were injected with A549‐ pcDNA‐KCNQ1OT1 cells, while the other five were injected with A549‐empty vector. Tumor size was measured each week. Tumor volume was calculated according to the following formula: volume = width2 × length/2. Two mice died in the third week and the remaining mice were sacrificed in the fourth week. The Animal Ethics Committee of the hospital research department approved all animal experiments.
Statistical analyses
All data were analyzed using SPSS version 17.0 (SPSS Inc., Chicago, IL, USA), Excel 2003 (Microsoft, Washington, DC, USA), and Adobe Photoshop CS6 (Adobe, San Jose, CA, USA). Data are presented as mean ± standard deviation. Chi‐square and t tests were used to determine the significance of differences between the groups. P values < 0.05 were considered statistically significant.
Results
Bioinformatic analysis indicated KCNQ1OT1 was overexpressed in early stage lung cancer (LC)
In order to study the function of lncRNA KCNQ1OT1, we analyzed its expression profile in LC samples in TCGA public database.14 Using R language, we performed a series of analyses on KCNQ1OT1 and multiple subtypes of LC, and the results indicated that KCNQ1OT1 is upregulated in multiple types of lung malignancies compared to normal tissue (P = 0.005, 0.013, and 0.027, respectively) (Fig 1a). There were no significant differences among large cell LC, lung adenocarcinoma, or lung squamous cell carcinoma.
Figure 1.
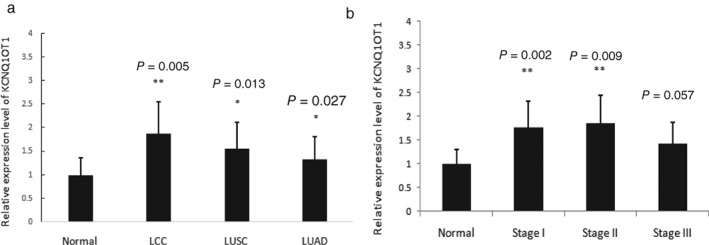
Data from The Cancer Genome Atlas (TCGA) database indicated that KCNQ1OT1 is overexpressed in early stage lung cancer (LC). (a) KCNQ1OT1 is mildly upregulated in multiple subtypes of lung malignancies compared to normal tissue (P = 0.005, 0.013, and 0.027, respectively). (b) The KCNQ1OT1 level is higher in early stage (I and II) LC compared to normal tissues (P = 0.002 and 0.009, respectively); no difference was observed between advanced stage (III) LC and normal tissues (P = 0.057). Source: TCGA (LUNG CANCER‐HiSeqV2‐2015‐02‐24 [n = 1124]). LCC, large cell LC; LUAD, lung adenocarcinoma; LUSC, lung squamous cell carcinoma.
Subsequently, we analyzed the correlation between KCNQ1OT1 expression and different pathological stages of LC. Surprisingly, the results demonstrated that the KCNQ1OT1 level is higher in early stage (I and II) LC compared to normal tissues (P = 0.002 and 0.009, respectively), and no difference was observed between stage III LC and normal tissues (P = 0.057) (Fig 1b). These results revealed that KCNQ1OT1 expression is elevated in early stage LC patients; however, the mechanism underlying this result requires further exploration.
Survival analysis revealed an anti‐tumor function of KCNQ1OT1 in LC
To further address the role of KCNQ1OT1 in LC, survival analysis according to KCNQ1OT1 expression was performed using the Kaplan–Meier plotter public database.15 Surprisingly, we found that the KCNQ1OT1high group exhibited significantly higher five and even 10‐year survival rates in LC (Fig 2a), which indicated that KCNQ1OT1 exerts an anti‐tumor function in LC patients. Further analyses were carried out between KCNQ1OT1 and prognosis at different pathological stages, and the Kaplan–Meier plotters showed that this lncRNA correlated with prognosis in stage I LC patients (Fig 2b). However, the anti‐tumor function was not observed in stage II or III patients (Fig 2c).
Figure 2.
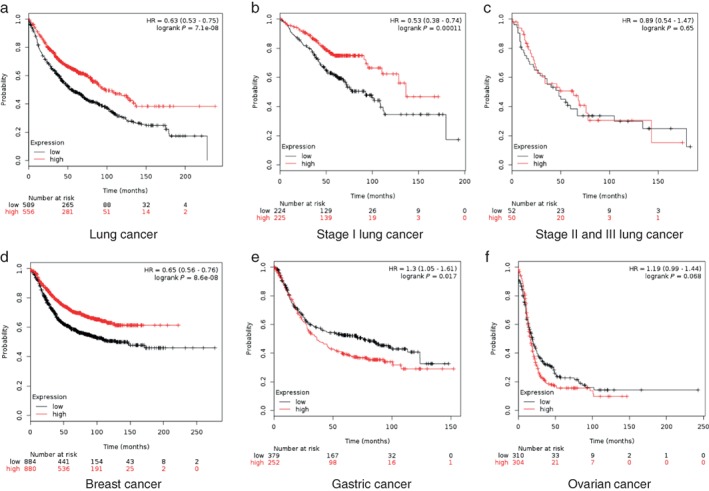
KCNQ1OT1 level is positively correlated with better prognosis in LC patients. Survival curves according to KCNQ1OT1 level in (a) lung cancer (LC) (KCNQ1OT1low = 589 (black line) and KCNQ1OT1high = 556 (red line), hazard ratio (HR) = 0.63 (0.53 – 0.75), logrank P = 7.1e‐08; (b) stage I LC (KCNQ1OT1low = 224 (black line) and KCNQ1OT1high = 225 (red line), HR = 0.53 (0.38 – 0.74), logrank P = 0.00011l; (c) stage II and III LC (KCNQ1OT1low = 52 (black line) and KCNQ1OT1high = 50 (red line), HR = 0.89 (0.54 – 1.47), logrank P = 0.65; (d) breast cancer (KCNQ1OT1low = 441 (black line) and KCNQ1OT1high = 536 (red line), HR = 0.65 (0.56 – 0.76), logrank P = 8.6e‐08; (e) gastric cancer (KCNQ1OT1low = 379 (black line) and KCNQ1OT1high = 252 (red line), HR = 1.3 (1.05 – 1.61), logrank P = 0.017; and (f) ovarian cancer (KCNQ1OT1low = 310 (black line) and KCNQ1OT1high = 304 (red line), HR = 1.19 (0.99 – 1.44), logrank P = 0.068. Data source: Kaplan–Meier plotter. Expression: low, high.
In order to investigate whether KCNQ1OT1 exerts a similar function in other malignancies, we conducted analysis on gastric, ovarian, and mammary cancers using the Kaplan–Meier plotter. The results indicated that a high level of KCNQ1OT1 is correlated with better prognosis in breast cancer (Fig 2d), but is associated with poor prognosis in gastric and ovarian cancers (Fig 2e,f). These results indicated that the function of KCNQ1OT1 is different in multiple malignancies.
According to these results, we concluded that KCNQ1OT1 exerts an anti‐tumor function that is more significant in early stage LC. Compared with advanced LC, early stage LC is small in size or has not yet migrated. KCNQ1OT1 may affect prognosis in these two aspects. Further assays and deeper analysis are required to explore the association between KCNQ1OT1 and prognosis in LC patients.
Upregulated KCNQ1OT1 is correlated with tumor size and ki67 expression
In order to further study the function of KCNQ1OT1, qRT‐PCR was performed with 130 samples of frozen fresh lung cancer tissues and their adjacent normal tissues, which were collected in 2012. According to the follow‐up information, a series of analyses on the association between KCNQ1OT1 expression and clinical data were conducted. Firstly, we confirmed once more that KCNQ1OT1 is upregulated in stage I (4.4‐fold, P = 0.006) and II (2.52‐fold, P = 0.024) LC, but was not altered in stage III LC (P = 0.213) (Fig 3a). A negative correlation between KCNQ1OT1 and tumor size was observed (P = 0.009) (Fig 3c), but there was no significant correlation between KCNQ1OT1 expression and lymph node metastasis (P = 0.135) (Fig 3b). These results indicated that KCNQ1OT1 can improve LC metastasis while inhibiting tumor growth, and is not associated with cancer cell invasion and metastasis.
Figure 3.
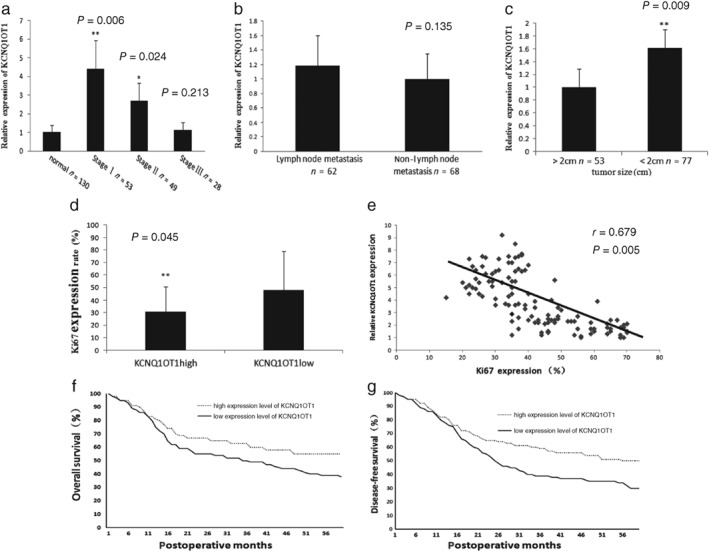
Upregulated KCNQ1OT1 was correlated with tumor stage, tumor size, and ki67 expression. (a) The KCNQ1OT1 level was significantly higher in stage I (4.4‐fold, P = 0.006) and II (2.52‐fold, P = 0.024) lung cancer (LC) compared to normal tissue (P = 0.045). No significant change was observed between stage III LC and adjacent normal tissues. (b) No significant change in KCNQ1OT1 level was observed between lymph node metastasis and non‐metastasis (P = 0.135). (c) The KCNQ1OT1 level was significantly higher in tumors < 2 cm (P = 0.009). (d) The ki67 expression rate was lower in the KCNQ1OT1high (n = 65) than in the KCNQ1OT1low group (n = 65) (37.58 ± 18.87 vs. 26.50 ± 16.15; P = 0.045). (e) Scatterplots of correlation of KCNQ1OT1 expression level with Ki67 expression in LC (r = 0.679, P = 0.005). (f) Overall (hazard ratio [HR] = 0.78 (0.58–0.99), P = 0.000) and (g) disease‐free (HR = 0.86 [0.64–1.09]; P = 0.000) survival rates.
Furthermore, these 130 LC samples were divided into two groups (65 cases in each group) according to KCNQ1OT1 expression level, and the clinical data were analyzed between these groups. Clinical staging and tumor size were both significantly different between the groups (Table 1). There were more stage I and fewer stage III cases in the KCNQ1OT1high group (P = 0.008). Tumor size in the KCNQ1OT1high group was smaller than in the KCNQ1OT1low group (31.47 ± 10.04 vs. 15.16 ± 13.24; P = 0.002). Additionally, the ki67 positive rate, which is a routine index in pathological examination indicating shortened cell cycle,16 was analyzed according to the clinical data of these 130 cases. Statistical analysis indicated that the Ki67 level in the KCNQ1OT1low group was significantly higher than in the KCNQ1OT1high group (37.58 ± 18.87 vs. 26.50 ± 16.15; P = 0.045) (Fig 3d). Scatter plots of the correlation between KCNQ1OT1 and Ki67 expression were also analyzed, and the result demonstrated negative relativity between this lncRNA and ki67 expression rate (r = 0.679; P = 0.005) (Fig 3e). From these results we concluded that KCNQ1OT1 functions as an inhibitor of LC cell proliferation and tumor growth.
Table 1.
Relationship between KCNQ1OT1 expression level and clinicopathologic features in fresh lung cancer tissues
| Clinicopathologic features | Total | Low expression (n = 65) (%) | High expression (n = 65) (%) | P |
|---|---|---|---|---|
| Age (year) | 0.705* | |||
| Mean | 61.36 ± 10.25 | 62.02 ± 15.32 | ||
| >50 | 84 | 43 (66) | 41 (63) | |
| ≤50 | 46 | 22 (34) | 24 (37) | |
| Gender | 0.072* | |||
| Male | 74 | 35 (54) | 39 (60) | |
| Female | 56 | 30 (46) | 26 (40) | |
| Clinical stage | 0.0081** | |||
| I | 53 | 12 (13) | 41 (63) | |
| II | 49 | 27 (44) | 22 (34) | |
| III | 28 | 26 (43) | 2 (3) | |
| Tumor size (mm) | 0.0023** | |||
| Mean | 31.47 ± 10.04 | 15.16 ± 13.24 | ||
| >20 | 53 | 42 (64) | 11 (17) | |
| ≤20 | 77 | 23 (36) | 54 (83) | |
| Lymph node metastasis | 0.251* | |||
| Yes | 62 | 29 (44) | 33 (51) | |
| No | 68 | 36 (56) | 32 (49) |
P > 0.05.
P < 0.01.
Non‐small cell lung cancer patients were divided in two cohorts, low (n = 65) and high (n = 65), according to the KCNQ1OT1 expression level in their cancer tissues. Statistical analyses were performed by chi‐square test. Data are presented as mean ± standard deviation. Clinical stage and tumor extent were evaluated according to tumor node metastasis classification established by the American Joint Committee on Cancer. Tumor size and lymph node metastasis were determined according to pathological results.
Finally, survival analysis according to KCNQ1OT1 level was also performed using the 130 LC samples. The OS and DFS rates of patients with higher KCNQ1OT1 expression levels were both higher (Fig 3f, g), consistent with the database.
In summary, KCNQ1OT1 level is elevated in LC patients, particularly at stage I. A higher level of KCNQ1OT1 is associated with smaller tumor size, lower proliferation speed of LC cells, and better prognosis of LC patients.
KCNQ1OT1 functions as an inhibitor of cell proliferation in A549 cells
In order to further understand the functions of KCNQ1OT1 on cell proliferation, we performed transient transfection KCNQ1OT1 overexpression in LC cell line A549 using KCNQ1OT1 pcDNA 3.1 plasmid and observed approximately six‐fold overexpression in KCNQ1OT1 levels (pcDNA‐KCNQ1OT1 vs. wild‐type, 6.12‐fold; P = 0.004) (Fig 4a). MTT assay was then performed to determine cell proliferation. The KCNQ1OT1 overexpression group showed a decreased growth speed compared to the group transfected with the empty vector in the 72nd hour (P = 0.035) (Fig 4b). According to the result, KCNQ1OT1 distinctively suppresses LC cell proliferation in vitro.
Figure 4.
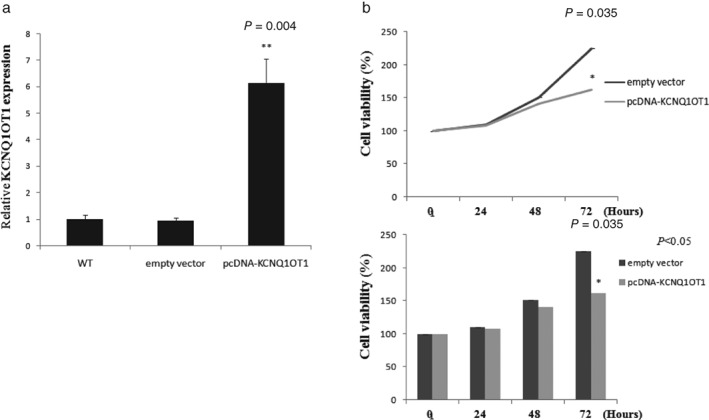
KCNQ1OT1 inhibits A549 cell proliferation. (a) Relative transfection efficiency of pcDNA‐KCNQ1OT1 plasmid in A549 cells. A 6.12‐fold increase was observed (pcDNA‐KCNQ1OT1 vs. WT; P = 0.004). (b) The cell proliferation rate of A549 cells was determined using methyl thiazolyl tetrazolium assay. Upregulated KCNQ1OT1 led to an inhibition of cell growth in the 72nd hour (P = 0.035).
KCNQ1OT1 inhibits tumor growth in vivo
The function of KCNQ1OT1 in vivo was also investigated using nude mice by subcutaneously injecting A549 pcDNA‐KCNQ1OT1 cells and the control. Tumors were observed from the fourth day after injection. In the fourth week after injection, we found that tumors in the A549 pcDNA‐KCNQ1OT1 group were significantly smaller than empty vector xenograft tumors (Fig 5a). A difference in tumor volume was observed between the two groups by the second week, which became significant in the fourth week (P = 0.030) (Fig 5b). After excision, the tumors were weighed. The results showed that tumors growing from A549 pcDNA‐KCNQ1OT1 cells were significantly heavier than in the non‐specific control (P = 0.015) (Fig 5c). These results demonstrated that lncRNA KCNQ1OT1 suppresses lung tumor growth in vivo.
Figure 5.
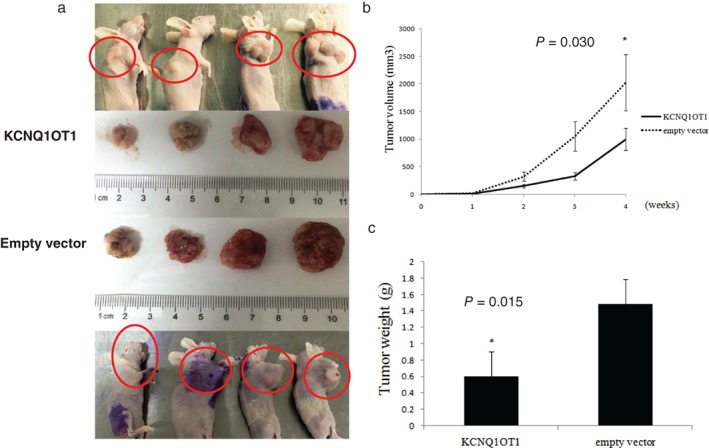
KCNQ1OT1 inhibited tumor growth in vivo. (a) Nude mice inoculated with pcDNA‐KCNQ1OT1‐A549 cells (upper), and the control (lower). The tumors in the KCNQ1OT1 group were (b) significantly smaller (P = 0.030 in the fourth week), and (c) lighter than in the control group (P = 0.015). The cancer cells were all injected between the right lower neck and right foreleg, and the tumor of the left nude mouse of control group migrated to its head.
Discussion
Our preliminary data showed that KCNQ1OT1 is overexpressed in early stage LC and is correlated with better prognosis in LC patients, possibly as a result of the suppression of cell proliferation. Compared to normal tissues, KCNQ1OT1 was upregulated in multiple subtypes of LC tissues. Interestingly, we found that the KCNQ1OT1 expression level was higher in stage I LC patients than in stage II and III patients. TNM staging is a reliable and widely used prognostic stratification, evaluating tumor size and lymph node metastasis.3 Further analysis demonstrated that the KCNQ1OT1 level was significantly higher in patients with tumors < 2 cm, but no correlation between KCNQ1OT1 and lymph node metastasis was observed. These results indicated that KCNQ1OT1 was upregulated in stage I patients because their tumor was smaller. Further associations with TNM staging should be investigated in future.
According to previous studies, KCNQ1OT1 is an imprinted gene, and the KCNQ1OT1 imprinting domain is located on mouse chromosome 7 and human 11p15.5, which are only expressed on the paternal allele. The transcript of KCNQ1OT1 regulates the suppression of the paternal copy of the other imprinted genes present in the 11p15.5 centromeric imprinted gene cluster.17, 18, 19 KCNQ1OT1 epigenetically regulates the transcription of multiple genes, including CDKN1C, a tumor suppressor gene located within the CDKN1C/KCNQ1OT1 imprinted region. It has been proposed that the function of CDKN1C may be associated with PRC2 between CDKN1C and the control region, which methylates H3K27 and leads to the formation of a repressive chromatin state of the CDKN1C locus.10, 20, 21, 22, 23 Therefore, we conclude that KCNQ1OT1 acts as an inhibitor of LC cell proliferation by regulating the transcription of CDKN1C, or other anti‐tumor genes, as a transcription factor. However, according to our analysis, KCNQ1OT1 exerts inverse functions in different cancers, such as gastric and ovarian cancers, indicating that the biological mechanisms of this molecule are more complicated than first thought. No previous study has investigated this association. Molecule function in tumor cells is associated with multiple factors, such as tumor microenvironment or gene mutation. This molecule is not the only one to exert different functions in different malignancies, thus the underlying mechanisms require further exploration.
In this study, we combined basic and clinical experiments to determine the anti‐tumor function of KCNQ1OT1, which has not been explored by previous studies. Accordingly, this lncRNA can be detected in tumor tissues collected during surgery to evaluate prognosis in LC patients. Moreover, this lncRNA has potential as a molecular target for LC gene therapy. These results demonstrate reference value regarding cancer therapy alone, because there are always differences between basic research and clinical phenomenon, as assays in vitro cannot reflect the anti‐tumor immunity inside the human body. Furthermore, many previous studies of one molecule focus only on a single aspect. In such a complex molecular network of tumors, KCNQ1OT1 or other cancer‐related molecules are more likely to be associated with multiple mechanisms. Further studies are required to explore the mechanisms of KCNQ1OT1 in the process of suppressing lung malignancy, and also those that promote other malignancies, such as gastric cancer.
Disclosure
No authors report any conflict of interest.
Acknowledgments
This study was funded by grants from the Natural Science Foundation of Shandong Province (ZR2016HM58 and ZR2014HM004).
Contributor Information
Xiao Sun, Email: 15763933878@163.com.
Jia Liu, Email: xwkjiao@126.com.
Wenjie Jiao, Email: dadaliujia@qdu.edu.cn.
References
- 1. Wei S, Tian J, Song X, Wu B, Liu L. Causes of death and competing risk analysis of the associated factors for non‐small cell lung cancer using the Surveillance, Epidemiology, and End Results database. J Cancer Res Clin Oncol 2018; 144: 145–55. [DOI] [PMC free article] [PubMed] [Google Scholar]
- 2. Suh WN, Kong KA, Han Y et al Risk factors associated with treatment refusal in lung cancer. Thorac Cancer 2017; 8: 443–50. [DOI] [PMC free article] [PubMed] [Google Scholar]
- 3. Lee JS, Hong WK. Prognostic factors in lung cancer. N Engl J Med 1992; 327: 47–8. [DOI] [PubMed] [Google Scholar]
- 4. Seiler J, Breinig M, Caudron‐Herger M, Polycarpou‐Schwarz M, Boutros M, Diederichs S. The lncRNA VELUCT strongly regulates viability of lung cancer cells despite its extremely low abundance. Nucleic Acids Res 2017; 45: 5458–69. [DOI] [PMC free article] [PubMed] [Google Scholar]
- 5. Loewen G, Jayawickramarajah J, Zhuo Y, Shan B. Functions of lncRNA HOTAIR in lung cancer. J Hematol Oncol 2014; 7: 90. [DOI] [PMC free article] [PubMed] [Google Scholar]
- 6. Li Y, Wang B, Lai H et al Long non‐coding RNA CRALA is associated with poor response to chemotherapy in primary breast cancer. Thorac Cancer 2017; 8: 582–91. [DOI] [PMC free article] [PubMed] [Google Scholar]
- 7. Chen R, Li WX, Sun Y et al Comprehensive analysis of lncRNA and mRNA expression profiles in lung cancer. Clin Lab 2017; 63: 313–20. [DOI] [PubMed] [Google Scholar]
- 8. Gong WJ, Peng JB, Yin JY et al Association between well‐characterized lung cancer lncRNA polymorphisms and platinum‐based chemotherapy toxicity in Chinese patients with lung cancer. Acta Pharmacol Sin 2017; 38: 581–90. [DOI] [PMC free article] [PubMed] [Google Scholar]
- 9. Hu X, Bao J, Wang Z et al The plasma lncRNA acting as fingerprint in non‐small‐cell lung cancer. Tumour Biol 2016; 37: 3497–504. [DOI] [PubMed] [Google Scholar]
- 10. Kanduri C. Kcnq1ot1: A chromatin regulatory RNA. Semin Cell Dev Biol 2011; 22: 343–50. [DOI] [PubMed] [Google Scholar]
- 11. Mohammad F, Mondal T, Guseva N, Pandey GK, Kanduri C. Kcnq1ot1 noncoding RNA mediates transcriptional gene silencing by interacting with Dnmt1. Development 2010; 137: 2493–9. [DOI] [PubMed] [Google Scholar]
- 12. Nakano S, Murakami K, Meguro M et al Expression profile of LIT1/KCNQ1OT1 and epigenetic status at the KvDMR1 in colorectal cancers. Cancer Sci 2006; 97: 1147–54. [DOI] [PMC free article] [PubMed] [Google Scholar]
- 13. Rodriguez BA, Weng YI, Liu TM et al Estrogen‐mediated epigenetic repression of the imprinted gene cyclin‐dependent kinase inhibitor 1C in breast cancer cells. Carcinogenesis 2011; 32: 812–21. [DOI] [PMC free article] [PubMed] [Google Scholar]
- 14. Wang Z, Jensen MA, Zenklusen JC. A practical guide to The Cancer Genome Atlas (TCGA). Methods Mol Biol 2016; 1418: 111–41. [DOI] [PubMed] [Google Scholar]
- 15. Hou GX, Liu P, Yang J, Wen S. Mining expression and prognosis of topoisomerase isoforms in non‐small‐cell lung cancer by using Oncomine and Kaplan‐Meier plotter. PloS One 2017; 12: e0174515. [DOI] [PMC free article] [PubMed] [Google Scholar]
- 16. Zhou Y, Hu W, Chen P et al Ki67 is a biological marker of malignant risk of gastrointestinal stromal tumors: A systematic review and meta‐analysis. Medicine 2017; 96 (34): e7911. [DOI] [PMC free article] [PubMed] [Google Scholar]
- 17. Sunamura N, Ohira T, Kataoka M et al Regulation of functional KCNQ1OT1 lncRNA by beta‐catenin. Sci Rep 2016; 6: 20690. [DOI] [PMC free article] [PubMed] [Google Scholar]
- 18. Du M, Zhou W, Beatty LG, Weksberg R, Sadowski PD. The KCNQ1OT1 promoter, a key regulator of genomic imprinting in human chromosome 11p15.5. Genomics 2004; 84: 288–300. [DOI] [PubMed] [Google Scholar]
- 19. Cerrato F, Vernucci M, Pedone PV et al The 5′ end of the KCNQ1OT1 gene is hypomethylated in the Beckwith‐Wiedemann syndrome. Hum Genet 2002; 111: 105–7. [DOI] [PubMed] [Google Scholar]
- 20. Alders M, Bliek J, vd Lip K, vd Bogaard R, Mannens M. Determination of KCNQ1OT1 and H19 methylation levels in BWS and SRS patients using methylation‐sensitive high‐resolution melting analysis. Eur J Hum Genet 2009; 17: 467–73. [DOI] [PMC free article] [PubMed] [Google Scholar]
- 21. Inoue T, Nakamura A, Matsubara K et al Continuous hypomethylation of the KCNQ1OT1:TSS‐DMR in monochorionic twins discordant for Beckwith‐Wiedemann syndrome. Am J Med Genet A 2017; 173: 2847–50. [DOI] [PubMed] [Google Scholar]
- 22. Robbins KM, Chen Z, Wells KD et al Expression of KCNQ1OT1, CDKN1C, H19, and PLAGL1 and the methylation patterns at the KvDMR1 and H19/IGF2 imprinting control regions is conserved between human and bovine. J Biomed Sci 2012; 19: 95. [DOI] [PMC free article] [PubMed] [Google Scholar]
- 23. Wijnen M, Alders M, Zwaan CM, Wagner A, van den Heuvel‐Eibrink MM. KCNQ1OT1 hypomethylation: A novel disguised genetic predisposition in sporadic pediatric adrenocortical tumors? Pediatr Blood Cancer 2012; 59: 565–6. [DOI] [PubMed] [Google Scholar]