Abstract
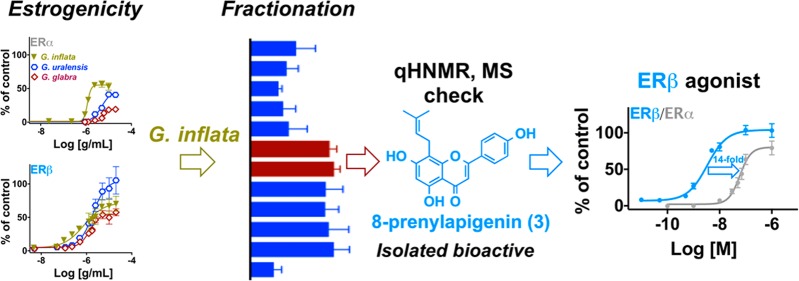
Postmenopausal women are increasingly using botanicals for menopausal symptom relief due to the increased breast cancer risk associated with traditional estrogen therapy. The deleterious effects of estrogens are associated with estrogen receptor (ER)α-dependent proliferation, while ERβ activation could enhance safety by opposing ERα effects. Three medicinal licorice species, Glycyrrhiza glabra (G. glabra), G. uralensis, and G. inflata, were studied for their differential estrogenic efficacy. The data showed higher estrogenic potency for G. inflata in an alkaline phosphatase induction assay in Ishikawa cells (ERα) and an estrogen responsive element (ERE)-luciferase assay in MDA-MB-231/β41 breast cancer cells (ERβ). Bioassay-guided fractionation of G. inflata led to the isolation of 8-prenylapigenin (3). Surprisingly, a commercial batch of 3 was devoid of estrogenic activity. Quality control by MS and qNMR revealed an incorrect compound, 4′-O-methylbroussochalcone B (10), illustrating the importance of both structural and purity verification prior to any biological investigations. Authentic and pure 3 displayed 14-fold preferential ERβ agonist activity. Quantitative analyses revealed that 3 was 33 times more concentrated in G. inflata compared to the other medicinal licorice extracts. These data suggest that standardization of G. inflata to 3 might enhance the safety and efficacy of G. inflata supplements used for postmenopausal women’s health.
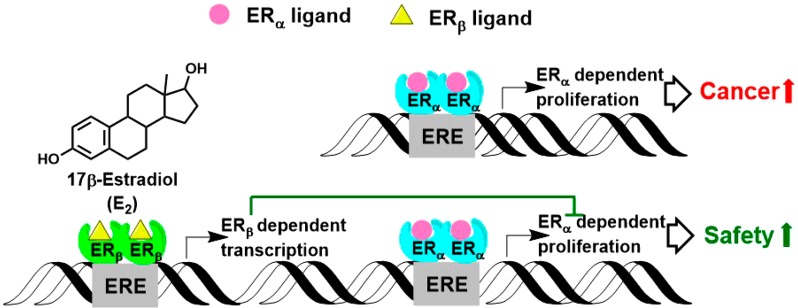
Menopause is an inevitable phase of life for women that is marked by a drastic decline in the levels of estrogen in the circulation. This hormonal change causes a number of symptoms such as hot flashes, insomnia, fatigue, anxiety, depression, mood changes, and vaginal atrophy, which could have a dramatic negative influence on the quality of life of women for the last third of their lifetime.1 It is well known that estradiol (E2, Figure 1) plays a crucial role in human physiology.2 In its classical pathway, E2 binds to two estrogen receptors (ERs), ERα and ERβ, followed by the interaction of the ERs with estrogen responsive elements (EREs) at the promoter region of the estrogen-dependent genes, which ultimately results in the transcription of these genes and the final biological responses (Figure 1).2 With the onset of menopause, these events cannot take place due to the lack of estrogens. While hormone therapy (HT) can ameliorate this situation by supplementing estrogens, the 2002 Women’s Health Initiative (WHI) has shown an increased breast cancer risk associated with HT.3−6 As such, there have been rigorous investigations to find safer options for treating menopausal symptoms.3 It has been reported that activators of ERβ pathways may balance the proliferative effects associated with ERα and might have a better safety profile (Figure 1).2,7−10 Increasing evidence suggests the protective role of ERβ in various disease conditions.11−13 Some constituents of menopausal dietary supplements that have become popular after the WHI report have shown selectivity for ERβ pathways.8,14,15 For example, soy, red clover, and their isoflavone, genistein (1), have exhibited ERβ effects in various models, although the in vivo results have not been conclusive.1,16−21 Studies have suggested that genistein (1) plays a protective role against various cancers.8 These findings, along with the fact that Asian women consuming a phytoestrogen-rich diet have a lower breast cancer incidence and less frequent and/or less severe hot flashes, warrant a more in-depth evaluation of the estrogenic effects of botanicals used for women’s health.1,22,23
Figure 1.
Effect of ERβ-dependent pathways on ERα-dependent proliferation.
Licorice is among the popular botanicals in oriental traditional medicine, is being used for various indications, including for women’s health, and is marketed in the U.S. as a dietary supplement ingredient targeting menopausal women.23,24 Among its 30 different reported species, Glycyrrhiza glabra L., G. inflata Batalin, and G. uralensis Fisch. ex DC. (Fabaceae) are the only three species approved in international pharmacopeias. At the same time, it has been shown that these three Glycyrrhiza species have distinctly different chemical profiles and, consequently, demonstrate varying levels and various types of estrogenic activity.1,25−28 Studies have suggested the lack of proliferative effects for licorice species in reproductive and mammary tissues of rodents, and these observations could be associated with the ERβ specificity of a given licorice extract.29 Liquiritigenin (7) is common to all licorice species and exhibits weak estrogenic effects with a moderate selectivity for ERβ.25,26,28,30−33 Other studies have also evaluated the estrogenic properties of various components of licorice and have suggested selective estrogen receptor modulator (SERM)-like effects with some of these phytochemicals.32,34,35 However, the different species of licorice have not been explored systematically for comparative ER subtype selectivity, and therefore other more potent ERβ ligands might exist.
The current study compared the ERα and ERβ activities of the three medicinal licorice species. The outcomes showed that G. inflata is the most estrogenic of the licorice species that were investigated and has nanomolar potency for ERβ. Collectively, this suggests that this species might be a suitable botanical for postmenopausal women’s health with an enhanced safety profile.
Scheme 1. Natural Products from Red Clover, Soy, Hops, and Licorice.
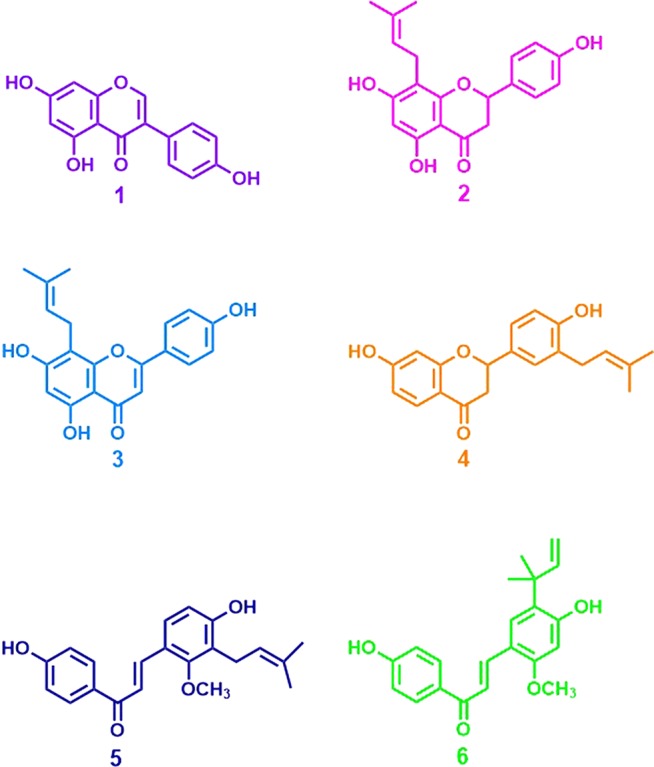
Genistein (1) is an ERβ-selective compound from red clover and soy. 8-Prenylnaringenin (2) is a potent estrogenic compound from hops. 8-Prenylapigenin (3) is an ERβ-selective compound isolated from licorice (G. inflata). Abyssinone II (4), licochalcone C (5), and licochalcone A (6) are isolated compounds from G. inflata with no estrogenic activity. Liquiritigenin (7) and isoliquiritigenin (8) are the estrogenic pair isolated from various licorice extracts.
Results and Discussion
Validation of the Bioassays for Differentiating ERα versus ERβ Effects
In order to compare ERα versus ERβ activity, a cell-based estrogenic assay protocol was used consisting of an induction of alkaline phosphatase activity assay in Ishikawa (ERα+) cells, and an ERβ-ERE-luciferase assay in MDA-MB-231/β41 cells was developed. Alkaline phosphatase activity in Ishikawa cells is mainly induced by activators of ERα-dependent pathways.36,37 MDA-MB-231/β41 cells (ER negative cells transfected with ERβ), on the other hand, specifically depict the estrogenic effects associated with ERβ through the activation of ERβ-ERE-luciferase.38 As positive controls the known selective ERα ligand 4,4′,4″-(4-propyl-[1H]-pyrazole-1,3,5-triyl)trisphenol (PPT) and the selective ERβ ligand 2,3-bis(4-hydroxyphenyl)propionitrile (DPN) developed by the Katzenellenbogen laboratory were used in these assays.39−41 While the ERα ligand PPT showed alkaline phosphatase activity in Ishikawa cells with a low nanomolar potency (Table 1, Figure 2A), it did not exhibit any estrogenic response in MDA-MB-231/β41 cells (Table 1, Figure 2B). These data were consistent with previous studies and confirmed the ERα selectivity of PPT and validated the use of the optimized ERα and ERβ assays.41 The ERβ ligand DPN showed estrogenic submicromolar potency in the alkaline phosphatase activity assay in Ishikawa cells (Table 1, Figure 2A) and in the ERβ-ERE-luciferase assay in MDA-MB-231/β41 cells (Table 1, Figure 2B) with a moderate (4-fold) selectivity for ERβ. Finally, the known phytoestrogens 8-prenylnarigenin (2), with no selectivity for ER subtypes, and genistein (1), with a 100-fold ERβ selectivity, exhibited the expected effects in these estrogenic assays (Figure 2). While a previous publication used the transfection of ERα and ERβ in ER knock-out MCF-7 cells, which might serve as a more straightforward comparison tool, our observations with the positive controls and some known phytochemicals in this study were consistent with previous publications and suggest that the developed bioassays function effectively and are fit for the purpose of screening plant extracts for differential ERα versus ERβ effects.16,26,27,33,39,40
Table 1. ERα- and ERβ-Dependent Estrogenic Effects of Licorice Species and Some Isolated Compoundsa.
| alkaline
phosphatase induction |
ERβ-ERE-luciferase |
|||
|---|---|---|---|---|
| treatment | EC50b | maximum efficacy | EC50b | maximum efficacy |
| 17β-estradiol | 0.03 ± 0.00c | 100 ± 10 | 0.03 ± 0.00c | 100 ± 4 |
| PPT | 1.0 ± 0.2c | 119 ± 14 | N/A | N/A |
| DPN | 0.08 ± 0.02 | 90 ± 7.0 | 0.020 ± 0.005 | 117 ± 10 |
| 3 | 0.050 ± 0.006 | 93 ± 7.0 | 0.0035 ± 0.0004 | 104 ± 6.0 |
| 2 | 0.005 ± 0.001 | 108 ± 18 | 0.0050 ± 0.0005 | 87 ± 9.0 |
| 1 | 0.24 ± 0.10 | 92 ± 4.0 | 0.0024 ± 0.0002 | 121 ± 11 |
| G. glabra | 5.4 ± 0.5 | 19 ± 2.0 | 1.6 ± 0.4 | 58 ± 9.0 |
| G. uralensis | 4.7 ± 0.2 | 41 ± 3.0 | 2.1 ± 0.3 | 101 ± 17 |
| G. inflata | 1.1 ± 0.2 | 57 ± 6.0 | 0.6 ± 0.2 | 80 ± 10 |
Values are expressed as the mean ± SEM of at least three independent determinations in triplicate/duplicate. Experimental details are described in the Experimental Section.
Values are expressed in μg/mL for extracts and μM for isolated compounds. N/A, not active.
nM.
Figure 2.
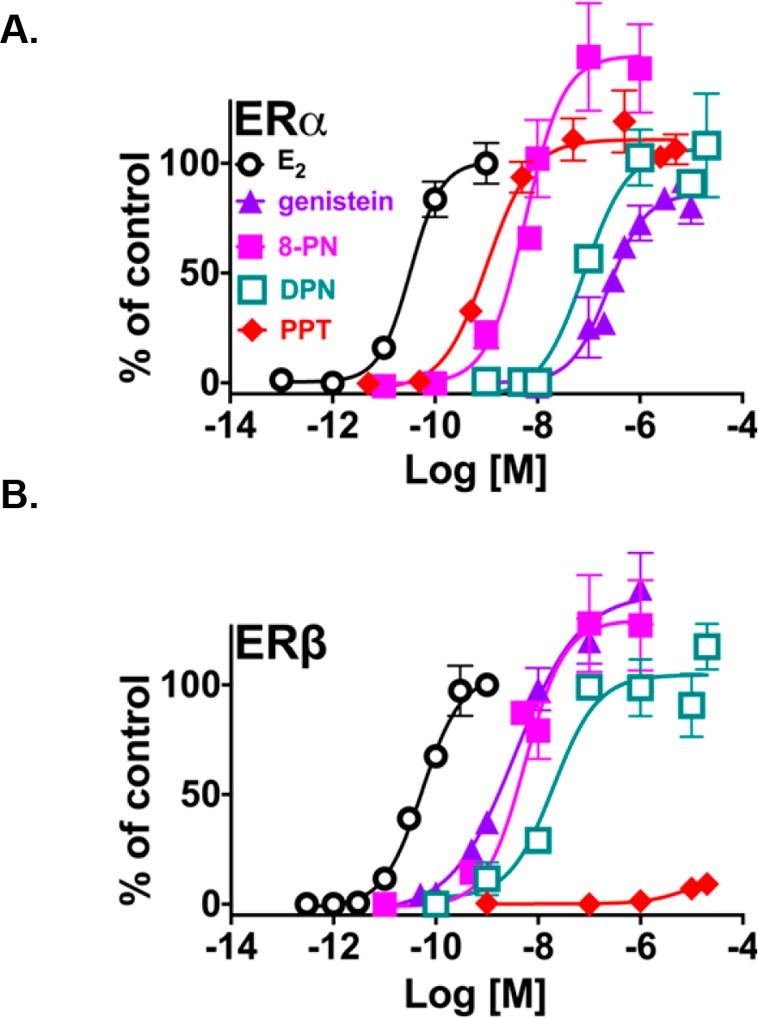
Method validation for defining ER selectivity based on (A) ERα-dependent alkaline phosphatase induction; (B) ERβ-ERE-luciferase induction using E2 (black, open circles), PPT (ERα-selective ligand) (red, filled diamonds), 8-prenylnaringenin (2) (pink, filled squares), DPN (ERβ selective ligand) (green, open squares), and genistein (1) (ERβ selective ligand) (purple, filled triangles). The methods for the Ishikawa and ERE-luciferase assays are described in the Experimental Section. The data represent the means ± SEM of three independent determinations.
Comparison of ERα versus ERβ Activity of Botanicals
When tested in the alkaline phosphatase activity assay in Ishikawa cells (ERα), all three extracts (G. glabra, G. inflata, and G. uralensis) showed dose-dependent activity (Figure 3A). The relative EC50 and the maximum efficacy rankings of the extracts in Ishikawa cells were as follows: G. inflata > G. uralensis > G. glabra (Table 1, Figure 3A). The results with G. uralensis and G. glabra were consistent with previous publications, while there are very few reports on the estrogenic activity of authenticated G. inflata.26,34,42 When the extracts were studied in the ERβ-ERE-luciferase induction assay in MDA-MB-231/β41 cells, the rank order for the potency of these extracts was G. inflata > G. glabra ≅ G. uralensis (Table 1, Figure 3B). Interestingly, a 2-fold increase in potency was observed in ERβ-ERE-luciferase signal for G. inflata in MDA-MB-231/β41 cells compared to the estrogenic activity of this extract in Ishikawa cells (ERα) (Table 1, Figure 3A, Figure 3B). While the increase in ERβ potency of G. uralensis and G. glabra was 2.3-fold and 3.4-fold, respectively, G. inflata had the highest ERβ potency (Table 1). The rank order for the maximum efficacy of these extracts in ERβ-ERE-luciferase induction was G. uralensis > G. inflata > G. glabra (Table 1, Figure 3B). Interestingly, when compared with the alkaline phosphatase data, all three extracts exhibited increased maximum efficacy in ERβ-ERE-luciferase signal (Table 1, Figure 3A,B). These data suggested that overall G. inflata has preferential activity with ERβ at lower concentrations and might have a better safety profile compared to G. glabra and G. uralensis, because its ERβ activity could protect hormone-responsive tissues against ERα-dependent proliferation. While the ERβ selectivity of the licorice extracts has not been fully investigated, previous studies have suggested ERβ selectivity for licorice extracts in the competitive ER binding assay, mostly due to the presence of liquiritigenin (7), which was also reported to be a selective ERβ ligand.26,31,33 However, in the current study ERβ selectivity could not be observed for liquiritigenin (7) in functional assays (data not shown), and G. inflata, being the most potent ERβ agonist of the extracts, only contained a relatively low amount of the bioactive, liquiritigenin (7) (Table 2, Supporting Information). Therefore, another compound in G. inflata was likely responsible for the observed ERβ potency.
Figure 3.
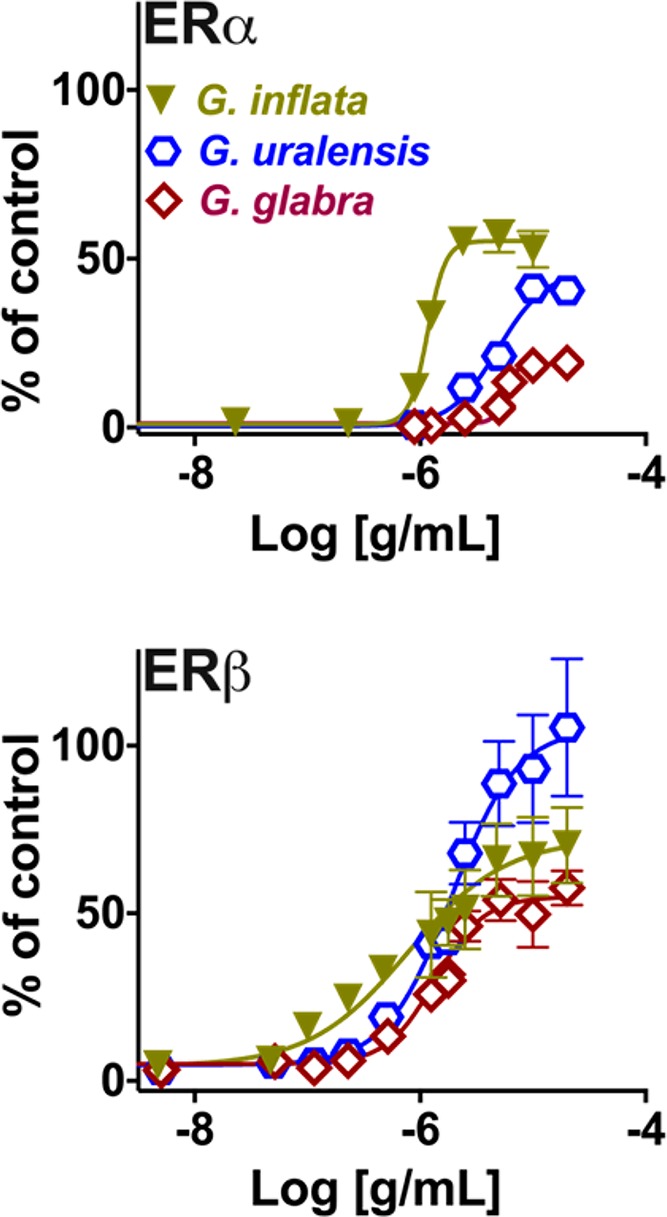
Induction of estrogenic activity with the three medicinal licorice extracts (G. inflata, green, filled triangles; G. glabra, brown, open diamonds; G. uralensis, blue, open hexagons). (A) ERα-dependent alkaline phosphatase activity induction in Ishikawa cells and (B) ERβ-ERE-luciferase assay in MDA-MB-231/β41 cells. The methods for the Ishikawa and ERE-luciferase assays are described in the Experimental Section. The data represent the means ± SEM of three independent determinations.
Table 2. Comparative Concentrations of Bioactive Compounds in the Licorice Extracts.
| % w/w
crude extract |
||||
|---|---|---|---|---|
| species | 6 | 8 equivalentsb | 7 equivalentsc | 3d |
| G. glabra | NDa | 3.61 ± 0.06 | 8.55 ± 0.06c | <LOQ |
| G. uralensis | NDa | 0.59 ± 0.01 | 3.86 ± 0.16 | 0.005 ± 0.000 |
| G. inflata | 7.07 ± 0.61 | 2.32 ± 0.04 | 3.67 ± 0.31c | 0.168 ± 0.045 |
ND: below the limit of detection.
The term 8 equivalents is used to represent the total amount of 8 aglycone plus 8 glycosides (isoliquiritin, isoliquiritin apioside, and licuraside) in each crude extract.
7 equivalents is used to represent the total amount of 7 aglycone plus 7 glycosides (liquiritin, liquiritin apioside, and liquiritigenin-7-O-apiosylglucoside) in each crude extract.
In addition to UHPLC-UV used for all the four entities (3, 6, 7, 8), 3 was quantified by LC-MS analysis. The values are expressed as means ± SD of three independent measures.
Bioassay-Guided Fractionation of G. inflata
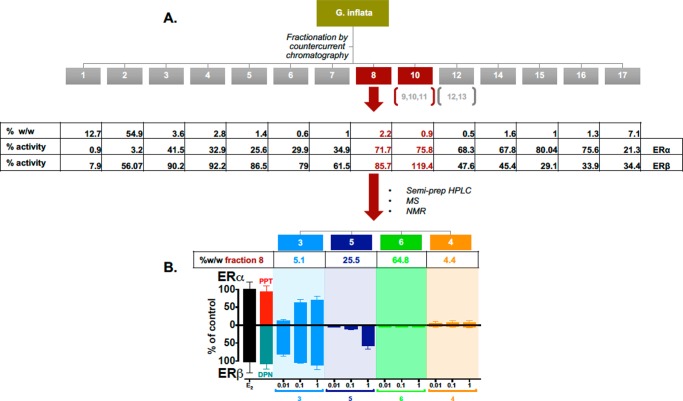
The observed higher ERβ potency of G. inflata (Table 1, Figure 3) suggested the presence of bioactive potent ERβ ligands [other than the weak estrogenic compound, liquiritigenin (7)] in this extract. Therefore, bioassay-guided fractionation of G. inflata extract (Figure 4A) was performed and eventually led to the selection of fractions 8 and 10, both of which displayed estrogenic activities in both the alkaline phosphatase induction assay in Ishikawa cells (ERα+) and the ERβ-ERE-luciferase assay in MDA-MB-231/β41 cells (ERβ+) (Figure 4B). Fraction 10, which represented only 0.8% w/w of the crude extract, had a rather complex phytochemical profile (Supporting Information), indicating that isolation of pure compounds in amounts sufficient for structure elucidation and of adequate purity for further bioassay assessment would be challenging. Interestingly, fraction 8, representing 2.2% w/w of the crude extract, was characterized by four major compounds. After purification by semipreparative HPLC, these four compounds were obtained and identified as 8-prenylapigenin (3, also called licoflavone C), abyssinone II (4), licochalcone C (5), and licochalcone A (6), by means of NMR (1D/2D) and MS analyses as well as comparison to the published data.43−49 Quantitative 1H NMR analysis was performed to estimate the relative abundance of each of the four compounds within fraction 8 as follows: 4 4.5% w/w, 3 5.1% w/w, 5 25.5% w/w, 6 64.8% w/w. Interestingly, 6, which is usually regarded as a the most relevant and species-specific bioactive marker of G. inflata, was devoid of any estrogenic activity in both assays (Figure 4B). Therefore, the estrogenic activities of the other three compounds were evaluated in the next step and showed that only 3 has significant activity in both the alkaline phosphatase induction and the ERβ-ERE-luciferase assays. 8-Prenylapigenin (3) has been reported previously to have estrogenic activity in MCF-7/BOS cells, which are ERα+ cells.43 However, the preference of 3 for ERβ has not been reported and provides additional evidence for considerations regarding the enhancement of the botanical safety profile of licorice preparations.
Figure 4.
(A) Bioassay-guided fractionation of G. inflata extract. The crude extract of G. inflata was fractionated by countercurrent chromatography. The different G. inflata fractions were tested for their estrogenic properties on both ERα and ERβ models. Fractions 8 and 10 displayed significant activity on both the ERα and ERβ models. Fraction 8, with the highest mass yield at 2.2% w/w crude extract (see Supporting Information), was further processed by semipreparative HPLC to isolate and identify four major compounds, namely, 8-prenylapigenin (3), licochalcone C (5), licochalcone A (6), and abyssinone II (4). (B) Induction of differential estrogenic activity with the isolated compounds from the active bioassay-guided fractions (A) in an alkaline phosphatase activity induction assay in Ishikawa cells (ERα) and in an ERβ-ERE-luciferase assay in MDA-MB-231/β41 cells. The methods for the Ishikawa and ERE-luciferase assays are described in the Experimental Section. The data represent the means ± SEM of three independent determinations.
While liquiritigenin (7) and its (pro-drug) bioequivalent glycosylated derivatives26,50 are present in all licorice species and contribute to the estrogenic activity observed with these extracts, the presence of 3 could better explain the higher ERβ potency observed with G. inflata compared to G. glabra and G. uralensis. In order to evaluate this hypothesis, quantitation of 3 in all three Glycyrrhiza extracts was carried out by LC-MS/MS (Table 2). The quantitative data revealed that 3 was 33 times more concentrated in G. inflata compared to the other two Glycyrrhiza extracts. These data confirm that 3 plays a fundamental role in the high ERβ potency observed with G. inflata.
Cautionary Tale: Importance of the Characterization of Purchased Standards
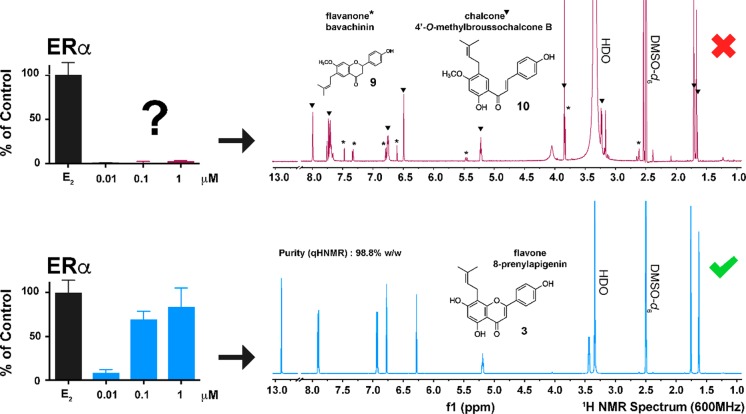
As the steps of the bioassay-guided fractionation were undertaken and the compounds were isolated and characterized in limited amounts, the acquisition of reference standards became necessary to enable the thorough study of the pharmacological activities of the isolated 8-prenylapigenin (3). The first reference material of 3 was acquired commercially from a recognized vendor and was immediately subject to biological testing for its estrogenic properties. However, to our surprise, no estrogenic activity was observed, leading to initial questioning of the bioassay-guided fractionation results altogether (Figure 5A). However, in-depth NMR and MS analyses of this commercial reference material demonstrated that the material in fact consisted of an adulteration, identified as a mixture of the chalcone 4′-O-methylbroussochalcone B (10) and its flavanone isomer, bavachinin (9) (Figure 5A and associated content).43,47−49 Interestingly, both 3 and 10 have the same molecular mass but a different molecular formula. Hence performance of HR-MS analysis was an integral part of the quality control measures, aimed at assuring the botanical integrity for the overall study. A second batch of “pure” 3 was purchased from a second company, and in-house quality control combining NMR and HR-MS (see associated content) was performed to verify the identity and determine the purity of the material. This successfully authenticated batch of 3 (purity 98.8% w/w, determined by the 100% method) displayed the expected estrogenic activity in the alkaline phosphatase induction assay (Figure 5B). Collectively, these results emphasize once more the fundamental need for the implementation of a rigorous quality control element for chemical authentication (verification of identity and purity determination) of commercial standards intended to be tested in bioassays.51 Such measures are prerequisites to ensure that in vitro and in vivo evaluations of pure and more complex plant natural products and their formulations can be performed with botanical integrity (https://nccih.nih.gov/research/policies/naturalproduct.htm).
Figure 5.
Comparative estrogenic activity and qHNMR analysis of commercial 8-prenylapigenin (3) samples. (A) The first commercial compound, identified by NMR (and MS/MS) analyses as being 4′-O-methylbroussochalcone B (10) (triangle highlight within the NMR spectrum). The 1H NMR spectrum of the adulterated commercial compound also displays proton resonances belonging to its flavanone isomer, bavachinin (9). (B) The second commercial compound, identified by NMR (and MS) analyses, had the expected estrogenic activity. The purity of 8-prenylapigenin (3) was found to be 98.8% using the qHNMR 100% method.
Differential Activation of the ER Subtypes by 8-Prenylapigenin and Known Phytoestrogens
In order to define the ER subtype selectivity of 3 in comparison to known phytoestrogens including 8-prenylnaringenin (2) from Humulus lupulus (hops) and genistein (1) from Trifolium pratense (red clover) and Glycine max (soy), the compounds were studied in the alkaline phosphatase induction assay in Ishikawa cells (ERα+) and in the ERβ-ERE-luciferase assay in MDA-MB-231/β41 cells (ERβ+). 8-Prenylnaringenin (2) exhibited the highest potency in the alkaline phosphatase induction assay, followed by 3 and 1 (Table 1, Figure 6A). When studied in the ERβ-ERE-luciferase assay, 1 exhibited the highest potency, followed by 3 and 2 (Table 1, Figure 6B). The comparison of the potencies obtained in Figure 6A and B suggested a 14-fold selectivity with 3 and a 100-fold selectivity with 1 for ERβ. Liquiritigenin (7), the estrogenic compound common to all three licorice species, did not show selectivity for either of the receptors (data not shown), which further demonstrated the role of 3 in the high ERβ potency of G. inflata. It should be noted that a previous report suggested ERβ selectivity for 7 in MCF-7 cells transfected with ERα and/or ERβ, which could be related to the cell type they used. Additionally, the difference in the abundance of 7 in the three licorice extracts is not as large as the abundance of 3, which is 33 times more concentrated in G. infata. Therefore, based on our observations 3 is most likely responsible for the high ERβ potency of G. inflata and might enhance the safety profile of this extract compared to G. glabra and G. uralensis. While 1 has ERβ preferential activity in various in vitro studies, its in vivo data are controversial and some uterine proliferation effects have been reported in certain concentration ranges.52,53 Therefore, in order to establish the safety of G. inflata and the role of its ERβ preferential ligand, 8-prenylapigenin (3), in vivo studies are warranted.
Figure 6.
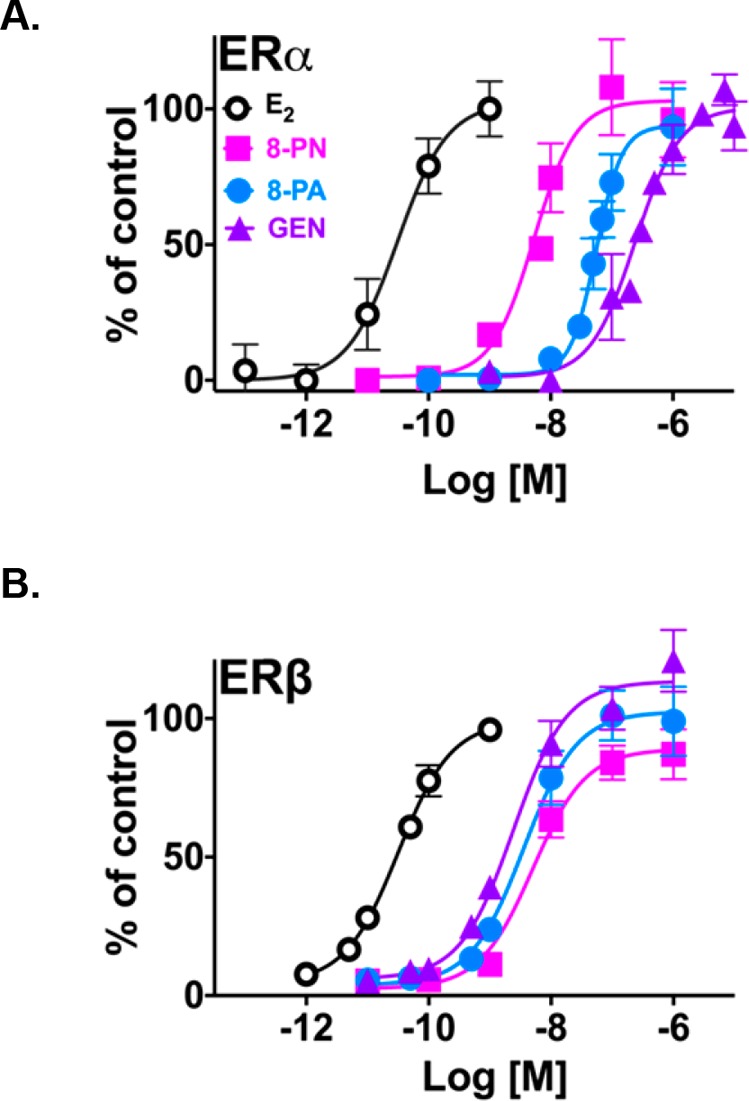
Induction of differential estrogenic activity with 8-prenylapigenin (3) (blue, filled circles) compared to E2 (black, open circles) and the known phytoestrogens genistein (1) (purple, filled triangles) and 8-prenylnaringenin (2) (pink, filled squares) in (A) an ERα-dependent alkaline phosphatase activity induction assay in Ishikawa cells and (B) an ERβ-ERE-luciferase assay in MDA-MB-231/β41 cells. The methods for the Ishikawa and ERE-luciferase assays are described in the Experimental Section. The data represent the means ± SEM of three independent determinations.
Concluding Remarks
Botanical dietary supplements have become increasingly popular among menopausal women for the alleviation of menopausal symptoms, and establishing their potential efficacy as well as their safety profiles is an important area of research. While estrogenic effects are essential for relieving menopausal discomfort especially hot flashes and night sweats, studies have suggested that ERα-dependent estrogenic activity could be associated with enhanced tissue proliferation and hormonal carcinogenesis. In contrast, ERβ-dependent estrogenic effects may oppose ERα-dependent proliferation and enhance the safety profile. Therefore, botanical supplements with preferential ERβ effects could be beneficial for menopausal women. G. inflata and its active compound 8-prenylapigenin (3) with their observed ERβ effects along with ERα activities could be considered a safer licorice species for menopausal symptom relief, compared to the other licorice species (i.e., G. glabra and G. uralensis). Future in vivo studies are needed to define the clinical relevance of the present in vitro findings. This study also presents an important cautionary note with regard to the pitfalls of natural products with compromised integrity, specifically with misidentified and/or sufficiently impure compounds. This potential culprit adds to the more well-attended adulteration of crude botanicals and equally affects good research practices in the field of botanicals. Recognition of these pharmacognostic base parameters is particularly important for researchers and trainees in natural product chemistry, to increase their vigilance when they acquire chemical standards for their research. While many vendors provide quality products with reliable certificates of analysis, it is still crucial to perform full authentication (i.e., structure verification and purity determination) of commercially available compounds prior to their application in expensive biological and clinical studies.
Experimental Section
Chemicals and Reagents
Estradiol (E2), 8-prenylnaringenin (2), genistein (1), and licochalcone A (6) were obtained from Sigma-Aldrich (St. Louis, MO, USA). 8-Prenylapigenin (3) was initially purchased from ChemFaces (Wuhan, Hubei, People’s Republic of China), which was misidentified, and then obtained from Ryan Scientific Inc. (Mount Pleasant, SC, USA). 2,3-Bis(4-hydroxyphenyl)propionitrile (DPN) and 4,4′,4″-(4-propyl-[1H]-pyrazole-1,3,5-triyl)trisphenol (PPT) were purchased from Cayman Chemical (Ann Arbor, MI, USA). All cell culture materials were obtained from Fisher Scientific (Itasca, IL, USA), Sigma-Aldrich (St. Louis, MO, USA), and Invitrogen (Grand Island, NY, USA) unless otherwise stated.
Botanical Extract Preparations
Licorice (G. glabra, G. uralensis, and G. inflata) extracts were prepared as described previously.26 Dried root samples of G. glabra and G. uralensis were purchased from a local supplier in Chicago, IL, and the Indiana Botanical Garden, respectively. The G. inflata sample was a gift from Dr. Liang Zhao at Lanzhou Institute of Chemical Physics, CAS, and was collected in Kuga County, Xinjiang Province, People’s Republic of China. The three Glycyrrhiza species were identified by means of macroscopic/microscopic analyses as well as DNA barcoding and compared to voucher specimens from the Field Museum of Natural History (Chicago, IL).28 The powdered roots were extracted by maceration and percolation at room temperature with a solvent mixture composed of ethanol (200 USP proof), 2-propranol, and water (90:5:5, v/v) and a plant powder/volume of solvent ratio of 1/15. After concentration, the produced extract was freeze-dried, leading to an extraction yield of ∼10% (w/w) of the initial powdered roots.26,28,30
Fractionation of G. inflata Crude Extract
Fractionation of the crude G. inflata extract was performed by high-speed countercurrent separation (HSCCC) with the solvent system composed of hexanes–ethyl acetate–methanol–water (5:5:5:5 v/v) in an isocratic and descending mode (reversed-phase mode). An HSCCC Tauto TBE-300B (Shanghai Tauto Biotech Co., Ltd., Shanghai, People’s Republic of China) integrated with the Cherry-One automated CCS system (Cherry Instruments, Chicago, IL, USA) was filled with the organic upper phase (UP) at a flow rate of 3 mL/min at 200 rpm. The system was then equilibrated at a flow rate of 1.5 mL/min, leading to an Sf of 88% (VS = 256 mL and Vm = 34 mL) with a rotation speed adjusted to 800 rpm. G. inflata crude extract (521.48 mg), diluted in 2 mL of UP and 2 mL of lower phase (LP), was injected into the column. Fraction collection was set up for 7.5 mL/fraction. The extrusion was performed after 2.6 column volumes. A total of 100 tubes were collected. The fractions were pooled according to their TLC profiles, leading to a total of 17 final fractions, defined as follows: fraction 1, vials 25–29; fraction 2, vials 30–31; fraction 3, vials 32–33; fraction 4, vials 34–36; fraction 5, vials 37–39; fraction 6, vials 40–42; fraction 7, vials 43–45; fraction 8, vials 46–53; fraction 9, vials 54–56; fraction 10, vials 58–65; fraction 11, vials 66–72; fraction 12, vials 66–72; fraction 13, vials 76–78; fraction 14, vials 79–81; fraction 15, vials 82–83; fraction 16, vials 84–85; fraction 17, vials 85–100. All TLC was performed on Alugram silica gel plates (SiO2 F254, Macherey-Nagel), eluted with CHCl3–MeOH (90:10, v/v) and visualized with 5% H2SO4/vanillin reagent. All the fractions were dried in order to calculate the weight recovery as % weight fraction/weight crude extract. Because of their very low final amount, fractions 9 and 10 were pooled together, yielding fraction 10; likewise fractions 11, 12, and 13 were pooled to give fraction 12.
Isolation and Dereplication of Compounds from Fraction 8
Abyssinone II (4), 8-prenylapigenin (3), licochalcone C (5), and licochalcone A (6) were isolated from fraction 8 by semipreparative HPLC performed on a Waters 600 instrument using a photodiode array detector. The separation was performed on a YMC- Pack ODS AQ column (250 × 10 mm, 5 μm, part no. 102500531) utilizing an isocratic elution mode with 58% acetonitrile in water and a flow rate of 1.8 mL/min (see Supporting Information). Under these conditions, 4 was eluted at 28 min, 3 at 31.6 min, 5 at 36 min, and 6 at 38 min. The fraction was prepared at 28 mg/mL, and 100 μL of solution was injected at each semipreparative run. The identity of all compounds was confirmed by means of MS/MS, (1D and 2D) NMR analyses (see Supporting Information and a freely available NMR data set at Harvard Dataverse (https://doi.org/10.7910/DVN/JZOL2U), and comparison with published data.43−45
Confirmation of the Identity and Purity of Commercial Standards
The authentication of commercial standards (verification of identity and purity) was performed by both LC-MS/MS and qHNMR analyses. For NMR analysis, approximately 1 mg of each sample was precisely weighed, whenever possible, with a Mettler Toledo XS105 Dual Range analytical balance and diluted in 200 μL of DMSO-d6 (D 99.9%, Cambridge Isotope Laboratories Inc., Andover, MA, USA). The solution was then transferred with calibrated glass pipets into 3 mm standard NMR tubes (Norell part no. S-3-HT-7, Norell Inc., Landisville, NJ, USA). The 1D 1H NMR spectra were acquired at 298 K under quantitative conditions (qHNMR) using a 90° excitation pulse experiment (Bruker pulprog: zg), on a Bruker AVANCE 900 MHz equipped with a 5 mm CPTCI probe, and/or on a Bruker AVANCE 600.13 MHz spectrometer equipped with a 5 mm TXI cryoprobe. The 90° pulse width for each sample was determined by prorating the measured 360° pulse width (p90 = 1/4 × p360). The probe was frequency tuned and impedance matched before each acquisition. For each sample, 32 scans (ns) and four dummy scans (ds) were recorded with the following parameters: pulse width (P1) of typically 10.65 μs (90° at 900 MHz) and 9.20 μs, spectral width of 30 ppm, relaxation delay (D1) of 30–60 s. Off-line data processing was performed using the Mnova NMR software package (v.6.0.2, MestreLab Research S.L., A Coruña, Spain). 1H and 13C chemical shifts (δ) were expressed in ppm with reference to the residual solvent signal (DMSO-d5: 1H spectrum: 2.500 ppm). The following processing scheme was used: a mild Lorentzian-to-Gaussian window function (line broadening = −0.3 Hz, Gaussian factor = 0.01) was applied, followed by zero filling to 256K acquired data points before Fourier transformation. After manual phasing, a fifth-order polynomial baseline correction was applied.
LC-MS/MS analysis was carried out using a Waters 2695 solvent delivery system connected to a Waters SYNAPT quadrupole/time-of-flight (q/TOF) mass spectrometer operated in the positive ion electrospray mode. Separations were carried out using a YMC AQ C18 column (2 × 100 mm, 3 μm particle size), eluted with a mobile phase consisting of 0.1% formic acid (solvent A) and acetonitrile (solvent B) with a linear gradient from 10% to 95% B over 30 min. The flow rate was 0.2 mL/min and the column was thermostated at 30 °C. Mass spectrometric measurements were carried out at 10 000 resolving power (fwhm) using leu-enkelphalin as the lock mass. For identification, molecular compositions and tandem mass spectra were compared with the standard spectra from public (MassBank, MoNA) and in-house-generated databases as well as with spectra published in the primary literature.43−45
The purity determination of each commercial compound was performed as described previously using the 100% qHNMR method.54 Hence the purity of the commercial phytochemicals was calculated to be 95.90% w/w for 8-prenylnaringenin, (±)-(2) (Sigma), 95.49% w/w for licochalcone A (6) (Sigma), 99.51% w/w for genistein (1) (Sigma), and 98.84% w/w for 8-prenylapigenin (3) (Ryan Scientific, Mt. Pleasant, SC, USA) (see Supporting Information for 8-prenylapigenin (3) and the freely available NMR data set at doi: 10.7910/DVN/JZOL2U).
Quantitative Analysis of Tested Licorice Extracts
Quantitative UHPLC-UV analyses were performed on licorice extracts in order to determine the level (in % w/w) of liquiritigenin (7) equivalents, isoliquiritigenin (8) equivalents, and the amount of G. inflata species-specific licochalcone A (6), as previously described (Table 2).50 In addition, 3 was quantified using HPLC-MS/MS with CID and selected reaction monitoring (SRM). The analyses were carried out on a Shimadzu (Kyoto, Japan) LC-MS-8050 triple quadrupole mass spectrometer equipped with a Shimadzu Nexera UHPLC system and Waters Xbridge C18 column (2.5 × 50 mm, 3 μm). The mobile phase consisted of a 10 min linear gradient from 35% to 70% acetonitrile in water containing 0.1% formic acid. The flow rate was 0.3 mL/min, and the column oven temperature was 45 °C. The negative ion electrospray SRM transitions for 3 were m/z 337 to 281 and 337 to 293 (quantifier and qualifier, respectively) and 353 to 119 for internal standard xanthohumol. The collision energy was 28 eV, and the SRM dwell time was 20 ms per transition.
For the preparation of calibration curves, authenticated commercial 3 (Ryan Scientific) was diluted with 50% CH3CN/water to produce a calibration curve from 10 to 500 nM. Llicorice crude extracts were prepared at 0.1 mg/mL in 70% acetonitrile, and 3 μL was injected for analysis.
Cell Culture Conditions
The ERα endometrial carcinoma cells (Ishikawa) were provided by Dr. R. B. Hochberg (Yale University, New Haven, CT, USA) and were maintained in Dulbecco’s modified Eagle’s medium (DMEM/F12) containing 1% sodium pyruvate, 1% nonessential amino acids (NEAA), 1% Glutamax-1, 0.05% insulin, and 10% heat-inactivated fetal bovine serum (FBS) as described previously.26 An estrogen-free medium was prepared similarly but by using phenol-red-free medium and 10% charcoal-stripped FBS.
The MDA-MB-231/β41 breast carcinoma cell line, stably transfected with ERβ, was a gift from Dr. Debra Tonetti (University of Illinois at Chicago, Chicago, IL, USA) and was maintained in phenol-red-free modified Eagle’s medium (MEM) containing 1% NEAA, 1% Glutamax, 1% antibiotic/antimycotic, 5% charcoal stripped calf serum, and 0.05% insulin.38
The concentrations of the extracts and compounds did not result in significant cell death in these experimental conditions. All DMSO concentrations for the cell culture assays were below 0.1%. All cell lines were authenticated and had well-defined STR profiles.
Estrogen-Responsive Alkaline Phosphatase Induction in Ishikawa Cells
The protocol used for the Ishikawa assay in Pisha and Pezzuto55 was used as previously described.26 Endometrial carcinoma Ishikawa cells were plated at 5 × 10⁴ cells/well in 96-well plates in estrogen-free medium for 24 h. Extracts and compounds were dissolved in DMSO and added at varying concentrations while ensuring that the DMSO concentration was less than 0.1%. After treatment, the plates were incubated at 37 °C for 96 h, then washed with phosphate-buffered saline (PBS) and lysed by adding 50 μL of 0.01% Triton X-100 in 0.1 M Tris buffer at pH 9.8, followed by a freeze and thaw cycle at −80 and 37 °C, respectively. The phosphatase substrate, p-nitrophenol phosphate, was added to each well, and the alkaline phosphatase activity was measured by assessing the presence of p-nitrophenol at 405 nm using a Power Wave 200 microplate scanning spectrophotometer (Bio-Tek Instruments, Winooski, VT, USA). The fold induction of alkaline phosphatase for each individual treatment, in comparison to the estradiol control (1 nM), denoted estrogenic activity and was calculated as previously described.26 In parallel, the cytotoxicity of the treatments was evaluated using sodium rhodamine B reagent, as described previously.26
ERβ-ERE-Luciferase Induction in MDA-MB-231/β41 Cells
Briefly, ERβ stably transfected MDA-MB-231/β41 cells were grown in phenol-red-free medium and plated at 4 × 10⁵ cells/mL in a 12-well plate. Following a 24 h incubation at 37 °C, the cells were washed with PBS and Opti-MEM medium was added for transfection. The cells were transfected with pERE-luciferase at 3 μg/mL and pRL-tK at 1 μg/mL for 6 h, then washed twice with PBS. The phenol-red-free MEM medium was added before treatment with extracts or compounds for 18 h. E2 (1 nM) and diarylpropionitirile, a selective ERβ agonist (1 μM), were used as positive controls. After the 18 h incubation at 37 °C, the cells were lysed with 1× cell lysis buffer and frozen at −80 °C for 10 min to 24 h. Once thawed, the cell lysates were collected in Eppendorf tubes and centrifuged at 14000g at 4 °C for 10 min, and then 20 μL of the supernatant was placed in white Costar 96-well plates. The plates were placed into the FLUOstar OPTIMA luminometer (BMG Lab Tech, Offenburg, Germany), where 100 μL of the luciferase reagent was injected into the wells followed by 100 μL of the Stop and Glo reagent to quench the firefly luciferase expression and activation of the Renilla vector. To account for transfection efficiency, the average read-out for the luciferase activity was normalized to the average of the Renilla (pRL-tK) activity. To convert the data to fold-induction, the results were normalized to the DMSO control.
The data obtained were the mean of three biological replicates and are stated as means ± SEM.
Acknowledgments
We are thankful to R. B. Hochberg for providing the Ishikawa cells and D. Tonetti for providing the ERβ stably transfected MDA-MB-231/β41 cells. This work was supported through grants P50 AT000155 and U41 AT008706 by NCCIH and ODS to the UIC/NIH Center for Botanical Dietary Supplements Research and CENAPT, respectively. Obinna Mbachu is grateful for the support through T32 AT 007533 from NCCIH/NIH. The funders had no role in study design, data collection and analysis, decision to publish, or preparation of the manuscript.
Supporting Information Available
The Supporting Information is available free of charge on the ACS Publications website at DOI: 10.1021/acs.jnatprod.7b01070.
Semipreparative HPLC chromatogram associated with the isolation of 8-prenylapigenin, abyssinone II, licochalcone C, and licochalcone A (S1), as well as the annotated 1H/ 13C NMR spectra and MS spectra of 8-prenylapigenin (S2) and 4′-O-methylbroussochalcone B (S3), the 1H/13C NMR data of abyssinone II (S4), and licochalcone C (S5) assigned 1H NMR spectra (PDF)
Author Contributions
§ A. Hajirahimkhan and O. Mbachu contributed equally to this publication.
The authors declare no competing financial interest.
Notes
The original NMR data and the iterative full-spin analyses (HiFSA) of 8-prenylapigenin, 4′-O-methylbroussochalcone B and its isomer bavachinin, abyssinone II, and licochalcone C are also available at https://doi.org/10.7910/DVN/JZOL2U.
Supplementary Material
References
- Hajirahimkhan A.; Dietz B. M.; Bolton J. L. Planta Med. 2013, 79, 538–553. 10.1055/s-0032-1328187. [DOI] [PMC free article] [PubMed] [Google Scholar]
- Jia M.; Dahlman-Wright K.; Gustafsson J. A. Best Prac. Res. Clinical Endocrinol. Metab. 2015, 29, 557–568. 10.1016/j.beem.2015.04.008. [DOI] [PubMed] [Google Scholar]
- Lobo R. A. Nat. Rev. Endocrinol. 2017, 13, 220–231. 10.1038/nrendo.2016.164. [DOI] [PubMed] [Google Scholar]
- Chlebowski R. T.; Manson J. E.; Anderson G. L.; Cauley J. A.; Aragaki A. K.; Stefanick M. L.; Lane D. S.; Johnson K. C.; Wactawski-Wende J.; Chen C.; Qi L.; Yasmeen S.; Newcomb P. A.; Prentice R. L. J. Natl. Cancer Inst. 2013, 105, 526–535. 10.1093/jnci/djt043. [DOI] [PMC free article] [PubMed] [Google Scholar]
- Manson J. Women's Health 2014, 10, 125–128. 10.2217/WHE.14.6. [DOI] [PMC free article] [PubMed] [Google Scholar]
- Rossouw J. E.; Anderson G. L.; Prentice R. L.; LaCroix A. Z.; Kooperberg C.; Stefanick M. L.; Jackson R. D.; Beresford S. A.; Howard B. V.; Johnson K. C.; Kotchen J. M.; Ockene J. JAMA, J. Am. Med. Assoc. 2002, 288, 321–333. 10.1001/jama.288.3.321. [DOI] [PubMed] [Google Scholar]
- Huang B.; Warner M.; Gustafsson J. A. Mol. Cell. Endocrinol. 2015, 418, 240–244. 10.1016/j.mce.2014.11.015. [DOI] [PubMed] [Google Scholar]
- Sareddy G. R.; Vadlamudi R. K. Chin. J. Nat. Med. 2015, 13, 801–807. 10.1016/S1875-5364(15)30083-2. [DOI] [PMC free article] [PubMed] [Google Scholar]
- Shanle E. K.; Xu W. Adv. Drug Delivery Rev. 2010, 62, 1265–1276. 10.1016/j.addr.2010.08.001. [DOI] [PMC free article] [PubMed] [Google Scholar]
- Thomas C.; Gustafsson J. A. Nat. Rev. Cancer 2011, 11, 597–608. 10.1038/nrc3093. [DOI] [PubMed] [Google Scholar]
- Marzagalli M.; Marelli M. M.; Casati L.; Fontana F.; Moretti R. M.; Limonta P. Front. Endocrinol. 2016, 7, 140. 10.3389/fendo.2016.00140. [DOI] [PMC free article] [PubMed] [Google Scholar]
- Leung Y. K.; Lee M. T.; Lam H. M.; Tarapore P.; Ho S. M. Steroids 2012, 77, 727–737. 10.1016/j.steroids.2012.03.008. [DOI] [PMC free article] [PubMed] [Google Scholar]
- Omoto Y.; Iwase H. Cancer Sci. 2015, 106, 337–343. 10.1111/cas.12613. [DOI] [PMC free article] [PubMed] [Google Scholar]
- Jarry H.; Spengler B.; Porzel A.; Schmidt J.; Wuttke W.; Christoffel V. Planta Med. 2003, 69, 945–947. 10.1055/s-2003-45105. [DOI] [PubMed] [Google Scholar]
- Setchell K. D.; Clerici C.; Lephart E. D.; Cole S. J.; Heenan C.; Castellani D.; Wolfe B. E.; Nechemias-Zimmer L.; Brown N. M.; Lund T. D.; Handa R. J.; Heubi J. E. Am. J. Clin. Nutr. 2005, 81, 1072–1079. 10.1093/ajcn/81.5.1072. [DOI] [PubMed] [Google Scholar]
- Overk C. R.; Yao P.; Chadwick L. R.; Nikolic D.; Sun Y.; Cuendet M. A.; Deng Y.; Hedayat A. S.; Pauli G. F.; Farnsworth N. R.; van Breemen R. B.; Bolton J. L. J. Agric. Food Chem. 2005, 53, 6246–6253. 10.1021/jf050448p. [DOI] [PMC free article] [PubMed] [Google Scholar]
- Harris D. M.; Besselink E.; Henning S. M.; Go V. L.; Heber D. Exp. Biol. Med. 2005, 230, 558–568. 10.1177/153537020523000807. [DOI] [PubMed] [Google Scholar]
- Chang E. C.; Charn T. H.; Park S. H.; Helferich W. G.; Komm B.; Katzenellenbogen J. A.; Katzenellenbogen B. S. Mol. Endocrinol. 2008, 22, 1032–1043. 10.1210/me.2007-0356. [DOI] [PMC free article] [PubMed] [Google Scholar]
- van Meeuwen J. A.; Korthagen N.; de Jong P. C.; Piersma A. H.; van den Berg M. Toxicol. Appl. Pharmacol. 2007, 221, 372–383. 10.1016/j.taap.2007.03.016. [DOI] [PubMed] [Google Scholar]
- Booth N.; Overk C. R.; Yao P.; Burdette J. E.; Nikolic D.; Chen S. N.; Bolton J. L.; Van Breemen R. B.; Pauli G. F.; Farnsworth N. R. J. Altern. Complement. Med. 2006, 12, 133–139. 10.1089/acm.2006.12.133. [DOI] [PMC free article] [PubMed] [Google Scholar]
- Overk C. R.; Guo J.; Chadwick L. R.; Lantvit D. D.; Minassi A.; Appendino G.; Chen S. N.; Lankin D. C.; Farnsworth N. R.; Pauli G. F.; van Breemen R. B.; Bolton J. L. Chem.-Biol. Interact. 2008, 176, 30–39. 10.1016/j.cbi.2008.06.005. [DOI] [PMC free article] [PubMed] [Google Scholar]
- Song W. O.; Chun O. K.; Hwang I.; Shin H. S.; Kim B. G.; Kim K. S.; Lee S. Y.; Shin D.; Lee S. G. J. Med. Food 2007, 10, 571–580. 10.1089/jmf.2006.0620. [DOI] [PubMed] [Google Scholar]
- Dietz B. M.; Hajirahimkhan A.; Dunlap T. L.; Bolton J. L. Pharmacol. Rev. 2016, 68, 1026–1073. 10.1124/pr.115.010843. [DOI] [PMC free article] [PubMed] [Google Scholar]
- Asl M. N.; Hosseinzadeh H. Phytother. Res. 2008, 22, 709–724. 10.1002/ptr.2362. [DOI] [PMC free article] [PubMed] [Google Scholar]
- Kondo K.; Shiba M.; Nakamura R.; Morota T.; Shoyama Y. Biol. Pharm. Bull. 2007, 30, 1271–1277. 10.1248/bpb.30.1271. [DOI] [PubMed] [Google Scholar]
- Hajirahimkhan A.; Simmler C.; Yuan Y.; Anderson J. R.; Chen S. N.; Nikolic D.; Dietz B. M.; Pauli G. F.; van Breemen R. B.; Bolton J. L. PLoS One 2013, 8, e67947. 10.1371/journal.pone.0067947. [DOI] [PMC free article] [PubMed] [Google Scholar]
- Liu J.; Burdette J. E.; Xu H.; Gu C.; van Breemen R. B.; Bhat K. P.; Booth N.; Constantinou A. I.; Pezzuto J. M.; Fong H. H.; Farnsworth N. R.; Bolton J. L. J. Agric. Food Chem. 2001, 49, 2472–2479. 10.1021/jf0014157. [DOI] [PubMed] [Google Scholar]
- Simmler C.; Anderson J. R.; Gauthier L.; Lankin D. C.; McAlpine J. B.; Chen S. N.; Pauli G. F. J. Nat. Prod. 2015, 78, 2007–2022. 10.1021/acs.jnatprod.5b00342. [DOI] [PMC free article] [PubMed] [Google Scholar]
- Madak-Erdogan Z.; Gong P.; Zhao Y. R. C.; Xu L. W.; Wrobel K. U.; Hartman J. A.; Wang M.; Cam A.; Iwaniec U. T.; Turner R. T.; Twaddle N. C.; Doerge D. R.; Khan I. A.; Katzenellenbogen J. A.; Katzenellenbogen B. S.; Helferich W. G. Mol. Nutr. Food Res. 2016, 60, 369–380. 10.1002/mnfr.201500445. [DOI] [PMC free article] [PubMed] [Google Scholar]
- Simmler C.; Jones T.; Anderson J. R.; Nikolic D. C.; van Breemen R. B.; Soejarto D. D.; Chen S. N.; Pauli G. F. Phytochem. Anal. 2014, 25, 378–388. 10.1002/pca.2472. [DOI] [PMC free article] [PubMed] [Google Scholar]
- Mersereau J. E.; Levy N.; Staub R. E.; Baggett S.; Zogovic T.; Chow S.; Ricke W. A.; Tagliaferri M.; Cohen I.; Bjeldanes L. F.; Leitman D. C. Mol. Cell. Endocrinol. 2008, 283, 49–57. 10.1016/j.mce.2007.11.020. [DOI] [PMC free article] [PubMed] [Google Scholar]
- Boonmuen N.; Gong P.; Ali Z.; Chittiboyina A. G.; Khan I.; Doerge D. R.; Helferich W. G.; Carlson K. E.; Martin T.; Piyachaturawat P.; Katzenellenbogen J. A.; Katzenellenbogen B. S. Steroids 2016, 105, 42–49. 10.1016/j.steroids.2015.11.006. [DOI] [PMC free article] [PubMed] [Google Scholar]
- Jiang Y.; Gong P.; Madak-Erdogan Z.; Martin T.; M J.; Carlson K.; Khan I.; Smillie T. J.; Chittiboyina A. G.; Rotte S. C. K.; Helferich W. G.; Katzenellenbogen J. A.; Katzenellenbogen B. S. FASEB J. 2013, 27, 4406–4418. 10.1096/fj.13-234617. [DOI] [PMC free article] [PubMed] [Google Scholar]
- Nomura T.; Fukai T.; Akiyama T. Pure Appl. Chem. 2002, 74, 1199–1206. 10.1351/pac200274071199. [DOI] [Google Scholar]
- Simons R.; Vincken J. P.; Mol L. A. M.; The S. A. M.; Bovee T. F. H.; Luijendijk T. J. C.; Verbruggen M. A.; Gruppen H. Anal. Bioanal. Chem. 2011, 401, 305–313. 10.1007/s00216-011-5061-9. [DOI] [PMC free article] [PubMed] [Google Scholar]
- Hevir-Kene N.; Rizner T. L. Chem.-Biol. Interact. 2015, 234, 309–319. 10.1016/j.cbi.2014.11.015. [DOI] [PubMed] [Google Scholar]
- Zhang J.; Xu H.; Zhou X.; Li Y.; Liu T.; Yin X.; Zhang B. Oncol. Lett. 2017, 14, 4949–4956. 10.3892/ol.2017.6877. [DOI] [PMC free article] [PubMed] [Google Scholar]
- Tonetti D. A.; Rubenstein R.; DeLeon M.; Zhao H.; Pappas S. G.; Bentrem D. J.; Chen B.; Constantinou A.; Jordan C. V. J. Steroid Biochem. Mol. Biol. 2003, 87, 47–55. 10.1016/j.jsbmb.2003.07.003. [DOI] [PubMed] [Google Scholar]
- Carroll V. M.; Jeyakumar M.; Carlson K. E.; Katzenellenbogen J. A. J. Med. Chem. 2012, 55, 528–537. 10.1021/jm201436k. [DOI] [PMC free article] [PubMed] [Google Scholar]
- Harris H. A.; Katzenellenbogen J. A.; Katzenellenbogen B. S. Endocrinology 2002, 143, 4172–4177. 10.1210/en.2002-220403. [DOI] [PubMed] [Google Scholar]
- Stauffer S. R.; Coletta C. J.; Tedesco R.; Nishiguchi G.; Carlson K.; Sun J.; Katzenellenbogen B. S.; Katzenellenbogen J. A. J. Med. Chem. 2000, 43, 4934–4947. 10.1021/jm000170m. [DOI] [PubMed] [Google Scholar]
- Hu C.; Liu H.; Du J.; Mo B.; Qi H.; Wang X.; Ye S.; Li Z. J. Steroid Biochem. Mol. Biol. 2009, 113, 209–216. 10.1016/j.jsbmb.2008.12.019. [DOI] [PubMed] [Google Scholar]
- Dong X.; Fan Y.; Yu L.; Hu Y. Arch. Pharm. 2007, 340, 372–376. 10.1002/ardp.200700057. [DOI] [PubMed] [Google Scholar]
- Edziri H.; Mastouri M.; Mahjoub M. A.; Mighri Z.; Mahjoub A.; Verschaeve L. Molecules 2012, 17, 7284–7293. 10.3390/molecules17067284. [DOI] [PMC free article] [PubMed] [Google Scholar]
- Lin Y.; Kuang Y.; Li K.; Wang S.; Ji S.; Chen K.; Song W.; Qiao X.; Ye M. Bioorg. Med. Chem. 2017, 25, 5522–5530. 10.1016/j.bmc.2017.08.018. [DOI] [PubMed] [Google Scholar]
- Xu M. J.; Wu B.; Ding T.; Chu J. H.; Li C. Y.; Zhang J.; Wu T.; Wu J.; Liu S. J.; Liu S. L.; Ju W. Z.; Li P. Rapid Commun. Mass Spectrom. 2012, 26, 2343–2358. 10.1002/rcm.6361. [DOI] [PubMed] [Google Scholar]
- Lee M. H.; Kim J. Y.; Ryu J. H. Biol. Pharm. Bull. 2005, 28, 2253–2257. 10.1248/bpb.28.2253. [DOI] [PubMed] [Google Scholar]
- Jain A. C.; Lal P.; Seshadri T. R. Tetrahedron 1970, 26, 2631–2635. 10.1016/S0040-4020(01)92837-6. [DOI] [Google Scholar]
- Du G.; Feng L.; Yang Z.; Shi J.; Huang C.; Guo F.; Li B.; Zhu W.; Li Y. Bioorg. Med. Chem. Lett. 2015, 25, 2579–2583. 10.1016/j.bmcl.2015.04.029. [DOI] [PubMed] [Google Scholar]
- Hajirahimkhan A.; Simmler C.; Dong H.; Lantvit D. D.; Li G.; Chen S. N.; Nikolic D.; Pauli G. F.; van Breemen R. B.; Dietz B. M.; Bolton J. L. Chem. Res. Toxicol. 2015, 28, 2130–2141. 10.1021/acs.chemrestox.5b00310. [DOI] [PMC free article] [PubMed] [Google Scholar]
- Baker M. Nature 2017, 548, 485–488. 10.1038/548485a. [DOI] [PubMed] [Google Scholar]
- Rimoldi G.; Christoffel J.; Seidlova-Wuttke D.; Jarry H.; Wuttke W. Environ. Health Perspect. 2007, 115, 62–68. 10.1289/ehp.9367. [DOI] [PMC free article] [PubMed] [Google Scholar]
- Jaric I.; Zivanovic J.; Miler M.; Ajdzanovic V.; Blagojevic D.; Ristic N.; Milosevic V.; Nestorovic N. Toxicol. Appl. Pharmacol. 2017, 339, 73–84. 10.1016/j.taap.2017.12.001. [DOI] [PubMed] [Google Scholar]
- Pauli G. F.; Chen S. N.; Simmler C.; Lankin D. C.; Godecke T.; Jaki B. U.; Friesen J. B.; McAlpine J. B.; Napolitano J. G. J. Med. Chem. 2014, 57, 9220–9231. 10.1021/jm500734a. [DOI] [PMC free article] [PubMed] [Google Scholar]
- Pisha E.; Pezzuto J. M. Methods Cell Sci. 1997, 19, 37–43. 10.1023/A:1009746605060. [DOI] [Google Scholar]
Associated Data
This section collects any data citations, data availability statements, or supplementary materials included in this article.


