

Abstract
Aldehyde dehydrogenase 7A1 (ALDH7A1) catalyzes the terminal step of lysine catabolism, the NAD+-dependent oxidation of α-aminoadipate semialdehyde to α-aminoadipate. Structures of ALDH7A1 reveal the C-terminus is a gate that opens and closes in response to the binding of α-aminoadipate. In the closed state, the C-terminus of one protomer stabilizes the active site of the neighboring protomer in the dimer-of-dimers tetramer. Specifically, Ala505 and Gln506 interact with the conserved aldehyde anchor loop structure in the closed state. The apparent involvement of these residues in catalysis is significant because they are replaced by Pro505 and Lys506 in a genetic deletion (c.1512delG) that causes pyridoxine-dependent epilepsy. Inspired by the c.1512delG defect, we generated variant proteins harboring either A505P, Q506K, or both mutations (A505P/Q506K). Additionally, a C-terminal truncation mutant lacking the last eight residues was prepared. The catalytic behaviors of the variants were examined in steady-state kinetic assays, and their quaternary structures were examined by analytical ultracentrifugation. The mutant enzymes exhibit a profound kinetic defect characterized by markedly elevated Michaelis constants for α-aminoadipate semialdehyde, suggesting that the mutated residues are important for substrate binding. Furthermore, analyses of the in-solution oligomeric states revealed that the mutant enzymes are defective in tetramer formation. Overall, these results suggest that the C-terminus of ALDH7A1 is crucial for the maintenance of both the oligomeric state and the catalytic activity.
Graphical abstract

The lysine catabolic pathway converts L-lysine to α-aminoadipate (AA). Aldehyde dehydrogenase 7A1 (ALDH7A1, also known as antiquitin) catalyzes the final step in this pathway, the NAD+-dependent oxidation of α-aminoadipate semialdehyde (AASAL) to α-aminoadipate (AA) (Figure 1A).
Figure 1.

Chemical reactions relevant to ALDH7A1 and PDE. (A) Reaction catalyzed by ALDH7A1. (B) Reaction between P6C and PLP, which results in covalent inactivation of PLP. P6C forms a nonenzymatic equilibrium with AASAL.
Mutations in the ALDH7A1 gene can cause pyridoxine-dependent epilepsy (PDE),1,2 a rare autosomal recessive disorder that typically presents with seizures in the first days of life. Compromised ALDH7A1 activity leads to increased levels of AASAL and Δ1-piperideine-6-carboxylic acid (P6C), the cyclized form of AASAL (Figure 1). P6C reacts with a ubiquitous cofactor, pyridoxal 5′-phosphate (PLP), and the resulting adduct is incapable as an enzyme cofactor (Figure 1B). PDE is evidently a consequence of the resulting inadequate levels of pyridoxal 5′-phosphate (PLP).3 Although seizures can be controlled with pharmacologic doses of pyridoxine (vitamin B6) and a lysine-restricted diet, 75% of PDE patients nevertheless suffer intellectual developmental disability.1 Dozens of ALDH7A1 mutations have been linked to PDE. At present, the majority of these are uncharacterized, an exception being a group of six mutations recently shown to abolish catalytic activity by altering oligomerization behavior.4 Knowledge of the structural and kinetic consequences of PDE-causing mutations may provide insight into the molecular basis of the disorder. An improved understanding of the disease pathology could ultimately allow for the prediction of symptom severity and development of patient-specific medical treatments.
Although the general catalytic mechanism of ALDHs is well-known,5 recent crystallographic studies of ALDH7A1 led to the novel suggestion that the C-terminus (residues 500–511) is a mobile structural element that plays a role in catalysis.6 Like other ALDH superfamily enzymes, ALDH7A1 has three domains: an N-terminal Rossmann fold NAD+-binding domain, a catalytic domain, and an oligomerization domain (Figure 2A). The C-terminus is part of the oligomerization domain, which mediates domain-swapped dimerization (Figure 2B) and tetramerization (Figure 2C). The crystal structures revealed opened and closed active sites that differ in the conformation of the C-terminus. In the closed state, observed when the product AA is bound, the C-terminal crook of one protomer of the dimer appears to stabilize the active site of the opposite protomer (Figure 2D). The C-terminal crook is defined as the elbowlike bend in the C-terminus that occurs from Pro503 to Ala507.6 In particular, Gln506 forms both a direct hydrogen bond with the conserved aldehyde anchor loop and a water-mediated hydrogen bond with the α-carboxylate of AA. The methyl group of Ala505 also packs tightly against the anchor loop. The open state is substantially different. In the absence of AA, the C-terminus rotates outward by 16 Å, creating a solvent-exposed active site (Figure 2B).6 The interpretation of these structures is that the active site is open in the resting state of the enzyme and closed in the E–AASAL–NAD+ Michaelis complex. A further inference is that AASAL binding facilitates the conformational changes that close the active site for catalysis.
Figure 2.

Structural and genetic contexts of the mutations studied. (A) Protomer of ALDH7A1 with the mutated residues Ala505 and Gln506 marked with spheres (PDB entry 4ZUL). The three domains are colored red (NAD+-binding), blue (catalytic), and green (oligomerization). The residues deleted in truncation mutant Δ504–511 are colored gold. The product AA is colored pink. (B) Superposition of the open and closed ALDH7A1 dimers [PDB entries 4ZUK (open) and 4ZUL (closed)]. The domains are colored as in panel A. The arrows indicate the 16 Å motion of the C-terminus from the open (out) to the closed (in) state. (C) Dimer-of-dimers tetramer of ALDH7A1. One protomer is colored according to domains as in panel A. The other three protomers have individual colors (aquamarine, gray, and violet). (D) Close-up of the quaternary structural interactions that stabilize the aldehyde-binding site in the closed state (AA complex, PDB entry 4ZUL). One protomer of the dimer is colored white, with bound AA colored pink. The C-terminus of the other protomer is colored gold. Note the interactions of Ala505 and Gln506 with the active site. This panel also includes a sequence alignment of the C-termini of wild-type ALDH7A1 and the c.1512delG deletion mutant, which has been implicated in PDE.
The discovery of the C-terminus as a mobile part of the active site is potentially relevant for understanding the c.1512delG frameshift mutation3 associated with PDE. Deletion of G1512 from exon 18 mutates six of the last seven amino acids of the wild-type polypeptide and extends the C-terminus by 10 residues (Figure 2D). Notably, Ala505 and Gln506 are mutated to Pro and Lys, respectively.
Herein, we test the importance of the C-terminus of human ALDH7A1 using site-directed mutagenesis. Three mutations inspired by c.1512delG were generated: single mutations A505P and Q506K and double mutation A505P/Q506K. C-Terminal truncation mutant Δ504–511, which lacks residues 504–511, was also generated. The variants were analyzed with steady-state kinetics assays and analytical ultracentrifugation. The truncation mutant was also analyzed with small-angle X-ray scattering (SAXS). The mutant enzymes exhibit a common phenotype characterized by a very high Km for AASAL and a perturbed self-association equilibrium. Overall, our results show that an intact C-terminus is essential for maximal catalytic efficiency and tetramerization and suggest that the c.1512delG variant is functionally compromised because of a defect in tetramer formation.
MATERIALS AND METHODS
Site-Directed Mutagenesis and Protein Production
The site-directed mutants of ALDH7A1 A505P, Q506K, and A505P/Q506K, were generated using the QuikChange method. Pfu Turbo DNA polymerase was purchased from Stratagene-Agilent. The primers used in mutagenesis (from Integrated DNA Technologies) are listed in Table S1. The mutations were confirmed by DNA sequencing. C-Terminal truncation mutant Δ504–511 was generated by introduction of a premature stop codon by site-directed mutagenesis using the QuikChange Lightning site-directed mutagenesis kit (Agilent). Primers are listed in Table S1.
Expression and purification of wild-type and mutant enzymes followed the protocols described previously for the wild-type enzyme.7 Briefly, cell cultures were grown at 37 °C and 250 rpm and induced with 0.2 mM isopropyl β-D-1-thiogalactopyranoside when the OD600 reached 0.8. Induction was performed for 18 h at 18 °C and 200 rpm. Cells were harvested and resuspended in a buffer containing 50 mM Hepes (pH 8.0), 200 mM NaCl, 10 mM imidazole, and 5% (v/v) glycerol. Following purification by immobilized Ni2+-affinity chromatography, the His tag was removed with tobacco etch virus protease, and the protein was dialyzed into 50 mM Hepes, 100 mM NaCl, and 5% (v/v) glycerol (pH 7.8). Size exclusion chromatography was then performed using a Superdex 200 column. The pooled fractions were concentrated and stored at −80 °C in 50 mM Hepes (pH 7.8), 100 mM NaCl, 5% (v/v) glycerol, and 5 mM dithiothreitol.
Mass Spectrometry
The sequences of the ALDH7A1 variants were confirmed by mass spectrometry. Nano LC-Nanospray QTOF MS analysis was performed on the ALDH7A1 variants at the University of Missouri Charles W. Gehrke Proteomics Center. Samples were prepared at a concentration of 5 mg/mL in 50 mM HEPES (pH 7.8), 100 mM NaCl, 5 mM dithiothreitol, and 5% glycerol. Each sample was diluted to 2 pmol/μL in a 30/970/1 (v/v/v) acetonitrile/water/99% formic acid mixture. A 0.1 μL aliquot was injected for fractionation and mass analysis by Nano LC on an Agilent Protein Chip column interfaced with a Nanospray QTOF MS instrument (Agilent 6520A MS). Prior to the sample analysis, the system was primed with an injection of cap pump solvent [2 μL of a 30/970/1 (v/v/v) acetonitrile/water/99% formic acid mixture].
From selected retention time windows of the total ion chromatograms, multiple-charge ion spectra were obtained. These spectra were deconvoluted with the maximum entropy algorithm, and its peaks were labeled with the peak height and calculated neutral average masses. Protparam8 was used to predict theoretical masses for the ALDH7A1 variants. The experimental masses were within 1 Da of the theoretical values, validating that site-directed mutagenesis was accurate (Table S2).
Synthesis of P6C/AASAL
P6C/AASAL was prepared using a modified version of the previously reported procedure.3,9 A 50 mg sample of L-allysine ethylene acetal (Sigma-Aldrich) was stirred with 800 mg of Amberlyst-15 (dry) ion-exchange resin (Sigma-Aldrich) in water (5 mL) for 30 min at 45 °C. The reaction mixture was filtered through a sintered funnel, and the resin was washed with water (5 mL). P6C/AASAL was eluted from the resin with 4 mL of a 28% ammonia solution. The filtrate was evaporated to dryness under a stream of nitrogen, producing a pale yellow solid.
P6C/AASAL was quantitated by reaction with o-aminobenzaldehyde (oAB). The synthesized P6C/AASAL sample was dissolved in 1 mL of 100 mM sodium pyrophosphate buffer (pH 8.0). A P6C/AASAL dilution series was incubated with 200 μM oAB in a total volume of 1 mL for 1 h at 37 °C. The concentration of the P6C–oAB reaction product was determined from the absorbance at 465 nm using an extinction coefficient (ε) of 2.8 mM−1 cm−1.10
Steady-State Kinetic Assays
ALDH activity was measured at 26 °C in an Epoch 2 microplate reader (Biotek) by continuously monitoring NADH formation at 340 nm for 20 min using AASAL as the variable substrate and NAD+ at a fixed, saturating concentration. The final assay mixture (200 μL) contained 90 nM enzyme, 2.5 mM NAD+, and 60–1500 μM AASAL in 0.1 M sodium pyrophosphate buffer (pH 8.0). The enzyme concentration was determined using the bicinchoninic acid method (Pierce). The pH of the aldehyde stock solution was adjusted to 8.0 prior to addition to the reaction mixture. Kinetic constants for wild-type ALDH7A1 and A505P were estimated by fitting the initial rate data (2 min) to the Michaelis–Menten equation using Origin 2017. The initial rate data for Q506K, A505P/Q506K, and Δ504–511 were linear, rather than hyperbolic, presumably because the Michaelis constant for AASAL vastly exceeded the accessible substrate concentrations. In these cases, the slope of the best-fit line was interpreted as an approximation of kcat/Km.
Analytical Ultracentrifugation
Sedimentation experiments were performed at 20 °C using an An50Ti rotor in a Beckman XL-I analytical ultracentrifuge. For sedimentation velocity analysis, a sedimentation velocity cell, bearing a two-sector charcoal Epon centerpiece, was loaded with 430 μL of reference buffer (size exclusion flow-through) and 400 μL of a protein solution. The sample was allowed to equilibrate at temperature for 2 h prior to initiation of the analysis. Following equilibration, samples were centrifuged at 35000 rpm for 300 scans. Scans were acquired using Rayleigh interference optics and collected at 2 min intervals. Every other scan from 10 to 300 (145 total scans) was analyzed using Sedfit.11
For sedimentation equilibrium analysis, data were collected at three rotor speeds (6000, 9000, and 12000 rpm) at three different protein concentrations. Samples and reference buffer were loaded into a six-sector charcoal Epon centerpiece and allowed to equilibrate for 16 h at 6000 rpm prior to collection of the first scan. Prior to the first scan at 9000 and 12000 rpm, the system was allowed to equilibrate for 8 h. At each rotor speed, six scans were collected at hourly intervals after equilibration. The final scan at each rotor speed was used for data analysis. Data were analyzed using the previously described models4 in Origin 2017.
Small-Angle X-ray Scattering (SAXS)
The Δ504–511 variant was analyzed using SAXS. Shutterless SAXS data collection was performed with a Pilatus detector at beamline 12.3.1 of the Advanced Light Source through the mail-in program.12,13 Scattering intensities were measured at protein concentrations of 1, 2, 4, and 6 mg mL−1 (9–55 μM by dimer Mr). For each sample, 33 images were recorded evenly during a total exposure time of 10.2 s. Background subtraction data were collected similarly for the dialysis buffer. For each protein sample, the low-q region of the first three images (exposure for 0.9 s) was averaged and merged with the high-q region of the average of the first 12 images (exposure for 3.6 s) using PRIMUS.14 Guinier analysis was performed with PRIMUS using a maximum qRg of 1.3. Distance distribution functions were calculated with GNOM15 through PRIMUS. Single- and multiple-species model fitting were performed using FoXS and MultiFoXS,16 respectively. A symmetric trimer model of Δ504–511 was generated using GLOBSYMM17 assuming 3-fold symmetry. Results were graphed in Origin 2017.
RESULTS
Steady-State Kinetic Analysis of Wild-Type ALDH7A1 and C-Terminal Variants
Wild-type ALDH7A1 exhibited Michaelis–Menten behavior (Figure 3A), yielding a kcat of 0.30 s−1, a Km for AASAL of 64 μM, and a catalytic efficiency (kcat/Km) of 4700 M−1 s−1 (Table 1). The kcat/Km is within a factor of 3 of values reported by other groups for human ALDH7A1.18,19
Figure 3.
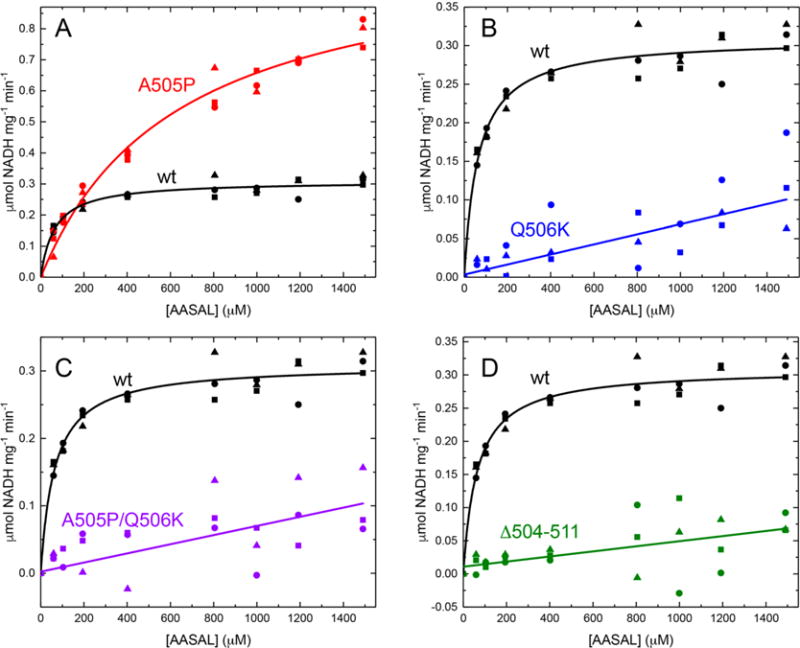
Steady-state kinetics of wild-type and mutant ALDH7A1 using AASAL as the variable substrate at a fixed NAD+ concentration of 2.5 mM (26 °C, pH 8.0). (A) Initial velocity data for wild-type ALDH7A1 (black) and A505P (red). The curves are fits to the Michaelis–Menten equation. (B) Initial velocity data for Q506K (blue). The line was calculated from linear regression. The data for wild-type ALDH7A1 are shown for comparison. (C) Initial velocity data for A505P/Q506K (purple). The line was calculated from linear regression. The data for wild-type ALDH7A1 are shown for comparison. (D) Initial velocity data for Δ504–511 (green). The line was calculated from linear regression. The data for wild-type ALDH7A1 are shown for comparison.
Table 1.
Kinetic Parameters for Wild-Type and Mutant ALDH7A1 Enzymesa
| enzyme | kcat (s−1) | Km (μM) | kcat/Km (M−1 s−1) |
|---|---|---|---|
| ALDH7A1 | 0.30 ± 0.01 | 64 ± 8 | 4700 ± 600 |
| A505P | 1.0 ± 0.1 | 630 ± 90 | 1600 ± 300 |
| Q506K | N/D | N/D | 60 ± 10b |
| A505P/Q506K | N/D | N/D | 60 ± 20b |
| Δ504–511 | N/D | N/D | 35 ± 5b |
Assays were performed at 26 °C and pH 8.0 with the NAD+ concentration fixed at 2.5 mM.
Estimated from linear regression.
When assayed under the same conditions that were used for the wild-type enzyme, the A505P variant likewise exhibited Michaelis–Menten behavior (Figure 3A); however, the Km is 10 times higher, and the kcat is 3 times higher (Table 1). The resulting catalytic efficiency of A505P, 1600 M−1 s−1, is approximately 3 times lower than that of wild-type ALDH7A1. Thus, A505P is functional, albeit with compromised efficiency.
Replacement of Gln506 with Lys has a more profound impact on catalytic activity. Unlike A505P, at experimentally accessible substrate concentrations, the reaction velocities of Q506K and double mutant A505P/Q506K exhibit a linear dependence on AASAL concentration, indicating that the Km is very large compared to the maximum substrate concentration used (1500 μM) (Figure 3B,C). For these enzymes, the catalytic efficiency was estimated from linear regression, resulting in a kcat/Km of ∼60 M−1 s−1. Clearly, the presence of Lys at position 506 of ALDH7A1 is deleterious for catalytic function.
Point mutations in the C-terminal crook of ALDH7A1 lower the catalytic efficiency, suggesting that the C-terminus itself may be vital for catalysis. To examine the contribution of the C-terminus to catalytic activity, a truncated protein missing the last eight residues of ALDH7A1 (Δ504–511) was generated. The kinetic phenotype of Δ504–511 resembles the phenotype of the point mutants in that Δ504–511 could not be saturated with AASAL (Figure 3D). The estimated kcat/Km, ∼30 M−1 s−1, is <1% of the wild-type value, indicating that an intact C-terminus is essential for proper catalytic activity.
Mutations in the C-Terminus of ALDH7A1 Disrupt Tetramer Formation
Because the C-terminus contributes to the oligomerization domain, we examined the oligomeric states of the variants in solution. Sedimentation equilibrium experiments were performed on the wild-type enzyme and the four variants under identical conditions (Figure 4).
Figure 4.

Sedimentation equilibrium analysis of wild-type and mutant ALDH7A1. For each protein, the three panels show three different protein concentrations: 0.2 mg mL−1 (left), 0.4 mg mL−1 (middle), and 0.8 mg mL−1 (right). Within each graph, the three data sets correspond to centrifugation speeds of 6000 (squares), 9000 (circles), and 12000 (triangles) rpm. The red curves for wild-type ALDH7A1 represent a global fit of the data to a previously described dimer–tetramer oligomerization equilibrium model.4 The red curves for the mutant enzymes are from global fits to a single-species model.
Sedimentation equilibrium experiments performed at 0.2–0.8 mg mL−1 on wild-type ALDH7A1 yielded an average Mr of 141 kDa (Table 2). For reference, the theoretical dimer Mr is 111 kDa. The experimental Mr of 141 kDa is consistent with the presence of a dimer–tetramer equilibrium, as previously reported for ALDH7A1.4 Introduction of a model to account for the presence of a dimer–tetramer equilibrium improved the fit to the experimental data (Figure 4) and revealed a K2–4 self-association constant of 59000 ± 6000 M−1, corresponding to a Kd of 17 μM, in excellent agreement with the value from our previous study (Kd of 16 μM).4
Table 2.
Oligomeric-State Parameters from Sedimentation Equilibrium
| [enzyme] (mg mL−1) |
average
Mr (kDa)a |
K2–4 (M−1)b | |
|---|---|---|---|
| wild type | 0.2–0.8 | 141 ± 2 | (5.9 ± 0.6) × 104 |
| A505P | 0.2–0.8 | 105 ± 1 | N/Dc |
| Q506K | 0.2–0.8 | 108 ± 1 | N/Dc |
| A505P/Q506K | 0.2–0.8 | 122 ± 1 | N/Dc |
| Δ504–511 | 0.2–0.8 | 112 ± 1 | N/Dc |
| Δ504–511 | 2–8 | 157.6 ± 0.2 | (2.64 ± 0.03) × 104 |
Values from a single-species fit of low-concentration sedimentation equilibrium data.
Association constant for the formation of a tetramer from two dimers.
Inclusion of the parameter K2–4 in the model did not improve the fit.
Comparable sedimentation equilibrium experiments were also performed on A505P, Q506K, A505P/Q506K, and Δ504–511. Interestingly, in each case, the average Mr (ranging from 105 to 122 kDa) was significantly lower than the value of 141 kDa obtained for the wild-type protein (Table 2). The quality of the least-squares fits was not improved by incorporating the dimer–tetramer equilibrium into the model (Figure 4). Evidently, A505P, Q506K, A505P/Q506K, and Δ504–511 are predominantly dimeric under the assayed conditions, suggesting that these mutations impair tetramerization.
To determine whether the oligomeric states of the three point mutant variant enzymes were concentration-dependent, sedimentation velocity studies were performed at a high concentration (4.5 mg mL−1, ∼40 μM dimer). Wild-type ALDH7A1 displays a major peak at a sedimentation coefficient of 6.4 S (Figure 5A), which corresponds to an Mr of 212 kDa (Figure 5B). For reference, the theoretical Mr of the ALDH7A1 tetramer is 222 kDa. Thus, ALDH7A1 is primarily tetrameric at this concentration, in agreement with previous studies.4 Importantly, each of the C-terminal crook mutant variants (A505P, Q506K, and A505P/Q506K) displays a similar distribution with a major peak near 6.4 S, consistent with the Mr of a tetrameric enzyme (Figure 5). Overall, these data suggest that although point mutations in the C-terminal crook of ALDH7A1 weaken the dimer–dimer interaction, they do not abolish the capacity for tetramer formation.
Figure 5.
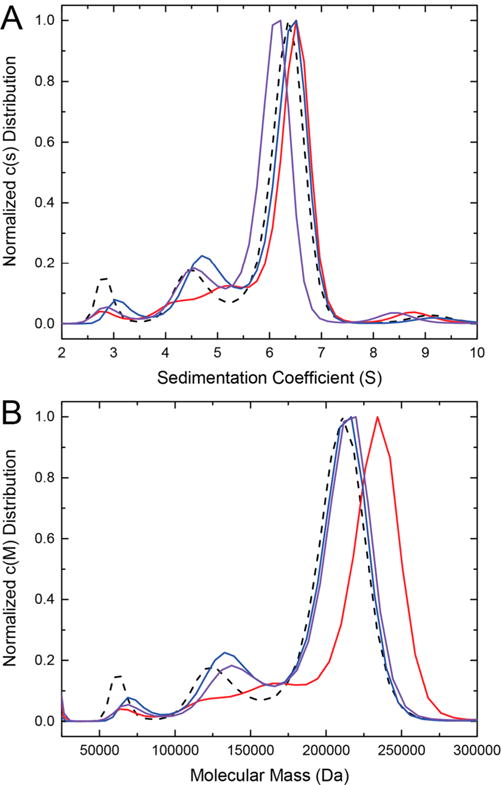
Sedimentation velocity analysis of wild-type ALDH7A1 and its C-terminal point mutants. (A) Apparent sedimentation coefficient distributions for wild-type ALDH7A1 (dashed black), A505P (red), Q506K (blue), or A505P/Q506K (purple). (B) Apparent Mr distributions for wild-type ALDH7A1 (dashed black), A505P (red), Q506K (blue), or A505P/Q506K (purple). All enzymes were used at 4.5 mg mL−1 (40 μM using dimer Mr).
Contribution of the C-Terminus of ALDH7A1 to the Oligomeric State
The Δ504–511 variant of ALDH7A1 displayed the lowest catalytic activity of the proteins studied (Table 1). Like the C-terminal crook point variants, Δ504–511 is apparently predominantly dimeric at low concentrations (0.2–0.8 mg mL−1; ∼2–7 μM, dimer Mr) (Table 2). Therefore, a series of sedimentation velocity experiments were conducted on the Δ504–511 variant to investigate any perturbations of the oligomeric state at higher concentrations. At the lowest concentration examined (8 μM dimer), the molecular weight distribution displayed a single major peak at ∼105 kDa, consistent with a dimer [theoretical dimer Mr = 109 kDa (Figure 6, top left panel)]. With an increased protein concentration, a second feature appears intermediate between the dimer and tetramer masses. At the highest protein concentration (93 μM dimer), the Mr distribution includes two broad, overlapping peaks at a range of apparent Mr values between ∼100 and ∼200 kDa. Although no explicit feature is present at the tetramer mass, the peak at ∼154–175 kDa could reflect a facile dimer–tetramer equilibrium. Alternatively, this peak may be interpreted as formation of a trimer (Mr ∼ 164 kDa), suggesting a mixture of dimer and trimer in solution at high concentrations. Importantly, there is no peak present consistent with the apparent Mr of a tetramer. These results are consistent with a dynamic mixture of multiple oligomeric species in solution and suggest that removal of the eight C-terminal residues severely impairs tetramer formation.
Figure 6.

Concentration dependence of ALDH7A1 Δ504–511 self-association. Sedimentation velocity analysis was conducted on Δ504–511 at the indicated concentrations (8–93 μM). Concentrations were determined using the dimer Mr (109 kDa). Each panel shows the distribution of apparent molecular masses in solution at the indicated concentration. For reference and ease in identifying the peak corresponding to the ALDH7A1 tetramer, the black dashed curve shows the distribution of molecular masses of wild-type ALDH7A1 at 40 μM.
To complement the high concentration sedimentation velocity experiments, a sedimentation equilibrium experiment was also performed at a high concentration (2–8 mg mL−1, 18–73 μM dimer). The experimental data and fits to the experimental data are shown in Figure 7. A single-species fit to the experimental data revealed an average Mr in solution of 157.6 kDa. Because this Mr is between that of a dimer and that of a tetramer, a dimer–tetramer self-association model was applied to the data. Fits to the data were improved with the model, which returned a K2–4 of 26400 ± 300 M−1, corresponding to a Kd of 38 μM. Likewise, the average in-solution Mr of 157.6 kDa is within 4% of the Mr of a Δ504–511 trimer. These results are consistent with the high-concentration sedimentation velocity experiment (Figure 6, top panel), which could not differentiate between a facile dimer–tetramer equilibrium or the introduction of a new oligomeric state (trimer).
Figure 7.

High-concentration sedimentation equilibrium analysis of ALDH7A1 Δ504–511. Sedimentation equilibrium analysis was conducted on ALDH7A1 Δ504–511 using Raleigh Interference optics at 2 mg mL−1 (left panel), 4 mg mL−1 (center panel), and 8 mg mL−1 (right panel) at three rotor speeds: 6000 (squares), 9000 (circles), and 12000 (triangles) rpm. The red curves represent global fits to a dimer–tetramer equilibrium model. We note that the center and right panels are missing data from faster rotor speeds due to the limits of detection at the apparent concentrations within the sedimentation cell. Data were graphed and analyzed in Origin 2017.
SAXS analysis was also performed to further investigate the in-solution oligomeric structure of ALDH7A1 Δ504–511. SAXS data collected at four protein concentrations (1–6 mg mL−1, 9–55 μM using dimer Mr) are shown in Figure 8. Qualitative changes in the SAXS curve are evident with an increasing protein concentration. In particular, a shoulder appears in the q region of 0.10–0.15 Å−1 with an increasing protein concentration. Also, the radius of gyration (Rg) from Guinier analysis increases from 34.5 Å at the lowest concentration to 37.2 Å at the highest concentration (Figure 8A,B). Likewise, the real space Rg calculated from the distance distribution function increases from 34.5 to 37.2 Å (Figure 8C). For reference, the calculated Rg of the ALDH7A1 domain-swapped dimer is 30.4 Å, and the previously reported experimental SAXS Rg for the ALDH7A1 tetramer is 37.7 Å.6 In addition, calculation of the in-solution Mr from the experimental SAXS curves using the MoW2 server20 revealed that the apparent Mr is within 10% of that of a dimer at the lowest concentration, and very close to that of the trimer at the two highest concentrations (Table 3). All of these results are consistent with concentration-dependent self-association, in agreement with the sedimentation analysis.
Figure 8.

SAXS analysis of ALDH7A1 Δ504–511. (A) Experimental SAXS curves for ALDH7A1 Δ504–511 (○) at four concentrations: 1, 2, 4, and 6 mg mL−1 (from bottom to top, respectively) (9–55 μM using dimer Mr). The theoretical SAXS curves were calculated using MultiFoXS from a two-body ensemble consisting of the domain-swapped dimer and the tetramer of ALDH7A1 (PDB entry 4ZUK) lacking the eight terminal residues. The χ values from MultiFoXS are listed. An arbitrary scale factor has been applied for curve separation. The inset shows Guinier plots. (B) Analysis of the SAXS data from panel A using a model of the trimer of Δ504–511. The blue and green curves show the two-body fit obtained with a dimer–trimer ensemble. The orange and red curves show the single-body fit obtained with a trimer. (C) Experimental distance distribution functions calculated with GNOM via PRIMUS.
Table 3.
Calculated Molecular Masses from Experimental SAXS Dataa
| concentration (mg mL−1) |
Mr | predicted oligomeric state | discrepancy from theoretical mass (%)b |
|---|---|---|---|
| 1 | 120 | dimer | 9.7 |
| 2 | 146 | trimer | 11.0 |
| 4 | 158 | trimer | 3.7 |
| 6 | 163 | trimer | 0.7 |
Calculated using the MoW2 Server.20
The theoretical Mr of the Δ504–511 monomer is 54.7 kDa.
The experimental SAXS curves were compared to theoretical curves calculated from models of Δ504–511 using FoXS and MultiFoXS.16,21 The models were made by deleting residues 504–511 from the wild-type structure (Figure 2), and no attempt was made to model any structural perturbations caused by the truncation. The FoXS goodness-of-fit parameters (χ) for single-body and two-body ensemble fits are listed in Table S3.
We first analyzed the Δ504–511 SAXS data using a dimer–tetramer ensemble, as we had done previously for wild-type ALDH7A1.6 Neither the dimer nor the tetramer alone provided a satisfactory fit to the Δ504–511 SAXS data, as evidenced by χ values of 2–16 (Table S3). Using a dimer–tetramer equilibrium model improved the fits (χ = 0.83–5.0); however, the experimental and theoretical SAXS curves deviated significantly at q > 0.05 Å−1 (Figure 8A). The discrepancy is particularly noticeable for the two higher-concentration SAXS samples. These results suggest that the standard dimer–tetramer equilibrium model may be insufficient to describe the in-solution behavior of Δ504–511.
Because the dimer–tetramer model was unsatisfactory and the sedimentation velocity data suggested the possibility of dimers and trimers in solution at high concentrations (Figure 6), we incorporated a trimer into the SAXS analysis. The trimer model was generated by removing one protomer from the crystallographic tetramer and deleting residues 504–511 (Figure S1A). Interestingly, for the two highest-concentration samples, the trimer alone gave the best fit to the SAXS data (Figure 8B and Table S3); this result is consistent with the SAXS Mr calculations, which indicated an average Mr very close to that of a trimer (Table 3). For the two lowest-concentration samples, the trimer also yielded the best one-body fit; however, the use of a dimer–trimer ensemble improved the fit (Figure 8B and Table S3). Likewise, this result is consistent with the SAXS-derived estimate of Mr, which indicated an average Mr between those of the dimer and trimer (Table 3). We note that the model generated by removing one protomer and deleting residues 504–511 of the crystallographic tetramer is asymmetric and may not be stable in solution. We also generated a 3-fold symmetric trimer model using GLOBSYMM (Figure S1B). Interestingly, the single-body fits to the experimental data obtained with this model were slightly worse than those obtained with the asymmetric trimer (Table S3). However, for the two intermediate-concentration samples, the use of a two-body ensemble incorporating the symmetric trimer slightly improved the fits relative to those using the asymmetric trimer (Table S3). These results suggest that multiple trimeric models satisfactorily explain the SAXS data; however, the SAXS data alone cannot distinguish between the two trimer models.
DISCUSSION
This study was motivated by crystallographic data indicating that the C-terminus contributes to the active site of ALDH7A1 (Figure 2C). We chose to focus on Ala505 and Gln506 because they are identically conserved in family 7 of the ALDH superfamily, implying functional importance. Moreover, in the c.1512delG deletion mutation present in a subset of PDE patients, Ala505 and Gln506 are replaced by Pro and Lys, respectively (Figure 2D). Therefore, instead of substituting alanine for the wild-type residue, we elected to make mutations that incorporate the changes caused by c.1512delG, anticipating that the observed behavior of the variants might provide insight into the molecular basis of this form of PDE.
Our results suggest that Ala505 and Gln506 are important for AASAL binding. Mutation of Ala505 to Pro increases the Km for AASAL by a factor of 10. Mutation of Gln506 to Lys, either alone or in combination with the A505P mutation, caused a profound catalytic defect characterized by a lack of saturation kinetics with AASAL. These results are consistent with Ala505 and Gln506 contributing to the binding of AASAL, a conclusion also suggested by the crystal structure showing that these residues stabilize the aldehyde anchor loop (Figure 2D).
Because the C-terminus contributes to the oligomerization domain, we hypothesized that the compromised catalytic activity of the variants might reflect an alteration in oligomeric structure. The oligomerization domain of ALDH7A1 is a β-substructure, consisting of a β-hairpin and the C-terminus of the polypeptide chain. It is involved in both dimerization and tetramerization. In the domain-swapped dimer, the oligomerization domain of one protomer contacts the catalytic domain of the other (Figure 2B). Via this interaction, the C-terminus contributes to the aldehyde-binding site (Figure 2D). The oligomerization flap also contributes to tetramerization, mediating association of the two dimers (Figure 2C).
Although it has long been regarded as a tetrameric enzyme, wild-type ALDH7A1, in fact, exhibits interesting self-association behavior. At high protein concentrations, it is undoubtedly tetrameric. It invariably crystallizes as a dimer-of-dimers tetramer,6,7,18,22 and the presence of the tetramer in solution has been confirmed by SAXS.6 Recently, however, we have learned that, at lower concentrations, wild-type ALDH7A1 exists as a dimer–tetramer equilibrium in solution,4 a result confirmed in this work (Figure 4 and Table 2). Thus, regarding ALDH7A1 strictly as a tetrameric enzyme, as it is often termed in the literature (including by the authors), neglects a subtle aspect of the enzyme, an aspect that we suggest is related to catalytic function.
Related to this complex self-association behavior, our thermodynamic data suggest wild-type ALDH7A1 is dimeric at the concentrations used in enzyme activity assays. This observation raises the question of the true active form of the enzyme. One possibility is that the dimer, itself, is active. Another intriguing idea is that the binding of the substrate or product enhances the affinity for tetramerization, even at enzyme concentrations at which our data suggest tetramerization is improbable. Further study of this interesting phenomenon must be conducted to differentiate between these two possibilities.
All of the variant enzymes characterized in this study are defective in tetramer formation. At protein concentrations at which the wild-type enzyme exhibits dimer–tetramer interconversion, the mutant enzymes exist as lower-order oligomeric assemblies. These data are consistent with perturbation of the dimer–tetramer equilibrium toward the dimer. Another interpretation is that the mutants, particularly the Δ504–511 truncation variant, form an apparent trimer, a species not evident in studies of the wild-type enzyme. The formation of alternative oligomeric assemblies via perturbation of a fragile self-association equilibrium is characteristic of morpheein enzymes.23–25 Interestingly, previous studies of porphobilinogen synthase (PBGS) revealed that ALAD porphyria-related mutations in PBGS favor formation of the less active hexameric form over the more active octamer.24 Similarly, both previously4 and in the study presented here, we present PDE-related mutations that shift the self-association equilibrium toward less active oligomers. As observed in the PBGS mutations that cause ALAD porphyria,24 the PDE-related mutations here result in high substrate apparent Km values. In this case, we possibly identified a trimeric form of ALDH7A1 that is less active than the wild type. Likewise, other PDE-related mutations apparently cause formation of inactive dimers.4 Together, these observations suggest PDE-related mutations in ALDH7A1 that perturb the self-association equilibrium may be added to a list of morpheein-based conformational diseases.
Finally, our results provide insight into the molecular basis of PDE caused by the c.1512delG frameshift mutation. The enzyme encoded by ALDH7A1 harboring c.1512delG includes the A505P/Q506K double mutation and four other mutations and 10 extra residues in the C-terminus (Figure 2D). Because double mutant A505P/Q506K has a severe kinetic defect, it is likely that the enzyme encoded by ALDH7A1 c.1512delG is even more catalytically disabled. Indeed, Mills et al.3 found no detectable AASAL dehydrogenase activity in CHO cells transfected with the ALDH7A1 gene encoding c.1512delG. Presuming the frameshift mutant enzyme is soluble, we suggest that disruption of tetramerization may be the structural basis for their observation.
Supplementary Material
Acknowledgments
The authors thank Beverly DaGue of the University of Missouri Charles W. Gehrke Proteomics Center for performing mass spectrometry analysis. The authors thank Katherine Burnett for collecting SAXS data through the SIBYLS mail-in program. Part of this research was performed at the Advanced Light Source. The Advanced Light Source is supported by the Director, Office of Science, Office of Basic Energy Sciences, of the U.S. Department of Energy under Contract DE-AC02-05CH11231. Additional support for the SYBILS beamline comes from the National Institute of Health project MINOS (R01GM105404).
Funding
Research reported in this publication was supported by National Institute of General Medical Sciences Grant R01GM093123.
ABBREVIATIONS
- AA
α-aminoadipate
- AASAL
α-aminoadipate semialdehyde
- ALDH
aldehyde dehydrogenase
- ALDH7A1
aldehyde dehydrogenase 7A1
- P6C
Δ1-piperideine-6-carboxylic acid
- PDB
Protein Data Bank
- PDE
pyridoxine-dependent epilepsy
- PBGS
porphobilinogen synthase
- PLP
pyridoxal 5′-phosphate
- SAXS
small-angle X-ray scattering
Footnotes
Supporting Information
The Supporting Information is available free of charge on the ACS Publications website at DOI: 10.1021/acs.biochem.7b00803.
ORCID
David A. Korasick: 0000-0002-6337-2085
Kent S. Gates: 0000-0002-4218-7411
John J. Tanner: 0000-0001-8314-113X
Author Contributions
D.A.K. and J.W.W. contributed equally to this work.
Notes
The authors declare no competing financial interest.
References
- 1.van Karnebeek CD, Tiebout SA, Niermeijer J, Poll-The BT, Ghani A, Coughlin CR, 2nd, Van Hove JL, Richter JW, Christen HJ, Gallagher R, Hartmann H, Stockler-Ipsiroglu S. Pyridoxine-dependent epilepsy: An expanding clinical spectrum. Pediatr Neurol. 2016;59:6–12. doi: 10.1016/j.pediatrneurol.2015.12.013. [DOI] [PubMed] [Google Scholar]
- 2.Stockler S, Plecko B, Gospe SM, Jr, Coulter-Mackie M, Connolly M, van Karnebeek C, Mercimek-Mahmutoglu S, Hartmann H, Scharer G, Struijs E, Tein I, Jakobs C, Clayton P, Van Hove JL. Pyridoxine dependent epilepsy and antiquitin deficiency: clinical and molecular characteristics and recommendations for diagnosis, treatment and follow-up. Mol Genet Metab. 2011;104:48–60. doi: 10.1016/j.ymgme.2011.05.014. [DOI] [PubMed] [Google Scholar]
- 3.Mills PB, Struys E, Jakobs C, Plecko B, Baxter P, Baumgartner M, Willemsen MA, Omran H, Tacke U, Uhlenberg B, Weschke B, Clayton PT. Mutations in antiquitin in individuals with pyridoxine-dependent seizures. Nat Med. 2006;12:307–309. doi: 10.1038/nm1366. [DOI] [PubMed] [Google Scholar]
- 4.Korasick DA, Tanner JJ, Henzl MT. Impact of disease-Linked mutations targeting the oligomerization interfaces of aldehyde dehydrogenase 7A1. Chem-Biol Interact. 2017;276:31–39. doi: 10.1016/j.cbi.2017.01.002. [DOI] [PMC free article] [PubMed] [Google Scholar]
- 5.Koppaka V, Thompson DC, Chen Y, Ellermann M, Nicolaou KC, Juvonen RO, Petersen D, Deitrich RA, Hurley TD, Vasiliou V. Aldehyde dehydrogenase inhibitors: a comprehensive review of the pharmacology, mechanism of action, substrate specificity, and clinical application. Pharmacol Rev. 2012;64:520–539. doi: 10.1124/pr.111.005538. [DOI] [PMC free article] [PubMed] [Google Scholar]
- 6.Luo M, Tanner JJ. Structural basis of substrate recognition by aldehyde dehydrogenase 7A1. Biochemistry. 2015;54:5513–5522. doi: 10.1021/acs.biochem.5b00754. [DOI] [PMC free article] [PubMed] [Google Scholar]
- 7.Luo M, Gates KS, Henzl MT, Tanner JJ. Diethylaminobenzaldehyde is a covalent, irreversible inactivator of ALDH7A1. ACS Chem Biol. 2015;10:693–697. doi: 10.1021/cb500977q. [DOI] [PubMed] [Google Scholar]
- 8.Gasteiger E, Hoogland C, Gattiker A, Duvaud S, Wilkins MR, Appel RD, Bairoch A. Protein identification and analysis tools on ExPASy server. Humana Press; Totowa, NJ: 2005. [Google Scholar]
- 9.Rumbero A, Fco Martin J, Angeles Lumbreras M, Liras P, Esmahan C. Chemical synthesis of allysine ethylene acetal and conversion in situ into 1-piperideine-6-carboxylic acid: key intermediate of the alpha-aminoadipic acid for beta-lactam antibiotics biosynthesis. Bioorg Med Chem. 1995;3:1237–1240. doi: 10.1016/0968-0896(95)00110-3. [DOI] [PubMed] [Google Scholar]
- 10.Wu ML, Chen JH, Ho CT, Huang TC. Synthesis of 1-piperideine-6-carboxylic acid produced by L-lysine-epsilon-aminotransferase from the Streptomyces clavuligerus gene expressed in Escherichia coli. J Agric Food Chem. 2007;55:1767–1772. doi: 10.1021/jf062975u. [DOI] [PubMed] [Google Scholar]
- 11.Schuck P. Size-distribution analysis of macromolecules by sedimentation velocity ultracentrifugation and lamm equation modeling. Biophys J. 2000;78:1606–1619. doi: 10.1016/S0006-3495(00)76713-0. [DOI] [PMC free article] [PubMed] [Google Scholar]
- 12.Hura GL, Menon AL, Hammel M, Rambo RP, Poole FL, II, Tsutakawa SE, Jenney FE, Classen S, Jr, Frankel KA, Hopkins RC, Yang SJ, Scott JW, Dillard BD, Adams MW, Tainer JA. Robust, high-throughput solution structural analyses by small angle X-ray scattering (SAXS) Nat Methods. 2009;6:606–612. doi: 10.1038/nmeth.1353. [DOI] [PMC free article] [PubMed] [Google Scholar]
- 13.Classen S, Hura GL, Holton JM, Rambo RP, Rodic I, McGuire PJ, Dyer K, Hammel M, Meigs G, Frankel KA, Tainer JA. Implementation and performance of SIBYLS: a dual endstation small-angle X-ray scattering and macromolecular crystallography beamline at the Advanced Light Source. J Appl Crystallogr. 2013;46:1–13. doi: 10.1107/S0021889812048698. [DOI] [PMC free article] [PubMed] [Google Scholar]
- 14.Konarev PV, Volkov VV, Sokolova AV, Koch MHJ, Svergun DI. PRIMUS: a Windows PC-based system for small-angle scattering data analysis. J Appl Crystallogr. 2003;36:1277–1282. [Google Scholar]
- 15.Svergun D. Determination of the regularization parameter in indirect-transform methods using perceptual criteria. J Appl Crystallogr. 1992;25:495–503. [Google Scholar]
- 16.Schneidman-Duhovny D, Hammel M, Tainer JA, Sali A. FoXS, FoXSDock and MultiFoXS: Single-state and multi-state structural modeling of proteins and their complexes based on SAXS profiles. Nucleic Acids Res. 2016;44:W424–429. doi: 10.1093/nar/gkw389. [DOI] [PMC free article] [PubMed] [Google Scholar]
- 17.Petoukhov MV, Svergun DI. Global rigid body modeling of macromolecular complexes against small-angle scattering data. Biophys J. 2005;89:1237–1250. doi: 10.1529/biophysj.105.064154. [DOI] [PMC free article] [PubMed] [Google Scholar]
- 18.Brocker C, Lassen N, Estey T, Pappa A, Cantore M, Orlova VV, Chavakis T, Kavanagh KL, Oppermann U, Vasiliou V. Aldehyde dehydrogenase 7A1 (ALDH7A1) is a novel enzyme involved in cellular defense against hyperosmotic stress. J Biol Chem. 2010;285:18452–18463. doi: 10.1074/jbc.M109.077925. [DOI] [PMC free article] [PubMed] [Google Scholar]
- 19.Koncitikova R, Vigouroux A, Kopecna M, Andree T, Bartos J, Sebela M, Morera S, Kopecny D. Role and structural characterization of plant aldehyde dehydrogenases from family 2 and family 7. Biochem J. 2015;468:109–123. doi: 10.1042/BJ20150009. [DOI] [PubMed] [Google Scholar]
- 20.Fischer H, de Oliveira Neto M, Napolitano HB, Polikarpov I, Craievich AF. Determination of the molecular weight of proteins in solution from a single small-angle X-ray scattering measurement on a relative scale. J Appl Crystallogr. 2010;43:101–109. [Google Scholar]
- 21.Schneidman-Duhovny D, Hammel M, Sali A. FoXS: a web server for rapid computation and fitting of SAXS profiles. Nucleic Acids Res. 2010;38:W540–544. doi: 10.1093/nar/gkq461. [DOI] [PMC free article] [PubMed] [Google Scholar]
- 22.Tang WK, Wong KB, Lam YM, Cha SS, Cheng CH, Fong WP. The crystal structure of seabream antiquitin reveals the structural basis of its substrate specificity. FEBS Lett. 2008;582:3090–3096. doi: 10.1016/j.febslet.2008.07.059. [DOI] [PubMed] [Google Scholar]
- 23.Lawrence SH, Selwood T, Jaffe EK. Environmental contaminants perturb fragile protein assemblies and inhibit normal protein function. Curr Chem Biol. 2013;7:196–206. doi: 10.2174/2212796811307020011. [DOI] [PMC free article] [PubMed] [Google Scholar]
- 24.Jaffe EK, Stith L. ALAD porphyria is a conformational disease. Am J Hum Genet. 2007;80:329–337. doi: 10.1086/511444. [DOI] [PMC free article] [PubMed] [Google Scholar]
- 25.Jaffe EK. Morpheeins–a new structural paradigm for allosteric regulation. Trends Biochem Sci. 2005;30:490–497. doi: 10.1016/j.tibs.2005.07.003. [DOI] [PubMed] [Google Scholar]
Associated Data
This section collects any data citations, data availability statements, or supplementary materials included in this article.