Abstract
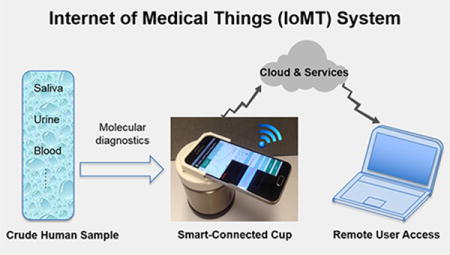
Rapid and quantitative molecular diagnostics in the field, at home, and at remote clinics is essential for evidence-based disease management, control, and prevention. Conventional molecular diagnostics requires extensive sample preparation, relatively sophisticated instruments, and trained personnel, restricting its use to centralized laboratories. To overcome these limitations, we designed a simple, inexpensive, hand-held, smartphone-based mobile detection platform, dubbed “smart-connected cup” (SCC), for rapid, connected, and quantitative molecular diagnostics. Our platform combines bioluminescent assay in real-time and loop-mediated isothermal amplification (BART-LAMP) technology with smartphone-based detection, eliminating the need for an excitation source and optical filters that are essential in fluorescent-based detection. The incubation heating for the isothermal amplification is provided, electricity-free, with an exothermic chemical reaction, and incubation temperature is regulated with a phase change material. A custom Android App was developed for bioluminescent signal monitoring and analysis, target quantification, data sharing, and spatiotemporal mapping of disease. SCC’s utility is demonstrated by quantitative detection of Zika virus (ZIKV) in urine and saliva and HIV in blood within 45 min. We demonstrate SCC’s connectivity for disease spatiotemporal mapping with a custom-designed website. Such a smart- and connected-diagnostic system does not require any lab facilities and is suitable for use at home, in the field, in the clinic, and particularly in resource-limited settings in the context of Internet of Medical Things (IoMT).
Graphical abstract
Rapid and quantitative molecular diagnostics in the field, at home, and at remote clinics is essential for evidence-based disease management, control, and prevention.1–3 Nucleic acid amplification tests (NAATs) based on enzymatic amplification, such as polymerase chain reaction (PCR), are the “gold standard” for disease diagnostics due to their high sensitivity and specificity and quantification capability.4–6 However, current PCR-based NAATs require extensive sample preparation to extract, isolate, and purify target nucleic acids from heterogeneous samples and instrumentation for precise thermal cycling, neither of which is practical at the point of care (POC). There is a need for simple, rapid, inexpensive, and easy-to-use NAATs that can be used outside the clinical laboratory.
Recent advances in isothermal nucleic acid amplification assays and microfluidics enable portable detection systems.7–10 However, many of these systems11,12 are bulky and expensive and often lack connectivity. Most currently available systems are appropriate for centralized clinics, not for point of care diagnostics. Since smartphones are ubiquitous, in particular in developing countries that lack land-based telecommunications,13,14 it is sensible to take advantage of smartphones to replace dedicated instruments for inexpensive and reliable signal acquisition and analysis; transmission of test results to the patient’s file and doctor’s office; communication of test Global Positioning System (GPS) location, time, and deidentified results to public health officials for spatiotemporal mapping, epidemiological surveillance, resource allocation, and policy decisions. The use of smartphones in NAATs not only reduces test cost but also enhances capabilities beyond what is available with existing instruments. Most recently, a few smartphone-based platforms15–18 have been reported for nucleic acid amplification detection. However, all these platforms rely on fluorescence detection with optical components (i.e., fluorescence excitation light source and optical filters) that add cost and complexity. Although they use smartphone cameras to record signals, most of them lack smartphone-based image processing and quantitative detection and do not take advantage of connectivity.
Here, we describe a simple, inexpensive, hand-held, smartphone-based mobile detection platform (dubbed “smart-connected cup”, SCC) for rapid, connected, and quantitative molecular diagnostics (Figures 1a,b and S1a). Our platform combines a bioluminescent assay (BART, bioluminescent assay in real-time)19 with loop-mediated isothermal amplification (LAMP), in which luciferin, fueled by polymerase byproducts, produces bioluminescence light. In contrast to fluorescent reporters,15–18 BART does not require an excitation light source and optical filters and is not susceptible to background emission. Incubation heating for the isothermal amplification is generated by an exothermic chemical reaction (“thermal battery”), and incubation temperature is regulated with a phase-change material, enabling electricity-free nucleic acid amplification.18 Our smartphone App monitors luciferin emission in real-time, quantifies emission intensity, and determines target concentration. Quantitative test results are displayed on the smartphone screen and, when desired, wirelessly transmitted to a remote server to be recorded in the patient’s files and made available to the patient’s doctor and, together with GPS coordinates, to public health officials. To demonstrate our platform’s capabilities, we selected applications of current interest: molecular diagnostics of Zika virus (ZIKV) and HIV infection. We also illustrate our platform’s capability of mapping disease spread with a custom-designed website.
Figure 1.
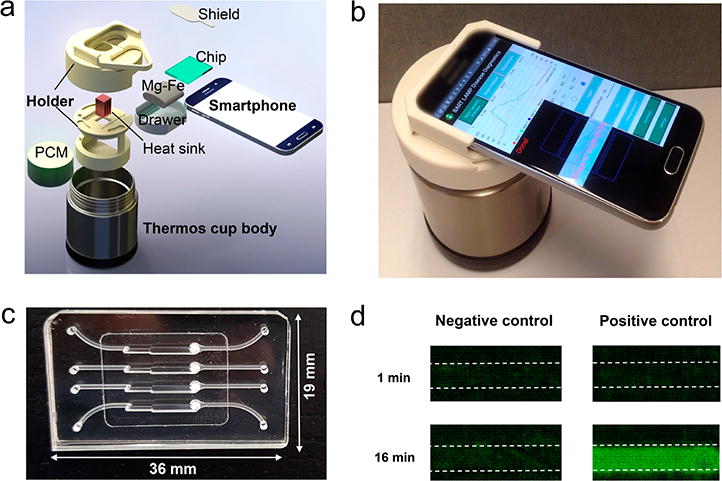
SCC platform for mobile molecular detection with BART-LAMP assay. (a) Exploded view of the SCC. The platform consists of a thermos cup body, 3D-printed holder, and a smartphone. (b) A photograph of the assembled SCC. (c) A photograph of our MIAR chip with four reactors for on-chip NA extraction and BART-LAMP assay. (d) Bioluminescence emission images detected with the smartphone camera from the isothermal amplification reactors (left: negative control; right: positive control) at 1 and 16 min after the start of incubation. The negative and positive control samples included, respectively, 0 and 500 PFU of ZIKV.
EXPERIMENTAL SECTION
RT-LAMP Primer Design
The RT-LAMP primer set for ZIKV was designed as we have previously described.20 Briefly, we aligned and analyzed complete genome sequences of various ZIKV strains to identify conserved sequences among ZIKV strains. These sequences were compared to other flaviviruses’ sequences with DNAMAN software. A 600-nt sequence in the envelope protein coding region was selected to serve as our template due to its high homology among ZIKV and high divergence from all other flaviviruses examined. The RT-LAMP primer set was designed with the PrimerExplorer V4 software (Eiken Chemical Co. Ltd.). A BLAST search of the GenBank nucleotide database was carried out for the selected primers’ sequences to verify specificity. The RT-LAMP sequences were synthesized by a commercial vendor (IDT, Coralville, IA) and documented in Table S1 together with the concentrations used in our reaction mix.
Virus Samples
ZIKV American strain (mex 2–81), DENV-2 NGC, and CHIKV (181/clone25) were obtained from the World Reference Center for Emerging Viruses and Arboviruses (WRCEVA, Dr. Robert Tesh, Director) and propagated in the mosquito cell line C6/36 cells. The viral concentration (PFU/mL) was determined with a plaque assay on Vero cells. Inactivated HIV-1 virus was purchased from Thermofisher Scientific (AcroMetrix HIV-1 High Control, Benicia, CA).
Samples Spiked with Viruses
We collected urine, saliva, and whole blood samples from healthy, consenting, adult volunteers. The ZIKV was spiked in the urine samples and saliva samples at various concentrations. For safety, the ZIKV was first inactivated by mixing the samples laden with ZIKV with binding/lysis buffer (AVL, QIAamp Viral RNA Mini Kit) in a BSL2, followed with addition of ethanol to the lysate according to the manufacturer’s protocol.21 Similarly, inactivated HIV virus was spiked in plasma separated from whole blood with our POC plasma separator.22
Benchtop RT-LAMP Amplification
Zika viral RNA was extracted with Qiagen Viral RNA mini kit (QIAGEN, Valencia, CA), following the manufacturer’s protocol. In addition to the primers and template, the RT-LAMP reaction mix (25 μL) included: 1× OptiGene Isothermal Master Mix ISO-100 (OptiGene, U.K.), 3 U of AMV reverse transcriptase (Invitrogen, Carlsbad, CA), and 0.5 μL of EvaGreen fluorescent dye (Biotium, Hayward, CA). Amplification was carried out and monitored with Peltier Thermal Cycler PTC-200 (Bio-Rad DNA Engine, Hercules, CA) at 63°C. Fluorescence emission intensity data were collected once every minute for 60 min.
Operation of Multifunctional Isothermal Amplification Reactor (MIAR) Chip
We used our custom-made microfluidic chips with four independent multifunctional, isothermal amplification reactors (MIAR) (Figure 1c). For each test, lysate was filtered through the nucleic acid isolation membrane of one of the amplification reactors. The nucleic acids bound to the membrane. Subsequent to the sample introduction, 150 μL of Qiagen wash buffer 1 (AW1) was injected into the reactor to remove amplification inhibitors. Then, the silica membrane was washed with 150 μL of Qiagen wash buffer 2 (AW2), followed by air-drying for 30 s. Next, 25 μL of bioluminescent assay in real-time and loop-mediated isothermal amplification (BART-LAMP) master mix, which includes 1× OptiGene Isothermal Master Mix ISO-100nd (OptiGene, U.K.), 3 U of AMV reverse transcriptase (Promega, USA), 2.5 μL of BART reporter (Lot: 1434201; ERBA Molecular, UK), and LAMP primers (Table S1) were injected into each reactor. The inlet and outlet ports were then sealed with transparent tape.
Operation of Smart-Connected Cup (SCC)
Commercially available Mg–Fe alloy pouch (chemical heater) of the type used in Meal, Ready to Eat (MRE, Innotech Products Ltd., USA) was first placed in the drawer (Figures 1a and S1a). When 7.5 mL of tap water was added to the drawer, the magnesium oxidized rapidly and the reaction produced heat. After approximately 10 min, once the heat sink’s temperature exceeded 60°C, the MIAR chip was inserted into the SCC and the smartphone was initiated to record in real-time the bioluminescence emission from the reactors. The phone camera acquired an image once every min for 60 min. The images obtained with the smartphone camera were analyzed, and the average bioluminescence intensity signal for each reactor was extracted and depicted as a function of time. The detection results can be sent to the cloud.
RESULTS AND DISCUSSION
Smart-Connected Cup Platform
To enable on-site, rapid, connected, molecular detection, we designed, prototyped, and tested a simple, inexpensive, compact, smart-connected cup (SCC; Figures 1a,b and S1a and Video S1). The SCC consists of (i) a Thermos cup body with vacuum insulation, (ii) a smartphone (i.e., Samsung Galaxy S6) with custom written App, and (iii) a 3D-printed holder (i.e., chip holder, cup lid, and a smartphone adaptor). The chip holder was designed to accommodate our MIAR chip (Figure 1c) and interface our chip with a heat sink. To facilitate real-time bioluminescence monitoring, a detection window was formed in the center of the cup lid. The smartphone adapter was part of the cup lid. Figure 1b is a photograph of our SCC equipped with a smartphone. The smartphone with our App is capable of real-time imaging/recording of the bioluminescence signal (Figure 1d), processing images, quantifying nucleic acid concentration, and reporting/transmitting test results.
A phase-change material (PCM) with a melting temperature of 68°C (PureTemp 68, Entropy Solutions Inc., Plymouth) regulates the MIAR’s incubation temperature at a level appropriate for isothermal amplification, typically about 63°C. The heat generated by the exothermic reaction is transferred through the PCM and aluminum heat sink to the MIAR chip. Excess heat is consumed as a latent heat without any temperature increase beyond the desired value, independent of ambient conditions.
Android-Based Smartphone App
We developed a custom Android App that controls camera exposure time and image acquisition rate, processes smartphone camera images of the reactors, and reports/transmits test results (Figure 2). Detailed information about this App is given in Figure S2. Our App was developed with Eclipse Integrated Development Environment (IDE) in Android Developer Tools and Java. Our App has three primary functions: (i) real-time bioluminescence image capture, (ii) image processing/analysis, and (iii) test result reporting and transmission.
Figure 2.
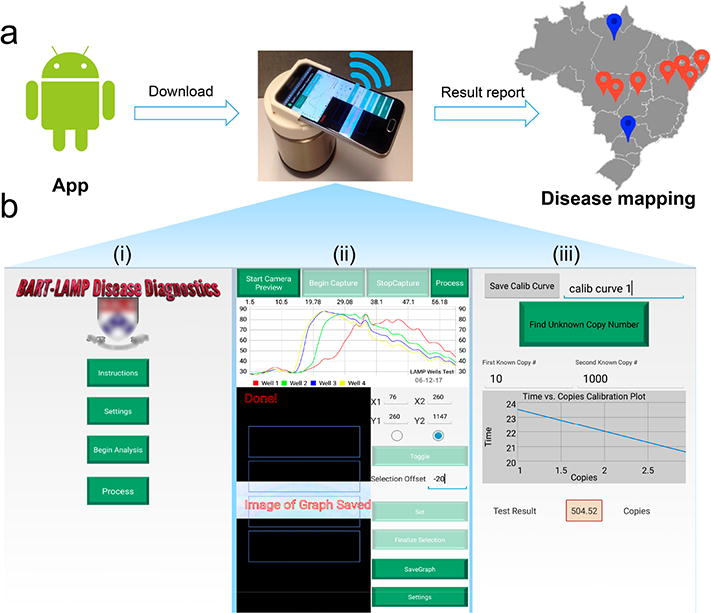
Android App for the smartphone-based molecular detection and disease mapping. (a) A flowchart of the SCC-based molecular detection and disease mapping. Red and blue dots denote, respectively, locations of positive and negative tests. (b) Screenshots of our smartphone interface: (i) main menu, (ii) real-time monitoring of the reactors of the MIAR chip, and (iii) calibration curve and result report.
The main menu of the App (Figure 2b (i)) provides operating instructions, solicits information from the user, and allows the user to alter default parameters such as camera exposure time, total test time, and image capture frequency. The user is also prompted to select the detection regions of the reactor array displayed in the preview window (Figure 2b (ii)). The App takes images at regular intervals (i.e., once a minute) of the light emission from the user-defined regions and constructs arrays of bioluminescence intensities as functions of incubation time for all reactors (Figure 2b (ii)). To ensure consistent conditions, the camera focus and exposure time are locked during the entire process. To shorten the detection distance, a 0.67× magnetically mounted wide lens (Amazon) is used. All images are saved in Joint Photographic Experts Group (JPEG) format with a resolution of 96 dots per inch (dpi) and 8 bits per RGB channel (24 bits in total). Intensity values are calculated by summing the individual RGB values of each pixel. The intensity values are then graphed in real-time; threshold times are calculated, and the data is saved for future analysis.
For target quantification, one can operate two of the reactors as calibration reactors with known numbers of template copies to establish a linear relationship between the threshold time and the log of the number of template copies (Figure 2b (iii)). Alternatively, a calibration formula can be stored in the App. At the conclusion of the test, the calibration formula can be used to determine the number of templates in each test.
To enable spatiotemporal disease mapping, GPS coordinates of each test location are recorded. The test results, location, and time stamp can then be communicated to a secure server by our smartphone App (Figure 2a). The App can also provide counseling and links to support resources.
Excitation/Filter-Free BART-LAMP Assay
The MIAR chip (Figure 1c) that was used in our experiments contained four independent multifunctional isothermal amplification reactors. Each reactor includes a porous silica nucleic acid (NA) isolation membrane (Figure 3a) for nucleic acid capture, concentration, and purification from raw samples (<5 min), eliminating the need for centrifugation and spin columns that are commonly used in centralized laboratories without sacrificing performance.23 More importantly, our flow-through NA-isolation membrane decouples sample volume from the reactor’s volume, enabling the use of relatively large sample volumes (several hundreds microliters) for high sensitivity while maintaining small reaction volume and small reagent consumption. We fabricated the chip with PMMA (poly-(methyl methacrylate)) via computer numeric control (CNC) machining.23
Figure 3.
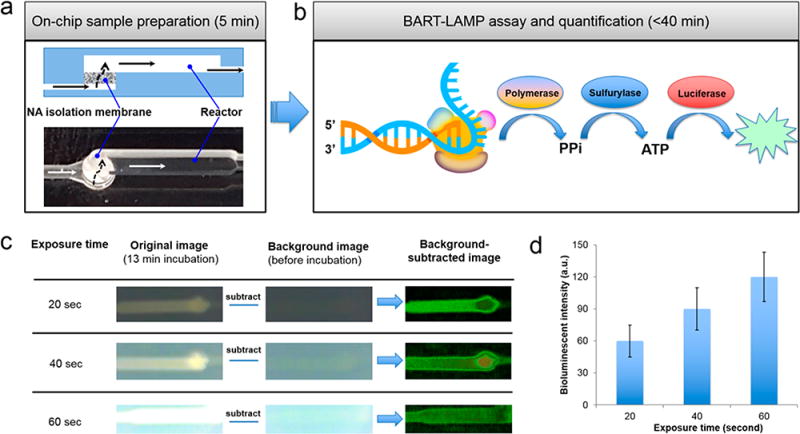
Excitation/filter-free BART-LAMP assay on the MIAR chip. (a) A cross-section (top) and a top image (bottom) as imaged by the smartphone camera of the flow-through reactor with nucleic acid isolation membrane. (b) Schematic of the light emission process during DNA synthesis. (c) Illustration of image processing to remove background noise at various exposure times. (d) Processed bioluminescence intensity as a function of camera’s exposure time (n = 3).
Real-time monitoring of nucleic acid amplification is commonly used for the quantification of target nucleic acids in a sample. Typically, real-time quantitative detection records fluorescence emission intensity of an intercalating dye or fluorescent beacons to monitor synthesis of polynucleotides during enzymatic amplification.24–27 However, fluorescence readout necessitates an excitation light source and optical filters to separate excitation and emission spectra. Since many materials exhibit autofluorescence, fluorescence detection is also susceptible to unwanted background emission. All these increase cost and complexity. Since the BART reporter’s emission is induced by the amplification reaction itself, one can directly monitor the amplification process with a smartphone camera (Figures 1d, 3b, and S3) without a need for excitation and optical filters, enabling a simple, inexpensive, and portable smartphone-based molecular detection platform.
Since the emission intensity detected by the smartphone camera increases with increasing camera’s exposure time (Figure 3c), our App overrides the automated camera shutter exposure time and maintains shutter exposure time fixed for all images, independent of light intensity. At the start of the monitoring process, we imaged the background to establish a baseline. This background was then subtracted from all subsequent images.
To select appropriate exposure time, we evaluated the recorded light intensity as a function of camera exposure time (Figure 3d). As the camera exposure time increases, so does the recorded intensity. However, too long camera exposure times lead to increased background noise. As a reasonable compromise, we use camera exposure time of 40 s in all our experiments.
Effects of BART Assay Composition on Light Emission Intensity
BART reporter includes adenosine-5′-O-phosphosulfate (APS), ATP sulfurylase, firefly luciferase, and luciferin (Figure S3). We examined the effect of BART reporter concentration on light emission by varying its volume in the LAMP reaction mix from 0 to 4 μL (Figure 4). Figure 4a depicts the emission intensity as a function of time for various BART reporter concentrations. In the absence of the reporter, the bioluminescence intensity remains very low throughout the entire incubation time. In the presence of the BART reporter, the emission intensity is initially low but increases sharply as the rate of DNA synthesis increases. The emission intensity peaks and then, as the polymerase reaction slows, it decays slowly with a long tail. As the BART reporter concentration increases so does the emission intensity peak height (Figure 4b). In the range of reporter concentrations considered here, we did not observe any inhibitory effects of BART reporters. Importantly, BART reporter concentration does not significantly affect the threshold time, which we define as the time interval from the beginning of incubation until the signal reaches half its peak height (Figure 4c). In all the experiments reported in the remainder of this paper, we used 2.5 μL of BART reporter solution.
Figure 4.

The effect of BART reporter concentration on BART-LAMP amplification curves and threshold times. (a) BART-LAMP emission intensity as a function of time with different volumes of BART reporter. The ZIKV RNA template concentration is 103 PFU per sample. (b) The bioluminescent intensity as a function of the volume of BART reporter (n = 3). (c) The threshold time (min) as a function of the volume of BART reporter volume (n = 3).
Earlier workers19 reported that BART emission decays rapidly after peaking, while in our experiments, we observe a slow decay (Figure 4a). The sharp peak is attributed19 to the competing effects of pyrophosphate (PPi). During the exponential phase of amplification, PPi produced by polymerase rapidly converts into ATP that fuels bioluminescence emission. Subsequently, excess free PPi inhibits luciferase, reducing light intensity after the peak. Previous researchers19 used LAMP reaction mix without pyrophosphatases (PPases). In contrast, we use OptiGene LAMP28 assay in which PPases is added to improve amplification efficiency.29,30 We hypothesize that PPases’ interaction with PPi drives conversion of luciferin into Oxiluciferin to produce light and is responsible for the light emission after the peak. To examine the effect of PPases on real-time BART-LAMP amplification curves, we compared Eiken LAMP buffer31 in the absence and presence of PPases. Eiken LAMP without PPases produced a high initial background signal and a unique sharp peak (Figure S4a) consistent with previous reports19 of amplification curves obtained in the absence of PPases. When we added 1U PPase (New England Biolabs, Inc.) to the Eiken LAMP buffer, we observed a reduction in the background signal and broadening of the bioluminescence peak (Figure S4b) similar to the one observed with the OptiGene LAMP buffer (Figure S4c) that contains PPases. In this work, we use OptiGene LAMP buffer that includes PPases because it produces low initial background.
Quantitative Detection of ZIKV in Urine and Saliva
ZIKV infection is of growing concern since it is implicated in brain defects in newborns, including microcephaly, and in severe neurological and autoimmune complications.32–34 A few studies suggest that ZIKV detection in urine is more sensitive than in blood and has a longer window of detection.35,36 Since ZIKV is coendemic with and shares similar initial symptoms as infections caused by other arboviruses, such as dengue viruses (DENV), yellow fever virus (YFV), and chikungunya virus (CHIKV),37,38 diagnosis is needed for disease management.
To demonstrate the compatibility of our SCC platform with bioluminescent detection for point-of-care molecular diagnostics, we used ZIKV as the model analyte and carried out viral RNA extraction, amplification, and detection on chip (Figures 1c and 3a). We redesigned, for improved efficiency, a set of RT-LAMP primers,20 targeting the highly conserved envelope protein coding region (Figure S5). To address for possible mutations and maintain high amplification efficiency, we use degenerate primers. The primers’ sequences are given in Table S1. The primers were evaluated for possible cross-reactivity with other pathogens’ nucleic acids en silico and with DENV and CHIKV nucleic acids (Figures 5a and S5a). Our primers successfully distinguished ZIKV from DENV and CHIKV.
Figure 5.
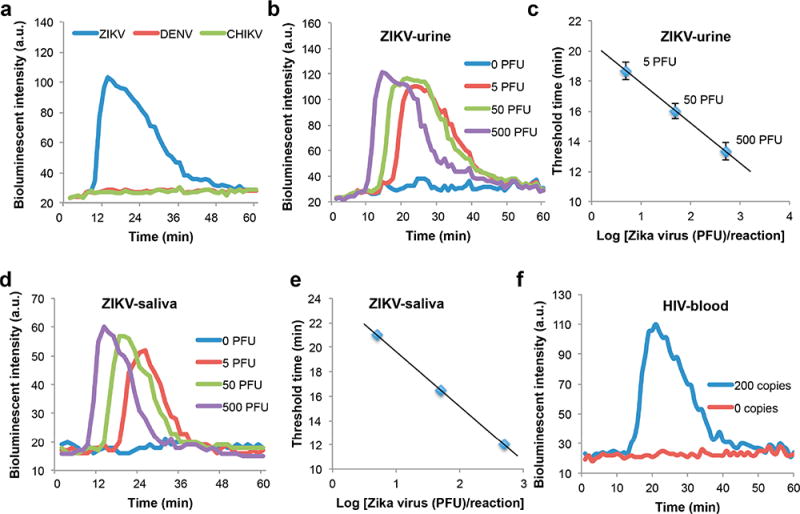
Quantitative detection of ZIKV in urine and saliva and HIV detection in blood. (a) Real-time monitoring of our BART-LAMP assay for ZIKV in the presence of 50 000 PFU ZIKV, DENV, or CHIKV. Only samples containing ZIKV are positive. (b) Real-time monitoring of BART-LAMP assay of urine samples spiked with 500, 50, 5, and 0 PFU (negative control) ZIKV per sample. (c) The threshold time Tt (in minutes) is depicted as a function of the ZIKV concentration (PFU per sample). The error bars indicate the scatter of the data (n = 3). (d) Real-time monitoring of BART-LAMP assay of saliva samples spiked with 500, 50, 5, and 0 PFU (negative control) per sample. (e) The threshold time Tt (in minutes) is depicted as a function of the ZIKV concentration (PFU per sample). (f) HIV detection in blood to demonstrate our SCC’s universality for various human samples.
Video S2 shows real-time bioluminescence monitoring of four multifunctional amplification reactors with 500, 50, 5, and 0 (negative control) PFU ZIKV (American strain mex 2–81) in urine samples. The higher the target concentration, the earlier the amplification reactor lights up. In the negative control reactor, the bioluminescence intensity remained nearly constant and very low throughout the entire incubation period. Figure 5b shows the bioluminescence emission intensity as a function of time when the sample contains 500, 50, 5, and 0 PFU of ZIKV in urine samples. We define the threshold time (Tt) as the time that elapses from the start of the enzymatic reaction until the bioluminescence intensity reaches half its peak height. Figure 5c depicts the threshold time Tt (min) as a function of ZIKV concentration (C) on a semilog plot. Our experiments indicate that our SCC is suitable for nucleic acid amplification and that the use of threshold time measurement provides reliable target quantification with a sensitivity of 5 PFU per urine sample.
Saliva is considered a suitable and convenient sample type for ZIKV.39,40 Here, we carried out sequence experiments to detect ZIKV in saliva (Figure 5d,e). We achieved a similar performance to the one reported with urine samples (Figure 5b,c). Our SCC’s results are also comparable with the ones obtained with a benchtop instrument (Figure S5b). Our studies indicate that ZIKV in urine and saliva can be detected with a simple POC device with performance comparable to benchtop equipment.
HIV Detection in Blood
Individuals undergoing HIV therapy require periodic viral load monitoring to (i) assess evolution of mutations that may require alternations in therapy and (ii) ensure compliance with the drug regimen.41 To demonstrate our SCC platform’s capability to process diverse human samples and targets, we tested the device’s suitability for HIV detection (Figure 5f). The test was carried out with plasma spiked with HIV virions. Plasma was separated from whole blood with our POC plasma separator22 and then inserted into our chip.
Smart and Connected Disease Surveillance
Interconnectivity is a hallmark of contemporary technology. Sensors, actuators, and embedded electronics enable real-time, networked data collection and analysis, as well as distributed control, connectivity, customization or personalization, and adaptability, forming an Internet of Things. In the area of healthcare, an Internet of Medical Things (IoMT),42–45 i.e., interconnected, networked medical devices, will offer new paradigms of diagnosis, personalized therapy, epidemiology, and healthcare services in a timely, sustainable, individualized, and cost-effective mode of delivery. However, current IoMT devices are limited to detecting or monitoring physiological data such as heart rate, blood pressure, body temperature, ECG, and blood glucose.42–45 IoMT POC molecular diagnostic devices that monitor diseases have many potential benefits.
To demonstrate the connectivity of our SCC as an IoMT POC molecular diagnostic device and its utilization for spatial disease mapping, we designed a website to map GPS locations of the tests in a designated region (Figure 6). The website can show the detection information, such as location of tests and test results. When desired, other patients’ information such as age, gender, ethnic group, and occupation can be included for spatial epidemiology studies based on big data analysis.
Figure 6.
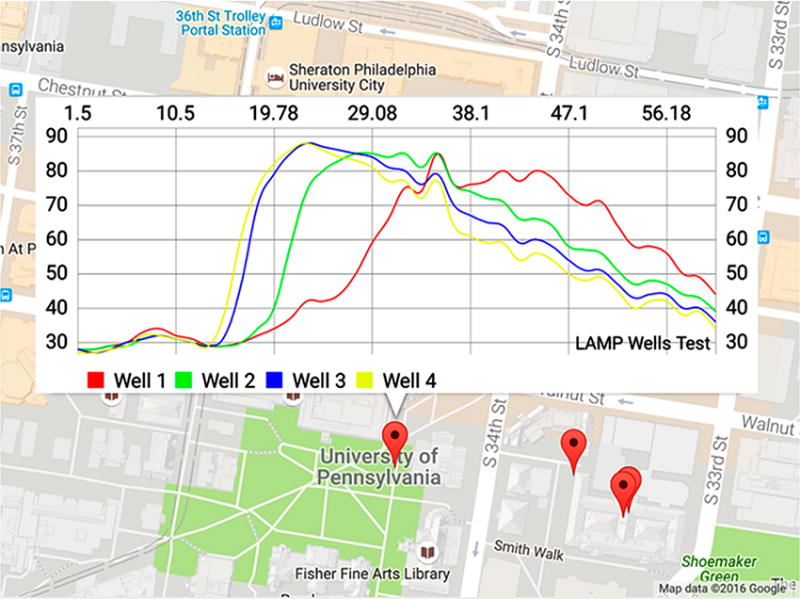
Spatiotemporal mapping of disease detection using a Google Maps-based interface. Copyright 2016, with permission from Google Inc.
CONCLUSIONS
We designed, fabricated, and tested a simple, inexpensive, handheld, smartphone-based mobile detection platform for molecular diagnostics of infectious diseases in diverse biological samples such as urine, saliva, and blood. Our disposable microfluidic chip houses multifunctional reactors, each equipped with a flow-through nucleic acid immobilization membrane to capture, concentrate, and purify nucleic acids from raw samples. Our flow-through configuration decouples sample volume from reaction volume and enables processing of large sample volumes for high sensitivity with little added complexity over that of rapid tests operating with raw samples. Our method also calls for the storing of lyophilized reaction mix, encapsulated in paraffin, in the amplification reactor for just-in-time release and hydration once the reactor reaches its operating temperature. This storage method enables long shelf life without refrigeration and streamlines flow control. We demonstrated this storage strategy elsewhere46 but have not used it here due to cost considerations of lyophilizing small quantities of reaction mixes. Our SCC utilizes exothermic chemical reaction as a heat source to incubate the isothermal amplification and a phase-change material to regulate incubation temperature and maintain it independent of ambient conditions. In other words, the SCC operates without any need for electrical power and with a very simple, inexpensive means to control temperature. Our SCC also provides an interface for a smartphone.
In contrast to the fluorescence reporters, we use here luciferin reporters fueled by byproducts of polymerase to emit light. Bioluminescent reporters have several important advantages over the more commonly used fluorescent reporters. First, bioluminescent reporters do not require excitation. Second, microfluidic components may self-fluoresce and produce background emission, while background emission is absent with bioluminescent reporters. Third, fluorescent reporters require the use of optical filters to separate between excitation and emission spectra while no filters are needed when bioluminescent reporters are used, which reduces cost and complexity.
We have developed a custom smartphone App that can instruct the user in carrying out the various steps needed for the test. Once the diagnostic chip is inserted into the SCC, our custom App adjusts the camera’s shutter to provide a sufficiently long exposure time to acquire detectable bioluminescent emission and dictates camera frame rate. The smartphone camera then monitors the bioluminescent emission during polymerase amplification. The App digitizes and stores emission intensity as a function of time and calculates threshold time. The software can compare the test’s threshold time with a calibration table and report positive or negative test and number of virions on the smartphone’s screen.
Here, we demonstrated our SCC’s performance by quantitative detection of zika virus in urine and saliva and HIV in blood within 45 min. In comparison, current emergency approved tests utilize expensive and complex thermal cyclers (i.e., PCR machines); require trained personnel; require sample shipment to a centralized laboratory, risking sample degradation; may take a few days from test to results, assuming reliable logistic networks. The current technology deprives health care providers from essential information to make timely evidence-based decisions. With our SCC, the test can be performed by the patients themselves or next to the patient by minimally trained personnel, making sophisticated molecular diagnostics accessible at home and in resource-limited settings. The SCC can, of course, be adapted to detect other targets than ZIKV and HIV and is amenable to multiplexing.47
Additionally, we have demonstrated SCC’s connectivity, enabling spatiotemporal disease mapping on a custom-designed website. Our SCC serves as an IoMT device for molecular diagnostics that can transmit test results to the doctor’s office and communicate test information (i.e., GPS location, time, and deidentified results) to public health officials, providing critical data to policy makers and epidemiologists.
Supplementary Material
Video S1: An animation illustrating the various components of the smart cup (MPG)
Video S2: Real time smartphone-based detection of BART-LAMP emission from a multifunctional amplification chip (MP4)
Acknowledgments
This work was partially supported by NIH Grants R01CA214072, R01EB023607, R21DE026700, 1R21AI128059-A1, R21TW010625, and NAS AID-OAA-A-11-00012.
Footnotes
ORCID
Jinzhao Song: 0000-0002-2097-8685
Changchun Liu: 0000-0002-4931-986X
Notes
The authors declare no competing financial interest.
Supporting Information
The Supporting Information is available free of charge on the ACS Publications website at DOI: 10.1021/acs.analchem.8b00283.
The working principle of BART-LAMP assay; benchtop RT-LAMP ZIKV detection (PDF)
References
- 1.Chin CD, Laksanasopin T, Cheung YK, Steinmiller D, Linder V, Parsa H, Wang J, Moore H, Rouse R, Umviligihozo G, Karita E, Mwambarangwe L, Braunstein SL, van de Wijgert J, Sahabo R, Justman JE, El-Sadr W, Sia SK. Nat Med. 2011;17:1015–1019. doi: 10.1038/nm.2408. [DOI] [PubMed] [Google Scholar]
- 2.Mauk M, Song J, Bau HH, Gross R, Bushman FD, Collman RG, Liu C. Lab Chip. 2017;17:382–394. doi: 10.1039/c6lc01239f. [DOI] [PMC free article] [PubMed] [Google Scholar]
- 3.Yager P, Edwards T, Fu E, Helton K, Nelson K, Tam MR, Weigl BH. Nature. 2006;442:412–418. doi: 10.1038/nature05064. [DOI] [PubMed] [Google Scholar]
- 4.Faye O, Faye O, Diallo D, Diallo M, Weidmann M, Sall AA. Virol J. 2013;10:311. doi: 10.1186/1743-422X-10-311. [DOI] [PMC free article] [PubMed] [Google Scholar]
- 5.Chen DF, Mauk M, Qiu XB, Liu CC, Kim JT, Ramprasad S, Ongagna S, Abrams WR, Malamud D, Corstjens PLAM, Bau HH. Biomed Microdevices. 2010;12:705–719. doi: 10.1007/s10544-010-9423-4. [DOI] [PMC free article] [PubMed] [Google Scholar]
- 6.Yang S, Rothman RE. Lancet Infect Dis. 2004;4:337–348. doi: 10.1016/S1473-3099(04)01044-8. [DOI] [PMC free article] [PubMed] [Google Scholar]
- 7.Dimov IK, Basabe-Desmonts L, Garcia-Cordero JL, Ross BM, Park Y, Ricco AJ, Lee LP. Lab Chip. 2011;11:4279. doi: 10.1039/c0lc00403k. [DOI] [PubMed] [Google Scholar]
- 8.Liu CC, Qiu XB, Ongagna S, Chen DF, Chen ZY, Abrams WR, Malamud D, Corstjens PLAM, Bau HH. Lab Chip. 2009;9:768–776. doi: 10.1039/b814322f. [DOI] [PMC free article] [PubMed] [Google Scholar]
- 9.Thorsen T, Maerkl SJ, Quake SR. Science. 2002;298:580–584. doi: 10.1126/science.1076996. [DOI] [PubMed] [Google Scholar]
- 10.Chen X, Cui DF, Liu CC, Li H, Chen J. Anal Chim Acta. 2007;584:237–243. doi: 10.1016/j.aca.2006.11.057. [DOI] [PubMed] [Google Scholar]
- 11.Easley CJ, Karlinsey JM, Bienvenue JM, Legendre LA, Roper MG, Feldman SH, Hughes MA, Hewlett EL, Merkel TJ, Ferrance JP, Landers JP. Proc Natl Acad Sci U S A. 2006;103:19272–19277. doi: 10.1073/pnas.0604663103. [DOI] [PMC free article] [PubMed] [Google Scholar]
- 12.Qiu XB, Chen DF, Liu CC, Mauk MG, Kientz T, Bau HH. Biomed Microdevices. 2011;13:809–817. doi: 10.1007/s10544-011-9551-5. [DOI] [PubMed] [Google Scholar]
- 13.Steinhubl SR, Muse ED, Topol EJ. Sci Transl Med. 2015;7:283rv3. doi: 10.1126/scitranslmed.aaa3487. [DOI] [PMC free article] [PubMed] [Google Scholar]
- 14.Ozcan A. Lab Chip. 2014;14:3187–3194. doi: 10.1039/c4lc00010b. [DOI] [PMC free article] [PubMed] [Google Scholar]
- 15.Priye A, Bird SW, Light YK, Ball CS, Negrete OA, Meagher RJ. Sci Rep. 2017;7:44778. doi: 10.1038/srep44778. [DOI] [PMC free article] [PubMed] [Google Scholar]
- 16.Damhorst GL, Duarte-Guevara C, Chen W, Ghonge T, Cunningham BT, Bashir R. Engineering (Beijing) 2015;1:324–335. doi: 10.15302/J-ENG-2015072. [DOI] [PMC free article] [PubMed] [Google Scholar]
- 17.Chen W, Yu H, Sun F, Ornob A, Brisbin R, Ganguli A, Vemuri V, Strzebonski P, Cui G, Allen KJ, Desai SA, Lin W, Nash DM, Hirschberg DL, Brooks I, Bashir R, Cunningham BT. Anal Chem. 2017;89:11219–11226. doi: 10.1021/acs.analchem.7b02478. [DOI] [PubMed] [Google Scholar]
- 18.Liao SC, Peng J, Mauk MG, Awasthi S, Song JZ, Friedman H, Bau HH, Liu CC. Sens Actuators, B. 2016;229:232–238. doi: 10.1016/j.snb.2016.01.073. [DOI] [PMC free article] [PubMed] [Google Scholar]
- 19.Gandelman OA, Church VL, Moore CA, Kiddle G, Carne CA, Parmar S, Jalal H, Tisi LC, Murray JAH. PLoS One. 2010;5:e14155. doi: 10.1371/journal.pone.0014155. [DOI] [PMC free article] [PubMed] [Google Scholar]
- 20.Song JZ, Mauk MG, Hackett BA, Cherry S, Bau HH, Liu CC. Anal Chem. 2016;88:7289–7294. doi: 10.1021/acs.analchem.6b01632. [DOI] [PMC free article] [PubMed] [Google Scholar]
- 21.https://www.qiagen.com/us/shop/sample-technologies/rna/viral-rna/qiaamp-viral-rna-mini-kit/; ordering information (accessed March 2, 2018).
- 22.Liu CC, Liao SC, Song JZ, Mauk MG, Li XW, Wu GX, Ge DT, Greenberg RM, Yang S, Bau HH. Lab Chip. 2016;16:553–560. doi: 10.1039/c5lc01235j. [DOI] [PMC free article] [PubMed] [Google Scholar]
- 23.Liu CC, Geva E, Mauk M, Qiu XB, Abrams WR, Malamud D, Curtis K, Owen SM, Bau HH. Analyst. 2011;136:2069–2076. doi: 10.1039/c1an00007a. [DOI] [PMC free article] [PubMed] [Google Scholar]
- 24.Heid CA, Stevens J, Livak KJ, Williams PM. Genome Res. 1996;6:986–994. doi: 10.1101/gr.6.10.986. [DOI] [PubMed] [Google Scholar]
- 25.Arya M, Shergill IS, Williamson M, Gommersall L, Arya N, Patel HR. Expert Rev Mol Diagn. 2005;5:209–219. doi: 10.1586/14737159.5.2.209. [DOI] [PubMed] [Google Scholar]
- 26.Klein D. Trends Mol Med. 2002;8:257–260. doi: 10.1016/s1471-4914(02)02355-9. [DOI] [PubMed] [Google Scholar]
- 27.Chen W, Martinez G, Mulchandani A. Anal Biochem. 2000;280:166–172. doi: 10.1006/abio.2000.4518. [DOI] [PubMed] [Google Scholar]
- 28.http://www.optigene.co.uk/ (accessed March 2, 2018).
- 29.Miyamoto S, Sano S, Takahashi K, Jikihara T. Anal Biochem. 2015;473:28–33. doi: 10.1016/j.ab.2014.12.016. [DOI] [PubMed] [Google Scholar]
- 30.Park SY, Lee B, Park KS, Chong Y, Yoon MY, Jeon SJ, Kim DE. Appl Microbiol Biotechnol. 2010;85:807–812. doi: 10.1007/s00253-009-2314-z. [DOI] [PubMed] [Google Scholar]
- 31.http://loopamp.eiken.co.jp/e/tech/ (accessed March 2, 2018).
- 32.Cao-Lormeau VM, Blake A, Mons S, Lastere S, Roche C, Vanhomwegen J, Dub T, Baudouin L, Teissier A, Larre P, Vial AL, Decam C, Choumet V, Halstead SK, Willison HJ, Musset L, Manuguerra JC, Despres P, Fournier E, Mallet HP, Musso D, Fontanet A, Neil J, Ghawche F. Lancet. 2016;387:1531–1539. doi: 10.1016/S0140-6736(16)00562-6. [DOI] [PMC free article] [PubMed] [Google Scholar]
- 33.Lucchese G, Kanduc D. Autoimmun Rev. 2016;15:801–808. doi: 10.1016/j.autrev.2016.03.020. [DOI] [PubMed] [Google Scholar]
- 34.Lazear HM, Diamond MS. J Virol. 2016;90:4864–4875. doi: 10.1128/JVI.00252-16. [DOI] [PMC free article] [PubMed] [Google Scholar]
- 35.Gourinat AC, O’Connor O, Calvez E, Goarant C, Dupont-Rouzeyrol M. Emerging Infect Dis. 2015;21:84–86. doi: 10.3201/eid2101.140894. [DOI] [PMC free article] [PubMed] [Google Scholar]
- 36.Campos RD, Cirne-Santos C, Meira GLS, Santos LLR, de Meneses MD, Friedrich J, Jansen S, Ribeiro MS, Cruz IC, Schmidt-Chanasit J, Ferreira DF. J Clin Virol. 2016;77:69–70. doi: 10.1016/j.jcv.2016.02.009. [DOI] [PubMed] [Google Scholar]
- 37.Giry C, Roquebert B, Li-Pat-Yuen G, Gasque P, Jaffar-Bandjee MC. BMC Microbiol. 2017;17:164. doi: 10.1186/s12866-017-1080-9. [DOI] [PMC free article] [PubMed] [Google Scholar]
- 38.Roth A, Mercier A, Lepers C, Hoy D, Duituturaga S, Benyon E, Guillaumot L, Souares Y. Eurosurveillance. 2014;19:20929. doi: 10.2807/1560-7917.es2014.19.41.20929. [DOI] [PubMed] [Google Scholar]
- 39.Jayakumar P, Brar K, Lippmann S. South Med J. 2016;109:697. doi: 10.14423/SMJ.0000000000000550. [DOI] [PubMed] [Google Scholar]
- 40.Musso D, Roche C, Nhan TX, Robin E, Teissier A, Cao-Lormeau VM. J Clin Virol. 2015;68:53–55. doi: 10.1016/j.jcv.2015.04.021. [DOI] [PubMed] [Google Scholar]
- 41.Machouf N, Thomas R, Nguyen VK, Trottier B, Boulassel MR, Wainberg MA, Routy JP. J Med Virol. 2006;78:608–613. doi: 10.1002/jmv.20582. [DOI] [PubMed] [Google Scholar]
- 42.Haghi M, Thurow K, Stoll R. Healthc Inform Res. 2017;23:4–15. doi: 10.4258/hir.2017.23.1.4. [DOI] [PMC free article] [PubMed] [Google Scholar]
- 43.Dimitrov DV. Healthc Inform Res. 2016;22:156–163. doi: 10.4258/hir.2016.22.3.156. [DOI] [PMC free article] [PubMed] [Google Scholar]
- 44.Sieverink F, Siemons L, Braakman-Jansen A, van Gemert-Pijnen L. Stud Health Technol Inform. 2016;221:129. [PubMed] [Google Scholar]
- 45.Konstantinidis EI, Bamparopoulos G, Billis A, Bamidis PD. Stud Health Technol Inform. 2015;210:587–591. [PubMed] [Google Scholar]
- 46.Song J, Liu C, Mauk MG, Peng J, Schoenfeld T, Bau HH. Anal Chem. 2018;90:1209–1216. doi: 10.1021/acs.analchem.7b03834. [DOI] [PMC free article] [PubMed] [Google Scholar]
- 47.Song JZ, Liu CC, Mauk MG, Rankin SC, Lok JB, Greenberg RM, Bau HH. Clin Chem. 2017;63:714–722. doi: 10.1373/clinchem.2016.263665. [DOI] [PMC free article] [PubMed] [Google Scholar]
Associated Data
This section collects any data citations, data availability statements, or supplementary materials included in this article.
Supplementary Materials
Video S1: An animation illustrating the various components of the smart cup (MPG)
Video S2: Real time smartphone-based detection of BART-LAMP emission from a multifunctional amplification chip (MP4)


