Abstract
Background
We aimed to identify pivotal genes and pathways involved in pancreatic ductal adenocarcinoma (PDAC), and explore possible molecular markers for the early diagnosis of the disease.
Material/Methods
The array data of GSE74629, including 34 PDAC samples and 16 healthy samples, was downloaded from GEO (Gene Expression Omnibus) database. Then, the DEGs (differentially expressed genes) in PDAC samples were compared with healthy samples using limma (linear models for microarray). Gene functional interaction networks were analyzed with Cytoscape and ReactomeFIViz. PPI networks were constructed with Cytoscape software. In addition, PPI (protein-protein interaction) network clustering modules were analyzed with ClusterONE, and the KEGG (Kyoto Encyclopedia of Genes and Genomes) pathway enrichment analyses for modules were performed.
Results
A total of 630 upregulated and 1,002 downregulated DEGs were identified in PDAC samples compared with healthy samples. Some ribosomal protein genes with higher average correlation in module 0 were enriched in the ribosome pathway. NUP107 (nucleoporin 107 kDa) and NUP160 (nucleoporin 160 kDa) were enriched in module 3. HNRNPU (heterogeneous nuclear ribonucleoprotein U) with higher average correlation in module 8 was enriched in the spliceosome pathway. The ribosome pathway and the spliceosome pathway were significantly enriched in cluster 1 and cluster 2, respectively.
Conclusions
Ribosomal protein genes Nup170, Nup160, and HNRNPU, and the ribosome pathway as well as the spliceosome pathway may play important roles in PDAC progression. In addition, ribosomal protein genes Nup170, Nup160, and HNRNPU may be used as possible molecular markers for the early diagnosis of the disease.
MeSH Keywords: Carcinoma, Pancreatic Ductal; Chemistry, Bioinorganic; Community Networks
Background
Pancreatic ductal adenocarcinoma (PDAC), the most common pancreatic neoplasm, is expected to turn into the second most common cause of deaths associated with cancer by 2030 [1,2]. It is estimated that a total of 45,220 patients will be diagnosed with pancreatic cancer and 38,460 will die of this disease in the United States in 2013 [3]. Risk factors for PDAC include age, gender, ethnicity, cigarette smoking [4,5]. In addition, a very poor overall prognosis is one of the most important characteristic of PDAC, and the median survival time after diagnosis is only 3–5 months [6]. Thus, accurate early diagnosis for PDAC is needed and discovery of the molecular mechanisms may provide a new option for the early diagnosis of PDAC.
Recently, a wealth of previous studies has been applied to gain a better understanding of the molecular mechanisms of PDAC. One study showed that SEL1L (Sel-1-like) was downregulated by upregulated has-miR-155 in PDAC patients, which suggested that specific miRNAs played important roles in the pathogenesis of this disease [7]. Steele et al. suggested that microRNA (miRNA) such as miR-21 might serve as a screening tool for PDAC in the future [8]. The miR-10b is upregulated in PDAC and can be used as a diagnostic marker in suspicious pancreatic lesions [9]. Furthermore, the serum MMP7 (matrix metalloproteinase 7) level in PDAC patients correlates with metastatic disease and survival [10]. Oji et al. indicated that WT1 (Wilms Tumor 1) played a significant part in the tumorigenesis of PDAC and provided a new option for the treatment of this disease [11]. In addition, mutation of TP53 (tumor protein 53) contributes to rapid progression of premalignant cells to pancreatic tumor and FoxM1 (forkhead box M1) can be used as prognostic molecular marker for PDAC [12,13]. Besides, activation of the Jak/Stat3 (Janus kinase/signal transducer and activator of transcription 3) pathway is related with adverse outcome of PDAC after resection [14]. The Wnt pathway regulates the metastasis-promoting mucin 4 in PDAC, and then contributes to disease metastases and progression [15]. However, since these genes and pathways are not sufficient to clarify the molecular mechanisms of the PDAC, there is a need to identify more pivotal genes and pathways important in the progression of this disease.
Gene expression technologies are increasingly being used to identify DEGs (differentially expressed genes) in neoplastic tissues compared with their normal tissues [16]. In the present study, we downloaded the array data of GSE74629 and analyzed the DEGs associated with PDAC. Then, functional network analyses were performed for these DEGs. In addition, protein-protein interaction (PPI) network and important clustering modules were analyzed. We aimed to find pivotal genes and pathways involved in PDAC, and explore possible molecular markers for the early diagnosis of the disease.
Material and Methods
Microarray data
The array data of GSE74629 was downloaded from GEO (Gene Expression Omnibus, http://www.ncbi.nlm.nih.gov/geo/) database with the platform of GPL10558 (Illumina HumanHT-12 V4.0 expression beadchip, Jaen, Spain). A total of 34 PDAC samples and 16 healthy samples were included in this study.
Data preprocessing
The downloaded non-normalized gene expression data were preprocessed by limma (linear models for microarray) [17] in R package, including background correcting, normalizing and calculating expression. Then, the probe ID was transformed to gene symbol with illuminaHumanv4.db [18] in R annotation package and the probe that was not matched with gene symbol was eliminated. For one gene symbol mapped by several probes, the mean value of these probes was set as the final gene expression level. Finally, totally 21,318 gene expression values were obtained.
Screening of DEGs
The DEGs in PDAC samples compared with healthy samples were analyzed with limma. The p-values were calculated by t-test [19] in limma package. BH (Benjamini-Hochberg) [20] was used to adjust p-values into FDR (false discovery rate) values. FDR <0.05 and |log2FC (fold change)| ≥0.58 were set as cutoff criterion for DEGs.
Functional network analysis
The ReactomeFIViz app [21] can calculate correlations (as weights for edges in the whole functional interaction network) among genes involved in the same functional interactions, apply Monte Carlo localization graph clustering algorithm to the weighted functional interaction network, and form a sub-network for selected network modules on the basis of module size and average correlation.
In the present study, Cytoscape [22] and ReactomeFIViz app were used to analyze gene functional interaction network. Modules size ≥6 and average correlation ≥0.25 were set as criteria. Subsequently, pathway enrichment analyses were performed for each function module, and biological pathways involved by each module gene were observed with FDR <0.05.
PPI network analysis
STRING (Search Tool for the Retrieval of Interacting Genes) [23] is a database used to provide information of interaction of proteins, and neighborhood, gene fusion, co-occurrence, co-expression experiments, databases and text mining were prediction method of this database. In this study, the input gene sets were gene modules and species were Homo sapiens. PPI score >0.9 was set as the cutoff value and at least one protein interaction nodes was a module gene. PPI networks were constructed with Cytoscape software.
PPI network clustering modules analyses
KEGG (Kyoto Encyclopedia of Genes and Genomes) can be used to reveal functions of genes or other molecules [24]. The subnetwork modules in the PPI network tended to take part in common biological processes. ClusterONE [25] was used to analyze network modules, and the KEGG pathway enrichment analyses for modules were performed. Modules that p-value <3E-4 were set as significant modules.
Results
Data processing and DEGs analysis
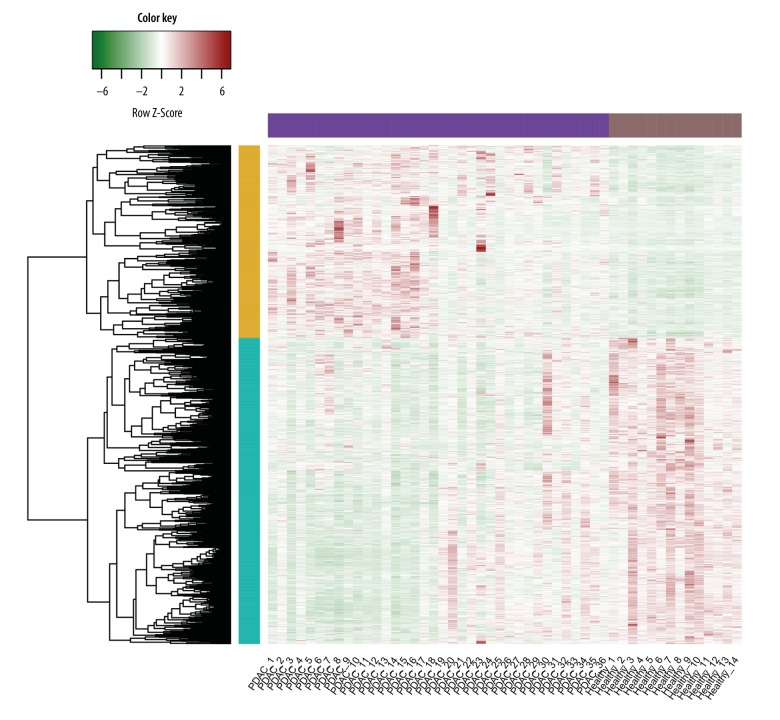
As shown in Figure 1, a total of 630 upregulated and 1,002 downregulated genes were differently expressed in PDAC samples compared with healthy samples.
Figure 1.
Heat map of differentially expressed genes (DEGs). The green represents higher expression levels; the red represents lower expression levels.
Functional network analysis
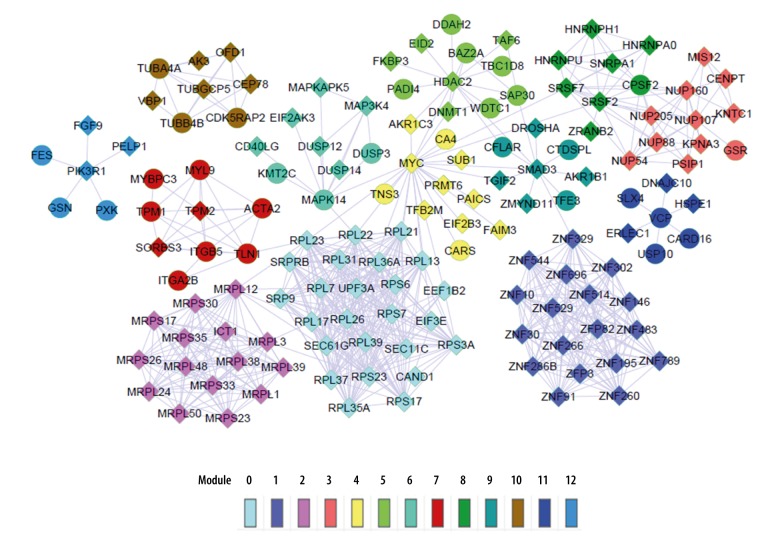
A total of 13 subnetwork modules including 146 nodes and 684 gene pairs were included in the network (Figure 2). Particularly, the average correlation of module 0, module 3, and module 8 was greater than 0.6, which indicated strong correlation (Table 1).
Figure 2.
Functional network of differentially expressed genes (DEGs). Different colors represent different modules; diamond-shaped nodes represent downregulated genes; circular nodes represent upregulated genes.
Table 1.
Information list of 13 sub network modules.
| Module | Nodes in module | Node percentage | Average correlation | Node list |
|---|---|---|---|---|
| 0 | 25 | 0.1701 | 0.6255 | CAND1, EEF1B2, EIF3E, RPL13, RPL17, RPL21, RPL22, RPL23, RPL26, RPL31, RPL35A, RPL36A, RPL37, RPL39, RPL7, RPS17, RPS23, RPS3A, RPS6, RPS7, SEC11C, SEC61G, SRP9, SRPRB, UPF3A |
| 1 | 18 | 0.1224 | 0.4769 | ZFP3, ZFP82, ZNF10, ZNF146, ZNF195, ZNF260, ZNF266, ZNF286B, ZNF30, ZNF302, ZNF329, ZNF483, ZNF514, ZNF529, ZNF544, ZNF696, ZNF789, ZNF91 |
| 2 | 15 | 0.102 | 0.4808 | ICT1, MRPL1, MRPL12, MRPL24, MRPL3, MRPL38, MRPL39, MRPL48, MRPL50, MRPS17, MRPS23, MRPS26, MRPS30, MRPS33, MRPS35 |
| 3 | 11 | 0.0748 | 0.602 | CENPT, GSR, KNTC1, KPNA3, MIS12, NUP107, NUP160, NUP205, NUP54, NUP88, PSIP1 |
| 4 | 11 | 0.0748 | 0.4621 | AKR1C3, CA4, CARS, EIF2B3, FAIM3, MYC, PAICS, PRMT6, SUB1, TFB2M, TNS3 |
| 5 | 11 | 0.0748 | 0.4021 | BAZ2A, DDAH2, DNMT1, EID2, FKBP3, HDAC2, PADI4, SAP30, TAF6, TBC1D8, WDTC1 |
| 6 | 9 | 0.0612 | 0.5257 | CD40LG, DUSP12, DUSP14, DUSP3, EIF2AK3, KMT2C, MAP3K4, MAPK14, MAPKAPK5 |
| 7 | 9 | 0.0612 | 0.4102 | ACTA2, ITGA2B, ITGB5, MYBPC3, MYL9, SORBS3, TLN1, TPM1, TPM2 |
| 8 | 8 | 0.0544 | 0.6486 | CPSF2, HNRNPA0, HNRNPH1, HNRNPU, SNRPA1, SRSF2, SRSF7, ZRANB2 |
| 9 | 8 | 0.0544 | 0.5985 | AKR1B1, CFLAR, CTDSPL, DROSHA, SMAD3, TFE3, TGIF2, ZMYND11 |
| 10 | 8 | 0.0544 | 0.4305 | AK3, CDK5RAP2, CEP78, OFD1, TUBA4A, TUBB4B, TUBGCP5, VBP1 |
| 11 | 7 | 0.0476 | 0.4346 | CARD16, DNAJC10, ERLEC1, HSPE1, SLX4, USP10, VCP |
| 12 | 7 | 0.0476 | 0.3656 | FES, FGF9, GSN, PELP1, PIK3R1, PIK3R5, PXK |
Ribosomal protein genes, such as RPL13 (ribosomal protein L13), RPL17 (ribosomal protein L17), RPL21 (ribosomal protein L21), RPL22 (ribosomal protein L22), RPL23 (ribosomal protein L23), RPL26 (ribosomal protein L26), RPL31 (ribosomal protein L31), RPL35A (ribosomal protein L35A), RPL36A (ribosomal protein L36A), RPL37 (ribosomal protein L37), RPL39 (ribosomal protein L39), RPL7 (ribosomal protein L7), RPS17 (ribosomal protein S17), RPS23 (ribosomal protein S23), RPS3A (ribosomal protein S3A), RPS6 (ribosomal protein S6) and RPS7 (ribosomal protein S7) were enriched in module 0. NUP107 (nucleoporin 107 kDa) and NUP160 (nucleoporin 160 kDa) were enriched in module 3. HNRNPU (heterogeneous nuclear ribonucleoprotein U) was enriched in module 8.
Pathway analysis of functional network module and PPI network analysis
Pathways significantly enriched by each module are shown in Table 2. Ribosomal protein genes were mainly enriched in three pathways including SRP-dependent co-translational protein targeting to membrane, eukaryotic translation termination, and ribosome. NUP107 and NUP160 were mainly enriched in two pathways including hexose transport and metabolism of non-coding RNA. HNRNPU was mainly enriched in the spliceosome pathway.
Table 2.
Pathways significantly enriched by each module.
| Module | GeneSet | FDR | Nodes |
|---|---|---|---|
| 0 | SRP-dependent cotranslational protein targeting to membrane(R) | <1.667e-04 | RPL17, RPL36A, RPL13, RPL37, RPL39, RPL7, RPS3A, RPL31, RPS23, RPL35A, SEC11C, RPL26, SRPRB, RPS6, RPS7, RPL23, RPS17, RPL22, RPL21, SEC61G, SRP9 |
| 0 | Eukaryotic Translation Termination(R) | <1.667e-04 | RPL17, RPL36A, RPL13, RPL37, RPL39, RPL7, RPS3A, RPL31, RPS23, RPL35A, RPL26, RPS6, RPS7, RPL23, RPS17, RPL22, RPL21 |
| 0 | Ribosome(K) | <1.667e-04 | RPL17, RPL36A, RPL13, RPL37, RPL39, RPL7, RPS3A, RPL31, RPS23, RPL35A, RPL26, RPS6, RPS7, RPL23, RPS17, RPL22, RPL21 |
| 2 | Mitochondrial translation(R) | <1.000e-03 | MRPS35, MRPS17, MRPS26, MRPL1, MRPS33, MRPL50, MRPL3, MRPS23, MRPS30, MRPL24, MRPL12, ICT1, MRPL38, MRPL39, MRPL48 |
| 2 | Ribosome(K) | <5.000e-04 | MRPS17, MRPL1, MRPL3, MRPL24, MRPL12 |
| 3 | ISG15 antiviral mechanism(R) | <1.000e-03 | NUP160, NUP88, NUP205, NUP107, NUP54, KPNA3 |
| 3 | Hexose transport(R) | <5.000e-04 | NUP160, NUP88, NUP205, NUP107, NUP54 |
| 3 | Metabolism of non-coding RNA(R) | <3.333e-04 | NUP160, NUP88, NUP205, NUP107, NUP54 |
| 5 | NoRC negatively regulates rRNA expression(R) | <1.000e-03 | SAP30, HDAC2, DNMT1, BAZ2A |
| 5 | Signaling events mediated by HDAC Class I(N) | <5.000e-04 | SAP30, HDAC2, FKBP3 |
| 5 | Hedgehog signaling events mediated by Gli proteins(N) | 3.83e-02 | SAP30, HDAC2 |
| 6 | Oxidative stress response(P) | <1.000e-03 | DUSP3, MAP3K4, DUSP14, MAPK14, MAPKAPK5, DUSP12 |
| 6 | MAPK signaling pathway(K) | 8.00e-03 | DUSP3, MAP3K4, MAPK14, MAPKAPK5 |
| 6 | p38 MAPK signaling pathway(N) | 2.17e-02 | MAP3K4, MAPK14 |
| 7 | Muscle contraction(R) | <1.000e-03 | SORBS3, TLN1, ACTA2, MYBPC3, ITGB5, TPM2, TPM1, MYL9 |
| 7 | Hypertrophic cardiomyopathy (HCM)(K) | <5.000e-04 | MYBPC3, ITGB5, TPM2, TPM1, ITGA2B |
| 7 | Dilated cardiomyopathy(K) | <3.333e-04 | MYBPC3, ITGB5, TPM2, TPM1, ITGA2B |
| 8 | Processing of Capped Intron-Containing Pre-mRNA(R) | <1.000e-03 | SRSF2, SNRPA1, SRSF7, HNRNPH1, CPSF2, HNRNPA0, HNRNPU |
| 8 | Spliceosome(K) | <5.000e-04 | SRSF2, SNRPA1, SRSF7, HNRNPU |
| 8 | spliceosomal assembly(B) | 1.33e-03 | SRSF2, SNRPA1 |
| 9 | Regulation of nuclear SMAD2/3 signaling(N) | <1.000e-03 | TFE3, SMAD3, TGIF2 |
| 9 | Regulation of cytoplasmic and nuclear SMAD2/3 signaling(N) | 7.00e-03 | CTDSPL, SMAD3 |
| 10 | Mitotic G2-G2/M phases(R) | <1.000e-03 | OFD1, TUBGCP5, CEP78, TUBA4A, CDK5RAP2, TUBB4B |
| 10 | Assembly of the primary cilium(R) | <5.000e-04 | OFD1, CEP78, TUBA4A, CDK5RAP2, TUBB4B |
| 10 | Protein folding(R) | <3.333e-04 | VBP1, TUBA4A, TUBB4B |
| 11 | Protein processing in endoplasmic reticulum(K) | 2.00e-03 | VCP, DNAJC10, ERLEC1 |
| 11 | Hedgehog ligand biogenesis(R) | 2.15e-02 | VCP, ERLEC1 |
| 12 | Signaling by SCF-KIT(R) | 7.00e-03 | FGF9, FES, PIK3R1 |
| 12 | Nongenotropic Androgen signaling(N) | 9.00e-03 | PELP1, PIK3R1 |
| 12 | Osteopontin-mediated events(N) | 7.67e-03 | GSN, PIK3R1 |
FDR – false discovery rate.
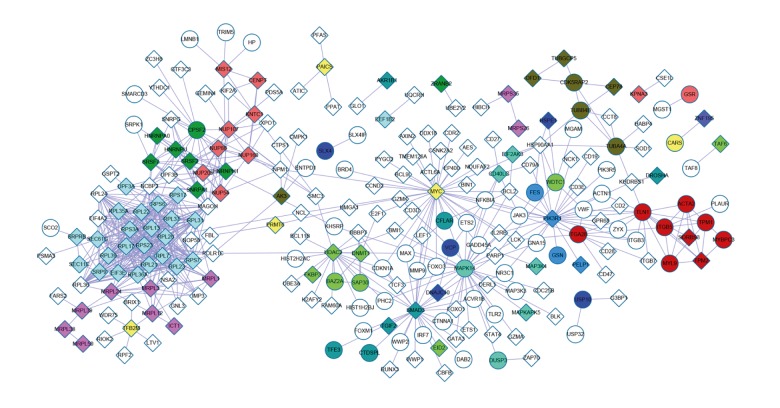
The PPI network for other DEGs interacted with 13 module genes was shown in Figure 3. A total of 243 nodes and 676 interaction pairs were included in this network.
Figure 3.
The PPI network of other differentially expressed genes (DEGs) interacted with 13 module genes. White represents other DEGs; the color of the modules was in line with Figure 2.
PPI network clustering modules analyses
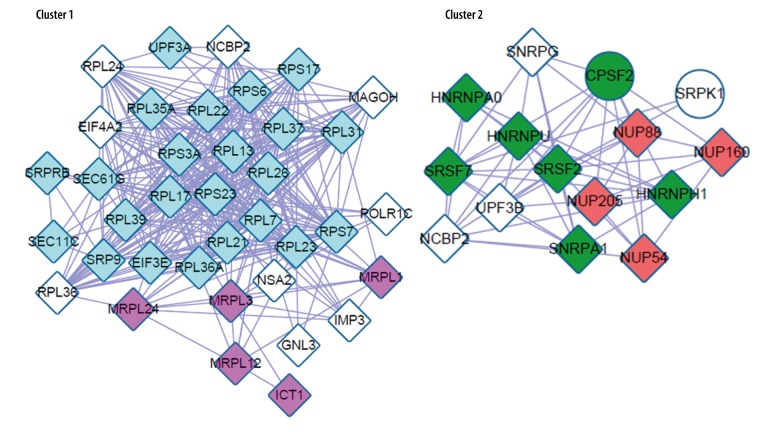
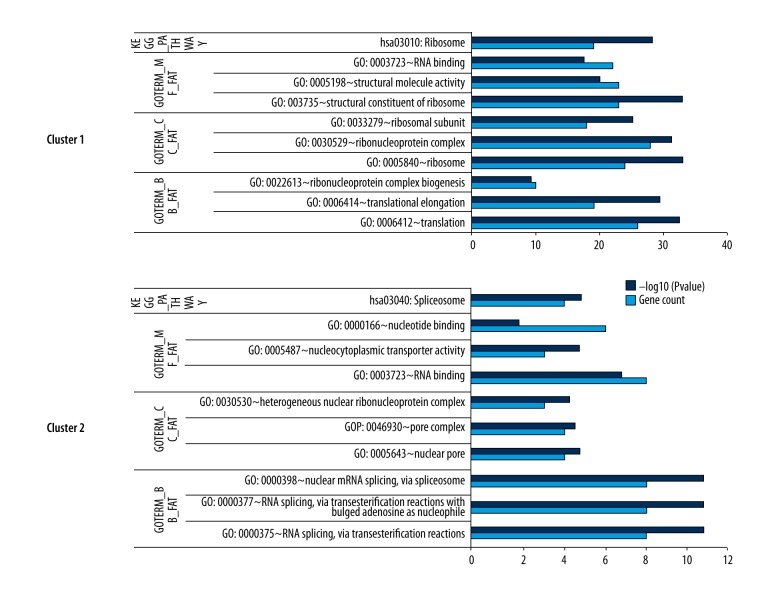
We obtained two subnetwork modules with ClusterOne (Figure 4), and the GO (Gene Ontology) and KEGG pathways significantly enriched in two subnetwork modules are shown in Figure 5.
Figure 4.
Two significantly enriched subnetwork modules (cluster 1 and cluster 2).
Figure 5.
GO and KEGG pathways significantly enriched by two subnetwork modules.
Cluster 1 was enriched by most of the ribosomal protein genes, and cluster 2 was enriched by NUP160 and HNRNPU. The ribosome pathway and the spliceosome pathway were significantly enriched in cluster 1 and cluster 2, respectively.
In this study, modules and clusters had similar meanings. The “modules” were obtained using ReactomeFI, and the “clusters” were obtained by ClusterOne. Sometimes, the results obtained by ClusterOne also could be called “modules”. The main difference between modules and clusters was that the former was function modules and the latter was cluster modules. In the present study, the results obtained by ClusterOne were presented as “clusters”.
Discussion
With the gene expression patterns obtained from the GEO database, a total of 630 upregulated and 1,002 downregulated genes were differently expressed in PDAC samples compared with healthy samples in our present study. Our results showed some ribosomal protein genes with higher average correlation in module 0 were enriched in the ribosome pathway. NUP107 and NUP160 were enriched in module 3. HNRNPU, with higher average correlation in module 8, was enriched in the spliceosome pathway. The ribosome pathway and the spliceosome pathway were significantly enriched in cluster 1 and cluster 2, respectively.
RPS6 is an mTOR effector and the mTOR pathway is activated in PDAC [26,27]. Phosphorylation of RPS6 attenuates DNA damage and tumor suppression for pancreatic cancer progression [26]. RPS26 regulates p53 activity and p53 plays an important role in the development of PDAC [28,29]. Furthermore, the abundance of RPS8 can determine the susceptibility of pancreatic cancer cells to gemcitabine treatment [30]. In addition, a higher abundance of RPS8 is related to worse survival of PDAC, and RPS8 may be an important prognostic factor [31]. In addition, downregulation of RPL15 is related to tumor development in PDAC [32]. Thus, some ribosomal protein genes, such as RPS6, RPS26 and RPS8, have been associated with the progression of PDAC. In the present study, some ribosomal protein genes with higher average correlation in module 0 were also enriched in cluster 1. Although the significant roles of some other ribosomal protein genes have not been fully discussed, we speculated that ribosomal protein genes may be involved in the development of PDAC.
Nup170 and Nup160 are significant components of the Nup107–160 complex, and the Nup107–160 complex plays an important role in the regulation of NPC (nuclear pore complex) assembly [33]. On the one hand, the Nup107–160 complex regulates microtubule polymerization at kinetochores [34]. Nup107–160 complex is an essential component for the recruitment of RanGAP1 (Ran GTPase-activating protein 1), RanBP2 (Ran GTPase-activating protein 2), and Crm1 (chromosomal maintenance 1) to these structures at kinetochores [35]. Furthermore, Nup170 is involved in kinetochore function and the overexpression of kinetochore may contribute to the development of tumor via driving chromosome instability [36,37]. On the other hand, Ran is an essential protein in the formation of nuclear envelope, and this mechanism is dependent on importin-β associated with Nup107–Nup160 [38]. Furthermore, Ran plays a significant role in the metastatic progression of cancer [38]. One study indicated that Nup170 was upregulated in pancreatic cancer [33]. In our present study, NUP107 and NUP160 were enriched in module 3, and NUP160 also was enriched in cluster 2. Thus, we speculated that Nup170 and Nup160 may play important roles in the development of PDAC.
HNRNPU can modulate WT1 transcriptional activation by directly interacting with WT1 [39], and WT1 plays a significant part in the tumorigenesis of PDAC [11]. HNRNPU interacts with MDM2 (E3 ubiquitin-protein ligase Mdm2) involving the degradation of p53 [40]. Furthermore, p53 as tumor suppressor genes plays a part in cell cycle regulation, and mutation of this gene may promote the growth of tumor cell [41]. Thus, HNRNPU may play a role in PDAC progression indirectly. In this study, HNRNPU with higher average correlation in module 8 was enriched in cluster 2. Therefore, our results were similar to other research and suggest that HNRNPU may be an important gene involved in the development of PDAC.
One study indicated that Myc might be involved in the early neoplastic progression of PDAC [42]. Furthermore, the spliceosome is a treatment entry point for Myc-driven cancer [43]. Thus, spliceosome may play important roles in the PDAC progression. In this study, the spliceosome pathway was significantly enriched in cluster 2, and HNRNPU was enriched in the spliceosome pathway. Therefore, HNRNPU may play important roles in the development of PDAC via the spliceosome pathway. In addition, the ribosome pathway was significantly enriched in cluster 1, and the ribosomal protein genes mainly enriched in the ribosome pathway. In addition, as aforementioned, the ribosomal protein genes may be involved in the development of PDAC. Therefore, ribosomal protein genes may play significant parts in the development of PDAC via ribosome pathway.
Conclusions
Ribosomal protein genes, Nup170, Nup160, HNRNPU, and the ribosome pathway, as well as the spliceosome pathway, may play important roles in PDAC progression. In addition, ribosomal protein genes, Nup170, Nup160, and HNRNPU may be used as possible molecular markers for the early diagnosis of the disease. A limitation of this study is a lack of experimental verification, thus, further research is needed about genes that are used for early diagnosis of the disease and other possible molecular markers of PDAC.
Footnotes
Conflict of interest
None.
Source of support: Departmental sources
References
- 1.Li D, Xie K, Wolff R, Abbruzzese JL. Pancreatic cancer. Lancet. 2004;363(9414):1049–57. doi: 10.1016/S0140-6736(04)15841-8. [DOI] [PubMed] [Google Scholar]
- 2.Ying H, Dey P, Yao W, et al. Genetics and biology of pancreatic ductal adenocarcinoma. Genes Dev. 2016;30(4):355–85. doi: 10.1101/gad.275776.115. [DOI] [PMC free article] [PubMed] [Google Scholar]
- 3.Siegel R, Naishadham D, Jemal A. Cancer statistics, 2013. Cancer J Clin. 2013;63(1):11–30. doi: 10.3322/caac.21166. [DOI] [PubMed] [Google Scholar]
- 4.Bond-Smith G, Banga N, Hammond TM, Imber CJ. Pancreatic adenocarcinoma. BMJ. 2012;344:e2476. doi: 10.1136/bmj.e2476. [DOI] [PubMed] [Google Scholar]
- 5.Stewart B Wild C. World cancer report 2014. World Health Organization; Geneva: 2014. [Google Scholar]
- 6.Szafranska A, Davison T, John J, et al. MicroRNA expression alterations are linked to tumorigenesis and non-neoplastic processes in pancreatic ductal adenocarcinoma. Oncogene. 2007;26(30):4442–52. doi: 10.1038/sj.onc.1210228. [DOI] [PubMed] [Google Scholar]
- 7.Liu Q, Chen J, Wang J, et al. Putative tumor suppressor gene SEL1L was downregulated by aberrantly upregulated hsa-mir-155 in human pancreatic ductal adenocarcinoma. Mol Carcinog. 2014;53(9):711–21. doi: 10.1002/mc.22023. [DOI] [PMC free article] [PubMed] [Google Scholar]
- 8.Steele CW, Oien KA, McKay CJ, Jamieson NB. Clinical potential of microRNAs in pancreatic ductal adenocarcinoma. Pancreas. 2011;40(8):1165–71. doi: 10.1097/MPA.0b013e3182218ffb. [DOI] [PubMed] [Google Scholar]
- 9.Frampton AE, Krell J, Jacob J, et al. microRNAs as markers of survival and chemoresistance in pancreatic ductal adenocarcinoma. Exp Rev Anticancer Ther. 2011;11(12):1837–42. doi: 10.1586/era.11.184. [DOI] [PubMed] [Google Scholar]
- 10.Fukuda A, Wang SC, Morris JP, et al. Stat3 and MMP7 contribute to pancreatic ductal adenocarcinoma initiation and progression. Cancer Cell. 2011;19(4):441–55. doi: 10.1016/j.ccr.2011.03.002. [DOI] [PMC free article] [PubMed] [Google Scholar]
- 11.Oji Y, Nakamori S, Fujikawa M, et al. Overexpression of the Wilms’ tumor gene WT1 in pancreatic ductal adenocarcinoma. Cancer Sci. 2004;95(7):583–87. doi: 10.1111/j.1349-7006.2004.tb02490.x. [DOI] [PMC free article] [PubMed] [Google Scholar]
- 12.Morton JP, Timpson P, Karim SA, et al. Mutant p53 drives metastasis and overcomes growth arrest/senescence in pancreatic cancer. Proc Natl Acad Sci. 2010;107(1):246–51. doi: 10.1073/pnas.0908428107. [DOI] [PMC free article] [PubMed] [Google Scholar]
- 13.Xia J-T, Wang H, Liang L-J, et al. Overexpression of FOXM1 is associated with poor prognosis and clinicopathologic stage of pancreatic ductal adenocarcinoma. Pancreas. 2012;41(4):629–35. doi: 10.1097/MPA.0b013e31823bcef2. [DOI] [PubMed] [Google Scholar]
- 14.Denley SM, Jamieson NB, McCall P, et al. Activation of the IL-6R/Jak/stat pathway is associated with a poor outcome in resected pancreatic ductal adenocarcinoma. J Gastrointest Surg. 2013;17(5):887–98. doi: 10.1007/s11605-013-2168-7. [DOI] [PubMed] [Google Scholar]
- 15.Pai P, Rachagani S, Lakshmanan I, et al. The canonical Wnt pathway regulates the metastasis-promoting mucin MUC4 in pancreatic ductal adenocarcinoma. Mol Oncol. 2016;10(2):224–39. doi: 10.1016/j.molonc.2015.10.005. [DOI] [PMC free article] [PubMed] [Google Scholar]
- 16.Iacobuzio-Donahue CA, Ashfaq R, Maitra A, et al. Highly expressed genes in pancreatic ductal adenocarcinomas A comprehensive characterization and comparison of the transcription profiles obtained from three major technologies. Cancer Res. 2003;63(24):8614–22. [PubMed] [Google Scholar]
- 17.Smyth GK. LIMMA: Linear models for microarray data. In: Gentleman R, Carey VJ, Huber W, et al., editors. Bioinformatics and Computational Biology Solutions Using R and Bioconductor Statistics for Biology and Health. Springer; New York, NY: 2005. pp. 397–420. [Google Scholar]
- 18.Dunning M, Lynch A, Eldridge M. R package version 2013; 2(0) IlluminaHumanv4. db: Illumina HumanHT12v4 annotation data (chip illuminaHumanv4) [Google Scholar]
- 19.Berkeley C. Linear models and empirical Bayes methods for assessing differential expression in microarray experiments. 2004. E-book available at http://www.bepress.com/sagmb/vol3/iss1/art3. [DOI] [PubMed]
- 20.Ferreira JA. The Benjamini-Hochberg method in the case of discrete test statistics. Int J Biostat. 2007;3(1) doi: 10.2202/1557-4679.1065. Article 11. [DOI] [PubMed] [Google Scholar]
- 21.Wu G, Dawson E, Duong A, et al. ReactomeFIViz: A Cytoscape app for pathway and network-based data analysis. Version 2. F1000Res. 2014;3:146. doi: 10.12688/f1000research.4431.1. [revised 2014 Sep 12] [DOI] [PMC free article] [PubMed] [Google Scholar]
- 22.Shannon P, Markiel A, Ozier O, et al. Cytoscape: A software environment for integrated models of biomolecular interaction networks. Genome Res. 2003;13(11):2498–504. doi: 10.1101/gr.1239303. [DOI] [PMC free article] [PubMed] [Google Scholar]
- 23.Szklarczyk D, Franceschini A, Wyder S, et al. STRING v10: Protein–protein interaction networks, integrated over the tree of life. Nucleic Acids Res. 2015;43(Database issue):D447–52. doi: 10.1093/nar/gku1003. [DOI] [PMC free article] [PubMed] [Google Scholar]
- 24.Kanehisa M, Goto S. KEGG: Kyoto encyclopedia of genes and genomes. Nucleic Acids Res. 2000;28(1):27–30. doi: 10.1093/nar/28.1.27. [DOI] [PMC free article] [PubMed] [Google Scholar]
- 25.Nepusz T, Yu H, Paccanaro A. Detecting overlapping protein complexes in protein-protein interaction networks. Nat Methods. 2012;9(5):471–72. doi: 10.1038/nmeth.1938. [DOI] [PMC free article] [PubMed] [Google Scholar]
- 26.Khalaileh A, Dreazen A, Khatib A, et al. Phosphorylation of ribosomal protein S6 attenuates DNA damage and tumor suppression during development of pancreatic cancer. Cancer Res. 2013;73(6):1811–20. doi: 10.1158/0008-5472.CAN-12-2014. [DOI] [PubMed] [Google Scholar]
- 27.Bellizzi AM, Bloomston M, Zhou X-P, et al. The mTOR pathway is frequently activated in pancreatic ductal adenocarcinoma and chronic pancreatitis. Appl Immunohistochem Mol Morphol. 2010;18(5):442–47. doi: 10.1097/PAI.0b013e3181de115b. [DOI] [PubMed] [Google Scholar]
- 28.Navas C, Hernández-Porras I, Schuhmacher AJ, et al. EGF receptor signaling is essential for k-ras oncogene-driven pancreatic ductal adenocarcinoma. Cancer Cell. 2012;22(3):318–30. doi: 10.1016/j.ccr.2012.08.001. [DOI] [PMC free article] [PubMed] [Google Scholar]
- 29.Cui D, Li L, Lou H, et al. The ribosomal protein S26 regulates p53 activity in response to DNA damage. Oncogene. 2014;33(17):2225–35. doi: 10.1038/onc.2013.170. [DOI] [PubMed] [Google Scholar]
- 30.Toshimitsu H, Iizuka N, Yamamoto K, et al. Molecular features linked to the growth-inhibitory effects of gemcitabine on human pancreatic cancer cells. Oncol Rep. 2006;16(6):1285–91. [PubMed] [Google Scholar]
- 31.Chen R, Dawson DW, Pan S, et al. Proteins associated with pancreatic cancer survival in patients with resectable pancreatic ductal adenocarcinoma. Lab Invest. 2015;95(1):43–55. doi: 10.1038/labinvest.2014.128. [DOI] [PMC free article] [PubMed] [Google Scholar]
- 32.Yan T-T, Fu X-L, Li J, et al. Downregulation of RPL15 may predict poor survival and associate with tumor progression in pancreatic ductal adenocarcinoma. Oncotarget. 2015;6(35):37028–42. doi: 10.18632/oncotarget.5939. [DOI] [PMC free article] [PubMed] [Google Scholar]
- 33.Tan X, Zhou L, Wang W, et al. Genomic analysis of invasion-metastasis-related factors in pancreatic cancer cells. Exp Ther Med. 2010;1(1):211–16. doi: 10.3892/etm_00000034. [DOI] [PMC free article] [PubMed] [Google Scholar]
- 34.Mishra RK, Chakraborty P, Arnaoutov A, et al. The Nup107–160 complex and γ-TuRC regulate microtubule polymerization at kinetochores. Nat Cell Biol. 2010;12(2):164–69. doi: 10.1038/ncb2016. [DOI] [PMC free article] [PubMed] [Google Scholar]
- 35.Zuccolo M, Alves A, Galy V, et al. The human Nup107–160 nuclear pore subcomplex contributes to proper kinetochore functions. EMBO J. 2007;26(7):1853–64. doi: 10.1038/sj.emboj.7601642. [DOI] [PMC free article] [PubMed] [Google Scholar]
- 36.Flemming D, Sarges P, Stelter P, et al. Two structurally distinct domains of the nucleoporin Nup170 cooperate to tether a subset of nucleoporins to nuclear pores. J Cell Biol. 2009;185(3):387–95. doi: 10.1083/jcb.200810016. [DOI] [PMC free article] [PubMed] [Google Scholar]
- 37.Yuen KW, Montpetit B, Hieter P. The kinetochore and cancer: What’s the connection? Curr Opin Cell Biol. 2005;17(6):576–82. doi: 10.1016/j.ceb.2005.09.012. [DOI] [PubMed] [Google Scholar]
- 38.Matchett KB, McFarlane S, Hamilton SE, et al. Ran GTPase in nuclear envelope formation and cancer metastasis. Adv Exp Med Biol. 2014;773:323–51. doi: 10.1007/978-1-4899-8032-8_15. [DOI] [PubMed] [Google Scholar]
- 39.Spraggon L, Dudnakova T, Slight J, et al. hnRNP-U directly interacts with WT1 and modulates WT1 transcriptional activation. Oncogene. 2007;26(10):1484–91. doi: 10.1038/sj.onc.1209922. [DOI] [PubMed] [Google Scholar]
- 40.Hegde ML, Banerjee S, Hegde PM, et al. Enhancement of NEIL1 protein-initiated oxidized DNA base excision repair by heterogeneous nuclear ribonucleoprotein U (hnRNP-U) via direct interaction. J Biol Chem. 2012;287(41):34202–11. doi: 10.1074/jbc.M112.384032. [DOI] [PMC free article] [PubMed] [Google Scholar]
- 41.Wagenhuser M, Rockert F, Niedergethmann M, et al. Distribution of characteristic mutations in native ductal adenocarcinoma of the pancreas and pancreatic cancer cell lines. Cell Biol: Res Ther. 2013;2:1. [Google Scholar]
- 42.Schleger C, Verbeke C, Hildenbrand R, et al. c-MYC activation in primary and metastatic ductal adenocarcinoma of the pancreas: Incidence, mechanisms, and clinical significance. Mod Pathol. 2002;15(4):462–69. doi: 10.1038/modpathol.3880547. [DOI] [PubMed] [Google Scholar]
- 43.Hsu TY-T, Simon LM, Neill NJ, et al. The spliceosome is a therapeutic vulnerability in MYC-driven cancer. Nature. 2015;525(7569):384–88. doi: 10.1038/nature14985. [DOI] [PMC free article] [PubMed] [Google Scholar]


