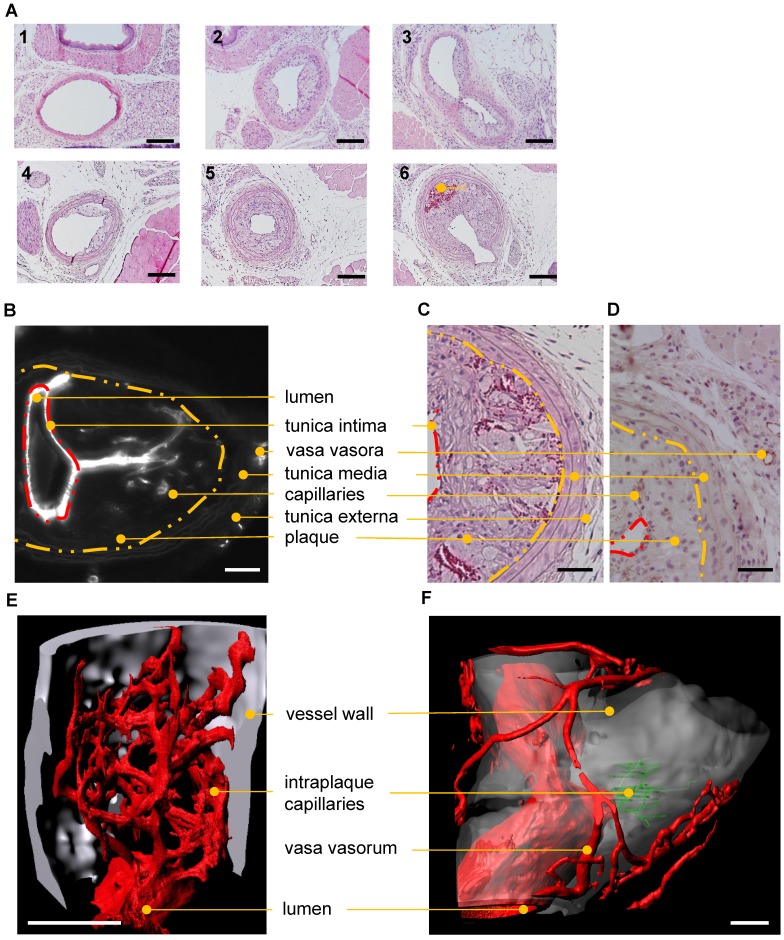
Figure 7.
Histological and UM-based visualization of atherosclerotic plaque capillarization. (A) H/E staining of the left common carotid artery (LCCA) of ApoE-/- mice at postoperative day 14 (1-3) and 28 (4-6) after partial ligation of the LCCA and HFD. Side-dependent vascular lumen profile of the LCCA near the aortic arch (1, 4) the bifurcation (3, 6) and in between (2, 5). Capillaries filled with red blood cells (dark red) in the atherosclerotic plaque are marked (6). Scale bars represent 100 µm. n=10. (B-F) Visualization of capillarized plaques 28 days after partial ligation. (B-D) Lumen, tunica intima (red dashed line), inner layer of tunica media (yellow dashed line), tunica externa, vasa vasora, plaque and intraplaque capillaries are marked with dots. (B) 2D virtual cross section (UM) of the carotid artery near the bifurcation. Isolectin GS-IB4 A647 is shown in white. Scale bar represents 100 µm. (C) H/E-stained cross section near the bifurcation. (D) CD31 (brown)-stained cross sections near the bifurcation. Scale bar represents 70 µm. (E) Surface rendering of UM angiography. The bifurcation is shown. Endothelial cells are stained with Isolectin GS-IB4 A647 (red), the autofluorescence is colored in white, and intraplaque capillaries (Isolectin GS-IB4 A647 positive) are in green. Scale bar represents 100 μm. (F) Surface rendering of an UM angiography of a carotid artery of a second ApoE-/- mouse. Plaque capillarization is shown near the bifurcation. Endothelial cells are stained with Isolectin GS-IB4 A647 (red) and the autofluorescence is colored in white.

