Figure 8.
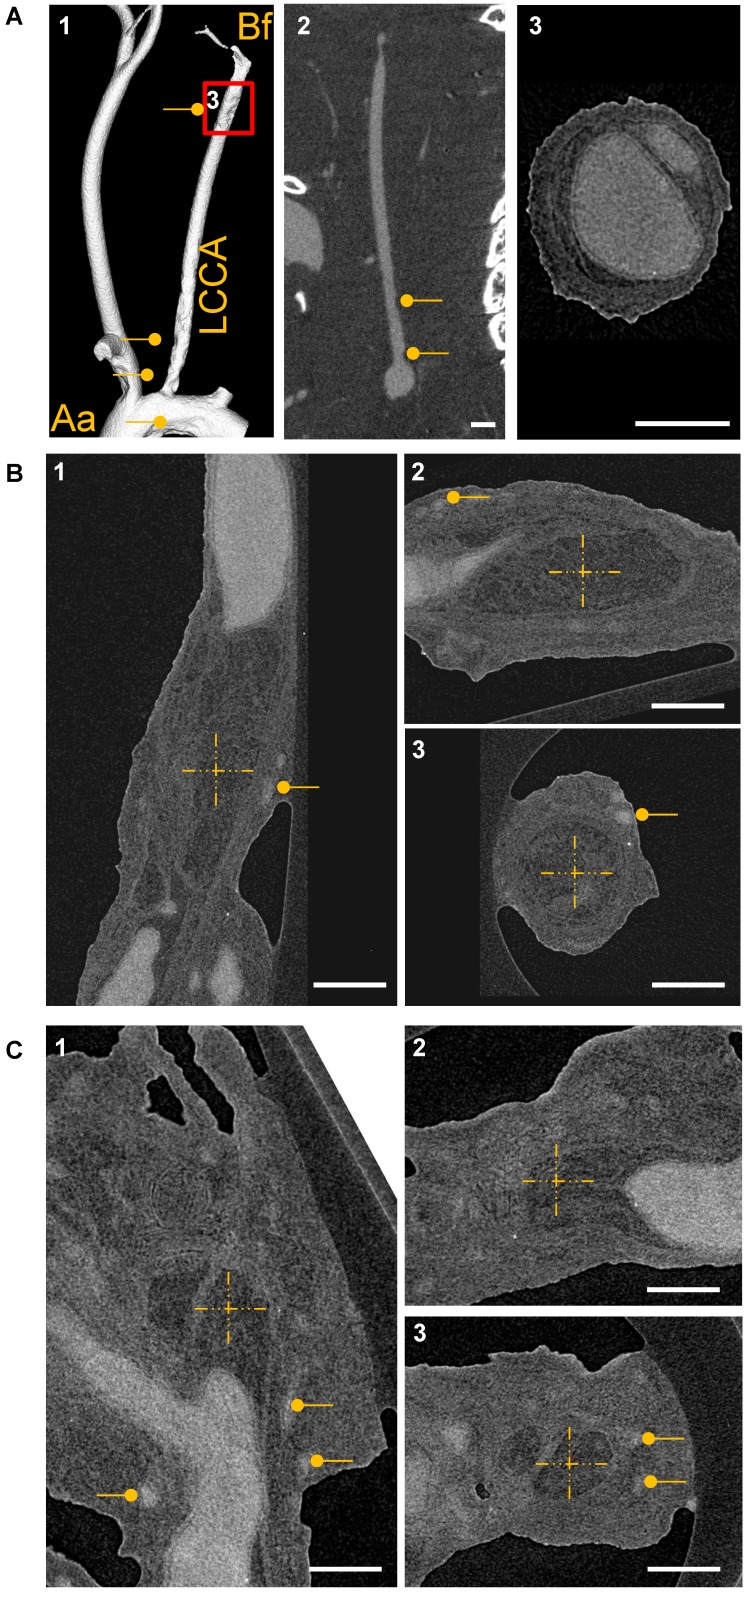
CT-based visualization of atherosclerotic plaque capillarization. (A1) Volume rendering of micro‐CT angiography of an ApoE-/- mouse 28 days after partial ligation of the left common carotid artery (LCCA) and MicroFil infusion. The vessel was visualized from aorta (Aa) to bifurcation (Bf). (A2) 2D cross section of the left carotid artery is shown. Atherosclerotic plaques are marked with a dot. Scale bar represents 1 mm. (A3) Magnification of the LCCA shown in A1. Scale bar represents 300 µm. (B) High resolution nano-CT cross section of a big plaque between the aortic arch and the bifurcation and at the bifurcation (C) Vasa vasora are marked with dots. The MicroFil micro-CT contrast agent appears in grey and plaque tissue in dark grey. (B-C) The centers of the dashed crosses represent the same voxel of the dataset shown in subfigures 1-3. Three CT image planes are shown (sagittal, transverse and coronal). Scale bar represents 300 µm. Aa: aortic arch; Bf: bifurcation; LCCA: left common carotid artery.

