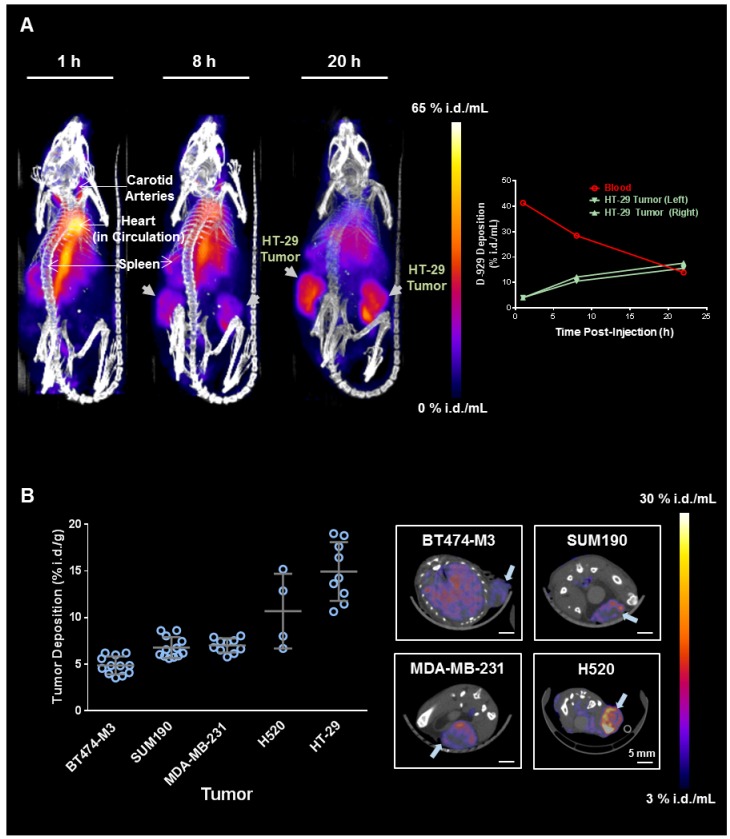
Figure 3.
PET/CT imaging and quantification of MM-DX-929 deposition in xenograft models. (A) Representative maximum intensity projection of NOD-SCID mice bearing bilateral subcutaneous HT-29 tumors at 1, 8, and 20 h after MM-DX-929 injection via lateral tail vein. Quantification of MM-DX-929 tumor and blood signal as a function of time obtained from the images are provided on the right panel. (B) Quantification of MM-DX-929 tumor deposition at approximately 24 h.p.i. in multiple tumor xenograft models. Representative axial PET/CT images of BT474-M3 (orthotopic mammary fat pad), SUM190 (orthotopic mammary fat pad), MDA-MB-231 (orthotopic mammary fat pad), and H520 (subcutaneous) tumors are shown on the right panel. Images and data are decay-corrected.

