

Abstract
Magnetic resonance imaging (MRI) is one of the most widely used diagnostic tools in the clinic. To improve imaging quality, MRI contrast agents, which can modulate local T1 and T2 relaxation times, are often injected prior to or during MRI scans. However, clinically used contrast agents, including Gd3+-based chelates and iron oxide nanoparticles (IONPs), afford mediocre contrast abilities. To address this issue, there has been extensive research on developing alternative MRI contrast agents with superior r1 and r2 relaxivities. These efforts are facilitated by the fast progress in nanotechnology, which allows for preparation of magnetic nanoparticles (NPs) with varied size, shape, crystallinity, and composition. Studies suggest that surface coatings can also largely affect T1 and T2 relaxations and can be tailored in favor of a high r1 or r2. However, the surface impact of NPs has been less emphasized. Herein, we review recent progress on developing NP-based T1 and T2 contrast agents, with a focus on the surface impact.
Keywords: nanoparticle, magnetic resonance imaging, relaxivity, contrast agents, surface modification
Introduction
Magnetic resonance imaging (MRI) is one of the most widely used diagnostic tools in the clinic and affords advantages such as deep tissue visualization, non-invasiveness, no ionizing radiation, good soft tissue contrast, and sub-millimeter spatial resolution 1-3. While a group of isotopes have been investigated for MRI (e.g., 7Li, 13C, 19F, 83Kr, 129Xe, etc.), 1H-MRI remains the dominant MRI approach in clinical diagnosis, largely due to the high abundance of water in the human body 4-9. During an MRI scan, the magnetic moments of hydrogen nuclei are aligned with a strong static external magnetic field and a radio frequency pulse is applied to flip the rotation of magnetic moments. When the radio frequency perturbation is removed, the hydrogen nuclei undergo a relaxation process, during which the precession of the nuclear ensemble returns back to the original equilibrium 10. The recovery process is usually divided into two orthogonal components: the magnetization recovery parallel to the static external magnetic field (i.e., spin-lattice relaxation), and the magnetization decay on the plane perpendicular to the external field (i.e., spin-spin relaxation) 11. The rates of the relaxations are characterized by the longitudinal relaxation time T1 and the transverse relaxation time T2, both of which are largely dependent on the chemical environments of the individual nuclei 12,13.
However, the intrinsic signal difference between diseased and normal tissues can be difficult to discern on an MR image. To improve imaging quality, MRI contrast agents, which can alter locoregional magnetic fields and accelerate relaxation processes, have been developed. Currently, the most common clinical T1 contrast agents are gadolinium (Gd) chelates, and the most common T2 contrast agents are iron oxide nanoparticles (IONPs) 2,14,15. But, there have been concerns over their mediocre contrast abilities. To address this issue, extensive efforts have been made to develop alternative MRI agents with superior r1 or r2 16-20, stimulus-responsive relaxation times 9,21, or multiparametric imaging capabilities 22-28.
The contrast ability of a MRI probe depends on a number of factors. Since proton relaxation mainly occurs at the interface between the magnetic center and the surrounding aqueous environment, the nanoparticle (NP) surface coating plays a crucial role in the T1- and T2-relaxation processes. These include impacts on water diffusion, retention, and interaction with the magnetic centers. Moreover, the surface coating may affect the electronic and magnetic properties of the underlying magnetic NPs 29,30, and in turn cause contrast changes. Hence, in addition to improving NP synthesis, it is critical to understand these surface impacts and to employ them when designing MRI probes. However, rules of thumb that work for small molecule contrast agents may not apply for NPs. Meanwhile, there have been relatively few discussions on this topic. In this review, we attempt to summarize recent progress in developing nanoscale T1- and T2- contrast agents and discuss the relationship between microscopic physiochemical properties of the NPs and their macroscopic performances as MRI contrast agents, with an emphasis on the surface impact on r1 and r2 relaxivities.
Working mechanisms for MRI contrast agents
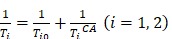
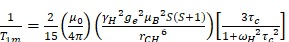
MRI contrast agents are paramagnetic or superparamagnetic compounds that can catalyze proton relaxation processes and, as a result, shorten T1/T2 relaxation times in the locoregional tissues. The accelerated relaxations are reflected as signal enhancement (or hyperintensity) on T1-weighted MR images and signal reduction (or hypointensity) on T2-weighted MR images 31. Most contrast agents reduce both T1 and T2, but we often label them as T1 or T2 contrast agents based on their primary impact on water relaxation. In general, the relaxation time (Ti) of protons (most importantly water protons) can be described using Equation 1, where Ti0 is the intrinsic relaxation time of the tissues and TiCA is the contrast agent contribution.
 |
(1) |
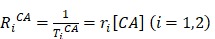
The contrast ability of an agent can be quantitatively characterized by its r1 (longitudinal) and r2 (transverse) relaxivities. These measure the degree to which a contrast agent can enhance the hydrogen nucleus relaxation rate constant Ri (Ri = 1/Ti, i = 1,2) normalized to the concentration of the agent, as shown in Equation 2. By definition, contrast agents of high relaxivities can provide an equivalent contrast effect at relatively low doses. By convention, a contrast agent with a transverse-to-longitudinal relaxivity ratio (r2/r1) smaller than 5 is regarded as a T1 agent; otherwise, it is mainly a T2 contrast agent 32. More recently, some propose to revise the classification, calling those with an r2/r1 ratio that is less than 2 as T1 agents, larger than 10 as T2 agents, and those in-between as potential dual-functional contrast agents.
 |
(2) |
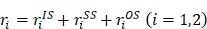
Based on the binding relationship between water protons and the magnetic metal center, the r1 and r2 contributions be divided into three portions using a three-sphere model: (1) The inner sphere relaxivity (riIS), arising from the contrast agent-proton interaction that occurs in the innermost sphere. This is the sphere where hydrogen nuclei from water (or other molecules) can directly bind to the magnetic metal center. (2) The second sphere relaxivity (riSS), originating from the second or intermediate sphere of the contrast agent. This is the sphere where the magnetic metal center interacts with the long-lived hydrogen nuclei (e.g., diffusing water molecules and exchangeable protons) that are bound but not directly bound to the metal center. (3) The outer sphere relaxivity (riOS). This comes from the surrounding bulk water, and is constant for a specific environment 33,34. Based on this model, the observed relaxivity (ri) can be expressed using Equation 3 33. For T1 contrast agents, the relaxation hinges largely on the dipole-dipole coupling between the paramagnetic ions and the hydrogen nuclei, and the primary contributor is usually riIS 33,35. For T2 contrast agents, on the other hand, the contrast mainly comes from the inhomogeneity of fluctuating magnetic gradients, making riSS the most important contributor 33. We have summarized factors that contribute to r1 and r2 enhancement in Figure 1A-B. The detailed discussions will be expanded in the following sections.
Figure 1.

Factors that affect r1 and r2 of contrast agents. (A) A brief summary of factors that affect the r1 of a T1 contrast agent. (B) A brief summary of factors that affect the r2 of magnetic NP-based T2 contrast agents.
 |
(3) |
Factors affecting r1 relaxivity of a contrast agent
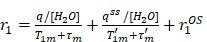
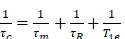
For T1 relaxation processes, r1 in Equation 3 can be further expended to Equations 4-6, where q is the inner sphere hydration number (i.e., the number of water molecules or other proton-bearing moieties directly bound to the paramagnetic center); qSS is the hydration number of the secondary intermediate sphere (i.e., the number of long-lived water molecules and/or exchangeable protons close to the paramagnetic center); T1m and T1m' are the T1 relaxation times of water protons in the inner and second spheres, respectively; τm and τm' are the residency times of water molecules in the inner and second spheres, respectively; μ0 is the Bohr magneton constant; γH is the gyromagnetic ratio of the proton; ge is the electronic g-factor; S is the spin quantum number of the corresponding paramagnetic species; rCH is the distance between the contrast center and the proton; τc is the correlation time, which describes the fluctuating magnetic dipole; τR is the rotational correlation time of the contrast agent; and T1e characterizes the electronic T1 relaxation process 2,34.
 |
(4) |
 |
(5) |
 |
(6) |
Species carrying a large number of unpaired electrons are preferred T1 contrast agents due to their large S numbers. In theory, T1 contrast is mainly caused by a fluctuating magnetic field due to the tumbling of a paramagnetic component under radio frequency perturbation. Compounds that are rich in unpaired electrons are more capable of inducing a strong fluctuating magnetic field. This is why commonly used T1 contrast agents are often composed of transition or lanthanide metal ions (e.g., Fe3+, Mn2+, Gd3+, etc.) having multiple unpaired electrons in their d- or f-orbitals.
r1IS and r1SS are positively correlated with the hydration numbers (q and qSS). This means that good accessibility of water towards the paramagnetic center is crucial for r1 enhancement 2,34. From this perspective, opening up more coordination sites for water interaction is considered beneficial for metal chelate-based T1 contrast agents 2,36,37. However, reducing the number of dentates will make the chelates more susceptible to transmetallation or ligand replacement. This is associated with higher risks of toxicity in vivo. One example is [Gd(DO3A)(H2O)2], which, unlike many other Gd agents, affords a hydration number of two. While offering reasonably good thermodynamic stability and kinetic inertness, this compound is found labile in vivo due to ligand displacement by endogenous anions like bicarbonate 2.
The contribution of r1SS in chelate-based T1 agent is usually negligible. This is because the life span of water molecules in this region is very short and their distance to the contrast center is long. A decrease in pH or temperature can lead to relaxivity enhancement, which is a result of a prolonged residency of water protons in the secondary sphere and an increased qSS 2. For metal chelates, inclusion of polar donor groups such as phosphonate can help improve hydration in the intermediate sphere and thus enhance r1SS. When conjugating them onto the surface of proteins, macromolecules, or NPs having a hydrophilic surface, an increase in r1SS is often seen due to the presence of more long-lived water protons in the secondary sphere 2. Similarly, for magnetic NPs, a hydrophilic surface is preferred for enhanced hydration 38. In addition, a large surface-to-volume ratio, which favors water accessibility, is also desired. Due to this reason, ultrasmall NPs and NPs with reduced surface and shape anisotropy have been prepared 38,39.
As illustrated in Equations 4-6, the contrast performance is also governed by time parameters that describe water dynamics in different spheres, rotational motions of the contrast agent, and specific relaxation type, (i.e., τm, τm', τR, and T1e). These variables are dependent on the external magnetic field strengths, molecular structure of contrast agents, and physical/chemical features at the interface between the contrast agents and the aqueous environment. Thus, they affect the relaxivity of a contrast agent in a sophisticated fashion. Taking T1e (which characterizes the electronic T1 relaxation process) for instance, at low field strengths (e.g., 0.01 T) this is the dominant factor for τc because it is much shorter than τR and τm (T1e is picoseconds for Gd3+ or Mn2+) 34,40. However, at 1.5 T or higher field strengths, electronic relaxation becomes very slow as T1e increases by the square of the applied field; the relaxivity is then more dependent on the rotational motion (1/τR) or the water exchange rate (1/τm and 1/τm') 2.
For rigid MRI probes that tumble isotropically (e.g., metal chelates), the tumbling motion can be simply characterized by the rotational correlation time, τR 41. For those with flexible structures, however, the tumbling motion (τR) is more complicated, and according to the Lipari-Szabo model-free approach, is affected by both the global rotation of the whole compound (1/τg) and the internal rotation of the metal centers (1/τf) 42. In theory, an optimal relaxation satisfies τc = 1/ωH (considering the spectral density component in Equation 5). In a typical MRI scan (field strength >1.5 T), τR is very short compared to τm and T1e, and is the dominant factor for τc (i.e., 1/τc ≈ 1/τR). Hence, τR ≈ 1/ωH is considered a required but insufficient condition. A slower motion is desired at relatively low fields (e.g., 1.5 T), while an intermediate correlation time is preferred at high fields (e.g., 7.0 T) 2. As a result, it is important to tune τR for optimal contrast ability. For NPs/macromolecules, there are two main strategies that have been employed to achieve the goal. The first is to change the molecular weight or size of the NP or macromolecule to best fit the magnetic field. The second is to adjust the rigidity of the structure, for instance, by replacing flexible chain structures with rigid rings or introducing secondary bonds, like hydrogen bonds, between the chelates and the macromolecule host. According to the simulation by Caravan, increasing the structural rigidity of Gd chelate-decorated complexes can enhance relaxivity at certain field strengths (Figure 2A) 43.
Figure 2.

(A) Simulation of r1 over a range of Larmor frequencies (ωH) for contrast complexes using a Lipari-Szabo model-free approach. The resulting r1 increases as the structural flexibility (described by factor F) decreases (i.e., F = 0 corresponds to flexible, free molecules, and F = 1 corresponds to a rigid structure with no flexibility). Adapted with permission from 37, copyright 2006 Royal Society of Chemistry. (B) A NP with a large magnetization favors a reduced magnetic anisotropy, which can be achieved by increasing particle size and reducing the surface/shape anisotropy. Adapted with permission from 44, copyright 2012 American Chemical Society. (C) Outer sphere relaxation theory with three distinctive regimes, which are: (i) MAR, (ii) SDR and (iii) SMR. Adapted with permission from 40, copyright 2015 Royal Society of Chemistry.
Water exchange rates (1/τm and 1/τm') also affect r1. τm ranges from 0.1 ns to tens of μs depending on the local coordination environment. For inner-sphere relaxation, τm is often much shorter than T1m, meaning that water molecules are often liberated before they are fully relaxed. For NP or macromolecule contrast agents, it is possible to modulate the chemical environment to extend τm for r1 enhancement. But this should not be overdone because too slow a water exchange may negatively affect the rate of discharging relaxed water molecules and the relaxation effect to the bulk water. This is supported by Caravan and his colleagues who measured the relaxivity rates and water residencies of a series of Gd complexes with varied donor groups 41. Their study suggests that τm has a great impact on relaxivity and should be optimized for each field strength, with the optimal τm being shorter at high fields than at low fields 41. τm can be increased by changing the donor group of the chelator, and the impact follows the order: phosphonate ~ phenolate > α-substituted acetate > acetate > hydroxamate ~ sulfonamide > amide ~ pyridyl ~ imidazole; and the effect is additive 2,34,41. Prolonging τm' is also beneficial for contrast enhancement, although the impact is often smaller as τm' is usually much shorter (e.g., several ps) 2,34,41.
Factors affecting r2 relaxivity of a contrast agent
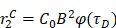
T2 relaxation occurs through three mechanisms, which are: (1) Curie spin relaxation, (2) dipole-dipole coupling between the metal ions and the water hydrogen nuclei, and (3) scalar or contact relaxation. The Curie spin relaxation (r2C) originates from the dipolar interaction between water protons and a large static magnetic moment arising from electrons, as described by Equation 7, where C0 is the Curie constant, B is the magnetic field, and φ(τD) is a function of the water diffusion correlation time (τD) 33,44. For small-sized contrast agents (e.g., 3 nm or smaller) at a high strength field (e.g., 7.0 T or higher), Curie spin relaxation is dominant due to short τD (τD = d2/D, d is the radius of contrast agent and D is the diffusion coefficient of water) and highly magnetized contrast agents 44. For contrast agents with a large size (e.g., 3-7 nm or larger), φ(τD) decreases rapidly and the Curie spin contribution becomes very small compared to the other two mechanisms 44,45. Considering that most T2 contrast agents are several to hundreds of nanometers in size, the T2 relaxation is mostly dominated by dipolar interactions and scalar relaxation processes. This is why the two mechanisms are used in most studies to explain the relaxation behaviors.
 |
(7) |
One primary factor affecting  is the inhomogeneity generated by the contrast agents. Its intensity depends largely on the magnetization of the contrast agent, as described in the Koenig-Keller model (r2 ∝ μ2, μ is the effective magnetic moment of the NPs) 46-49. In general, NPs made of high saturation magnetization (MS) materials can more efficiently induce field inhomogeneity and can influence a greater volume of water. However, the effective magnetization value of a NP (mS) is often times smaller than that of the bulk material. One major reason for this is an increased magnetic anisotropy (K) (Figure 2C) 50. Due to the presence of a magnetically “dead” or tilted layer (on the order of 1 nm) on the particle surface, the surface spins are largely canted, causing enhanced magnetic anisotropy and decreased magnetic moment 51-53. As typically seen in spherical particles, such surface magnetic anisotropy impact is greater with smaller particles due to their high surface-to-volume ratios. This size effect is observed with multiple NP-based contrast agents 51,54-57. In addition to size effect, magnetic anisotropy is also affected by the shape, fine architecture, and surface coating of nanostructures. For particles of the same volume, a reduced shape/surface anisotropy helps improve the spin state similarity between the surface and core and thereby enhance the magnetization 50. For instance, non-spherical NPs (e.g., cube, octapod, rod, etc.) have demonstrated higher mS than their spherical counterparts 47,50. On the other hand, when two or more magnetic phases are in contact with each other, the exchange coupling across the interface(s) will provide an extra source of anisotropy (referred to as exchange anisotropy) and lead to a minor reduction but enhanced stabilization on magnetization as well as a boost on coercivity, which is often seen in core-shell nanostructures 50,51. Moreover, magnetization loss also happens with NPs of deteriorating surface, which is not uncommon given the high reactivity of NP surfaces. Hence, it is important to use robust coatings to protect NPs from surface oxidation or etching 58,59.
Another important factor for r2 is the diffusion dynamics of water molecules in the magnetic field gradients. This contribution is measured by the number of water molecules diffused into the secondary sphere of the contrast agent and their residency time within the region. According to the SBM model, 1/T2 is inversely proportional to the sixth power of the distance between the NP and water proton spins (rMH). Hence, the contribution weighs heavily towards water molecules that diffuse into the adjacent space of the fluctuating magnetic field and reside there for a relatively long time 46. From this perspective, NPs with a large magnetization are beneficial because it means a larger area of influence (i.e., the secondary sphere) and a greater possibility of relaxing the diffusing water molecules 46,47. On the other hand, over-increasing NP size may end up decreasing r2 because it generates idle magnetic components in the core area and leads to an overall decline of the effective area of influence 46.
 |
(8) |
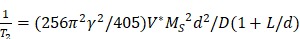
In addition to the intrinsic material- and size-relevant properties of magnetic NPs, the surface coating is also an important factor for T2. Proper surface coating endows NPs with good colloidal stability and protects them from undesired degradation or aggregation. Meanwhile, inappropriate coatings may exclude water from the NP surface, hinder water diffusion, or prolong the water residency, causing reduced contrast. According to a quantum-mechanical outer-sphere theory 60, as described by Equation 8—where γ, V*, d, D, and L are the proton gyromagnetic ratio, volume fraction, saturation magnetization, core radius of magnetic NP, diffusivity of water molecules, and thickness of the impermeable surface coating—a smaller L/d ratio and permeable surface coating are preferred for fast T2 relaxation. A hydrophilic NP surface is usually preferred because it favors diffusion and retention of water molecules within the second sphere 61, underscoring the importance of post-synthesis NP surface modifications 62-64. These include not only imparting a hydrolytic coating layer to the particle surface, but also fine-tuning the coating thickness, grafting density, surface charge, and coating porosity for optimized water accessibility and residency 61.
A common approach exploited to enhance r2 is to purposely induce clustering of magnetic NPs 65. In this case, r2 is determined by three distinctive regimes, namely the (i) motional averaging regime (MAR), (ii) static dephasing regime (SDR), and (iii) echo-limited region (ELR) or slow-motion regime (SMR) (Figure 2D). For individual NPs or small NP clusters, water residency in the secondary sphere is short due to a small hydrodynamic size. In this instance, MAR is dominant and the overall r2 is governed mainly by the diffusional motions of water molecules. As the hydrodynamic size increases, the area influenced by the magnetic inhomogeneity is increased and the effective water residency is prolonged, which benefits r2 enhancement. When increasing the clustering size beyond a certain critical value into SDR, there will be no further enhancement of the fluctuating magnetic field, and the overall r2 becomes independent of the hydrodynamic size. Further increasing the dimensions of the clusters will lead to ELR, where size increase will negatively affect r2 for particles occupying space in the secondary sphere 46.
Nanoparticle or macromolecule contrast agents with enhanced relaxivities
As stated above, the most common T1 contrast agents are Gd-based chelates (e.g., Gd(DTPA)) 36,66 and those for T2 are iron oxides 63,67-71. Despite their long history in the clinic, there have been concerns over the moderate contrast abilities and toxicity of these conventional MRI agents 12,43,72-74. Over the years, many efforts have been devoted to developing new contrast agents of superior contrast, often in the form of a macromolecule or a NP. A summary of representative contrast agents and their relaxivity properties is provided in Table 1.
Table 1.
Summary of relaxivities of different types of contrast agents
| Contrast Agent | r1 (mM-1s-1) | r2 (mM-1s-1) | Field/Temp.a | Reference |
|---|---|---|---|---|
| Gd chelate type T1 contrast agents | ||||
| Magnevist (Gd-DTPA) | 3.0-5.5 | - | 1.5 & 3 T | 12,120,121 |
| Dotarem (Gd-DOTA) | 4.1 | - | 7.0 T (25 °C) | 130 |
| Vasovist (MS-325) | 8.3 | - | 1.4 T (25 °C) | 33 |
| 7.2 | - | 4.7 T (25 °C) | ||
| 5.1 | - | 9.4 T (25 °C) | ||
| Gd(AAZTA)b | 7.1 | - | 0.47 T (25 °C) | 240 |
| Gd-linear polymeric complexes (e.g., Gd(DTPA)-cysteine/cystamine copolymers) |
5.0-9.0 | - | 3.0 T | 75,76 |
| Macromolecular Gd-complex (linear) | 15.6 | - | 0.47 T | 77 |
| Macromolecular Gd-complex (hyperbranched) | 15.4 | - | 0.47 T | |
| Macromolecular Gd-complex (star-like) | 13.5 | - | 0.47 T | |
| Gd(AAZTA) conjugated micelle | 30.0 | - | 0.47 T (25 °C) | 241 |
| Gd(DTPA) liposome | 13.6 | - | 3.0 T | 12 |
| Gd(DTPA) liposome (mPEG750) | 21.8 | - | ||
| Gd(DTPA) liposome (mPEG2000) | 134.8 | - | ||
| Gd(DTPA) liposome (mPEG5900) | 61.2 | - | ||
| Gd(DOTA) liposome | 4.10 | - | 4.7 T | 84 |
| Gd(DTPA) liposome | ~8.0 | - | 1.5 T (37 °C) | 85 |
| Gd(N-Decanoyl-N-methylglucamine) liposome | 11.9-12.3 | 13.0-13.6 | 0.47 T (25 °C) | 86 |
| Gd[DOTA(GAC12)2]-liposome | 34.8 | - | 0.47 T (25 °C) | 87 |
| PLA-PG[Gd(DTPA)] micelle | 7.9 | - | 4.7 T | 242 |
| PLGA-[Gd(DOTA)] nanosphere | 17.5 | - | 1.41 T | 88 |
| Gd-PAMAM dendrimer (G0-G9) | 10.1-36.0 | - | 0.47 to 2.0 T (16 -37 °C) | 78-81 |
| G4-[Gd(DOTA-pBn)(H2O)]-33 | 31.2 | - | 0.47 T (25 °C) | 82 |
| G4-[Gd(DO3A-MA)(H2O)]31 | 13.2 | - | 0.47 T (25 °C) | |
| G4-PEG-[Gd(DOTA-pBn)(H2O)]-38 | 30.2 | - | 0.59 T (25 °C) | |
| HB-PEI-[Gd(DOTA-pBn)(H2O)]-32 | 34.2 | - | 0.47 T (25 °C) | |
| HB-PG-[Gd(DOTA-pBn)(H2O)]-68 | 34.2 | - | 0.47 T (25 °C) | |
| Gd-EA dendrimer | 38.14 | - | 1.4 T (37 °C) | 83 |
| Gd-PLL dendrimer | 21.0 | - | 1.4 T (37 °C) | |
| Discotic-Gd(DTPA) assembled NP | 12-14 | - | 1.4 T (37 °C) | 243 |
| Gd(DTTA) coupled gold NPs | 10-60 (max. at 0.7 T) | - | <3.0 T (25/37 °C) | 89,90 |
| Gd(DTPA) coupled MSNs | 19.0 | - | 3.0 T | 94 |
| Gd(DTPA) coupled MSNs (PEGylated, 5K) | 25.7 | - | ||
Gd(DTPA) coupled carbon dot@PEI ( = 4-6 nm) = 4-6 nm) |
56.72 | - | 3.0 T | 244 |
| Gd(DTPA) trapped CaP NPs | 18.4-22.2 | - | 0.59 T (37 °C) | 97,98 |
| GdP3W | 16.2 | - | 0.47 T | 127 |
| GdP3W (bound to DNA) | 29.6 | - | 0.47 T | |
| GdP3W | 21.2 | - | 1.41 T | |
| GdP3W (bound to DNA) | 42.4 | - | 1.41 T | |
| Gd2O3 NPs (d = 1.0-1.1 nm) | 9.4 | - | 1.4 T | 130-133,245 |
| Gd2O3 NPs (d = 1.0-1.1 nm) | 9.9 | - | 3.0 T | |
| Gd2O3 NPs (d = 2.2 nm) | 8.8 | - | 7.0 T (25 °C) | |
| Gd2O3 NPs (d = 3.8 nm) | 8.8 | - | ||
| Gd2O3 NPs (d = 4.6 nm) | 4.4 | - | ||
| Gd2O3 NPs (d = 13.5 nm) | 12.3 | - | 1.5 T | |
| Gd2O3@DEG (hydrodynamic size = 3-105 nm) | 1.6-3.7 | - | 0.47, 1.4, 11.7 T (37 °C) | |
| Gd2O3(d = 2.9nm)@CTAB | 0.5 | - | 7.0 T | |
| Gd2O3(d = 2.9nm)@PVP | 12.1 | - | ||
| GdF3 (d < 5 nm) | 3.0-6.0 | - | 0.47 T (25 °C) | 136 |
| GdPO4@dextran | 13.9 | - | 0.47 T | 137 |
| NaGdF4 NPs (d = 2.5 nm) | 7.2 | - | 1.5 T | 129,138 |
| NaGdF4 NPs (d = 5.0 nm) | 6.2 | - | 3.0 T | |
| NaGdF4 NPs (d = 15.0 nm) | 5.7 | - | ||
| NaGdF4 NPs (d = 20.0 nm) | 8.8 | - | ||
| Folic acid-PEI-NaGdF4:Eu NPs (d = 56 nm) | 3.26 | - | 1.5 T | 140 |
| Protein-based T1 contrast agents | ||||
| MS-325 bound HSA (Ablavar) | ~30 - ~70 | - | 1.5 T | 2,123-125 |
| EP-2104R bound fibrin | 11.1-24.9 | - | 0.47 T | 246 |
| 10.1-17.9 | 12.8-32.1 | 1.41 T | ||
| EP-3533 bound collagen | 18.7, 16.1, 5.4 (Gd) | - | 0.47, 1.41, 4.7 T | 126 |
| Gd(AAZTA) loaded LDLs | ~22 (Gd) | - | 0.47 T | 108 |
| Gd(DTPA) loaded HDLs | 10.4 (Gd) | - | 1.5 T | 109 |
| Gd(DTPA) loaded clathrin triskelion | 16 (Gd) | - | 0.47 T | 110 |
| Gd(DTPA) loaded clathrin cage | 81 (Gd) | - | 0.47 T | |
| Gd(DOTA) conjugated CCMV | 46 (Gd) | - | 1.5 T | 112 |
| Gd3+-CCMV | 202-210 | 376-402 | 1.5 T | 112 |
| Gd(DOTA) conjugated TMV (exterior surface) | 18.4 | - | 1.4 T | 113 |
| 15.7 | - | 1.5 T | ||
| 6.7 | - | 7.0 T | ||
| Gd(DOTA) conjugated TMV (interior surface) | 10.7-15.2 | - | 1.4 T | |
| 11.0-13.2 | - | 1.5 T | ||
| 3.7-4.7 | - | 7.0 T | ||
| Gd(DTPA)-bacteriophage M2 (interior surface) | 41.6 | - | 0.7 T (25 °C) | 114,115 |
| 38.9 | - | 0.7 T (37 °C) | ||
| 31.0 | - | 1.4 T (25 °C) | ||
| Gd(DTPA)-bacteriophage M2 (exterior surface) | 30.7 | - | 0.7 T (25 °C) | |
| 27.8 | - | 0.7 T (37 °C) | ||
| 23.2 | - | 1.4 T (25 °C) | ||
| ProCA1 | 117 | 129 | 1.5 T | 120,121 |
| ProCA1 | 23.8 | 43.7 | 0.47 T | 119 |
| ProCA1 (PEG0.6K) | 39.5 | 92.5 | 0.47 T | |
| ProCA1 (PEG2.4K) | 47.6 | 98.7 | 0.47 T | |
| ProCA1 (PEG12K) | 83.8 | 100.8 | 0.47 T | |
| ProCA32 | 33.1 | 44.6 | 1.4 T | 122 |
| 21.9 | 56.9 | 4.7 T | ||
| 18.9 | 48.6 | 7.0 T | ||
| Gd(HP-DO3A) loaded ferritin | 70-80 | - | 0.47 T | 117,118 |
| Gd3+-doped nanostructures as T1 contrast agents | ||||
| Gd-doped IONPs (d = 5.0 nm) | 7.85 (Fe + Gd) | - | 7.0 T | 230 |
Gd(BDC)1.5(H2O)2 NMOF (100  400 nm)b 400 nm)b
|
35.8 | 55.6 | 3.0 T | 103 |
Gd(BDC)1.5(H2O)2 NMOF (400  700 nm) 700 nm) |
26.9 | 49.1 | 3.0 T | |
Gd(BDC)1.5(H2O)2 NMOF (1000  100 nm) 100 nm) |
20.1 | 45.7 | 3.0 T | |
Gd(BTC)(H2O)3 NMOF (100  25 nm) b 25 nm) b
|
13.0 | 29.4 | 3.0 T | |
| Cu2+ loaded polydopamine NP (d = 51 nm) | 5.39 | - | 1.5 T, pH 7.4 | 154 |
| Gadographene | 20.0-85.0 | - | 1.4 T | 165 |
| Gadographene oxide | 63.8 | - | 3.0 T | 166 |
| Gd@C82(OH)x, Gd@C60(OH)x | 4.5-97.7 | 0.47 to 9.4 T | 173 | |
| Gd3N@C80[XX] | 68-76 | - | 0.35 & 0.47 T | 173 |
| Gd3N@C80[DiPEG(OH)x] | 77-79 | 133-153 | 2.4 T | 174 |
| GO-Gd@C82 | 368.7 | - | 1.5 T | 175 |
| 439.7 | - | 4.7 T | ||
| C60@Gd(DOTA)s | 49.7 | - | 0.5 T | 190 |
| 29.2 | - | 1.5 T | ||
| Gadonanotube | ~150 | - | 1.5 T | 176 |
| ~635 | - | 0.01 MHz | ||
| Gadonanotube | 180 | - | 1.5 T (37 °C, pH 6.5) | 182 |
| Gadodot | 4.7-11.4 | - | 1.5 & 7.0 T | 183-186 |
| Gd-Cu-In-S/ZnS quantum dots | 9.45 | - | 1.41 T | 101 |
| Mn-based T1 contrast agents | ||||
| MnCl2 | 6.0-8.0 | - | 0.47 & 0.94 T (37 °C) |
247 |
| Mangafodipir (i.e., Mn(DPDP)]) |
~1.5 | - | 0.47 T | 37,247 |
| Mn2+-porphyrin | 6.7 | - | 0.50 T (37 °C) | 248 |
| Mn2+-porphyrin coupled gold NP@PEG | 22.2 | - | 0.50 T (37 °C) | |
| Mn2+-EDTA-BOM-HSA | 55.3 | - | 0.47 T (25 °C) | 249 |
| MnO NP (d = 7-25 nm) | 0.37-0.12 | - | 3.0 T | 143 |
| MnO (d = 2-5 nm) | 6.03-7.02 | - | 3.0 T | 147,148 |
| MnO(d = 25 nm) | 0.37 | - | N/A | 144 |
| MnO(d = 25 nm) + HSA | 1.97 | - | N/A | |
| Hollow MnO(ca. 15 nm)@mesoSiO2 | 0.99 | - | 11.7 T | 145 |
| Mn3O4 nanocrystal (d = 10 nm) | 1.08-2.06 | - | 3.0 T | 149 |
| Mn3O4 nanocrystal (d = 9 nm) | 8.26 | - | 3.0 T | 150 |
| PEG-PEI coated Mn3O4 NP | 0.59 | - | 0.5 T | 151 |
| cysteine-PEG-citrate coated Mn3O4 NP | 3.66 | - | 0.5 T | 152 |
| MnCO3@PDA NP | 6.3 | - | 7.0 T, pH 7.4 | 153 |
| 8.3 | - | 7.0 T, pH 6.0 | ||
| Mn-NMOF | 4.6-5.5 | - | 9.4 T | 105 |
| Mn-MNOF nanorod | 7.8, 4.6 | - | 3.0 & 9.4 T | |
Mn(BDC) (H2O)2 NMOF (50-100  750-3000 nm) 750-3000 nm) |
5.5 | 80.0 | 3.0 T | 103 |
| Mn3(iBTC)2(H2O)6 NMOF (d = 50-300 nm)b | 7.8 | 70.8 | 3.0 T | |
| Mn3(iBTC)2(H2O)6 NMOF (d = 50-300 nm) | 4.6 | 141.2 | 9.4 T | |
| Mn3(iBTC)2(H2O)6@silica (d = 50-300 nm) | 4.0 | 112.8 | 9.4 T | |
| Mn2+-Si quantum dot (d = 4.3nm) | 25.50 | - | 1.4 T (37 °C) | 102 |
| Mn2+ doped polydopamine NP | 6.55 | - | 9.4T | 250 |
| 38.6 | - | 1.5 T | ||
| Mn2+ doped CaP NP@PEG | 4.96 (pH 7.4) | - | 1.0 T | 99 |
| 19.96 (pH 6.8) | - | 1.0 T | ||
| Mn2+-graphene@dextran | 92.2 | - | 0.47 T | 188 |
| PEGylated MnOx nanoplate | 5.5 | - | 1.5 T | 161 |
| MnO2 nanoplate | 0.10 | 0.42 | 3.0 T (37 °C) | 162 |
| MnO2 nanoplate (reduced) | 4.89 | 50.57 | 3.0 T (37 °C) | |
| Fe3O4 nanoplate (thickness = 4.8 nm) | 43.18 | 118.73 | 0.5 T | 163 |
| Gd2O3 nanoplate (100) facet out | 14.5 | - | 0.5 T | 164 |
| 11.9 | - | 1.5 T | ||
| 12.4 | - | 3.0 T | ||
| Gd2O3 nanoplate (111) facet out | 3.4 | - | 0.5 T | |
| 2.6 | - | 1.5 T | ||
| 2.7 | - | 3.0 T | ||
| Magnetic NPs as T2 contrast mediators | ||||
| Feridex | - | 120, 110 | 1.5 & 3.0 T | 196,197,251 |
| Resovist | - | 186-189 | 1.5 T | 196,251 |
| Combidex | - | 65 | 1.5 T | 196,251 |
| IONP (d = 3.3 nm) | 8.3 | 35.1 | 4.7 T | 160 |
| bcc-Fe/Fe3O4 (d = 15 nm) NPs are formed by introducing of halide ions (i.e. Cl-, Br-) |
- | 220 | 3.0 T | 197 |
| amorphous-Fe/Fe3O4 (d = 15 nm) | - | 67 | 3.0 T | 197 |
 -Fe/iron oxide (d = 15 nm) -Fe/iron oxide (d = 15 nm) |
- | 324 | 9.4 T | 208 |
| Fe3O4 (d = 15 nm) | - | 24 | 3.0 T | 197 |
| IONP (d = 10 nm) | - | 56 | 1.5 T | 252 |
| Fe/FeO (d = 10 nm) | - | 129 | 1.5 T | 252 |
| Octapod IONP (d = 49 nm) | - | 209.0 | 7.0 T | 47 |
| Octapod IONP (d = 58 nm) | - | 679.3 | 7.0 T | 47 |
| FePt (d = 9 nm) | - | 239 | 4.7 T | 253 |
| FeCo@GC (d = 7 nm) | - | 644 | 1.5 T | 209 |
| MnFe2O4 (d = 12 nm) | - | 218 | 1.5 T | 204 |
| FeFe2O4 (d = 12 nm) | - | 172 | 1.5 T | 204 |
| CoFe2O4 (d = 12 nm) | - | 152 | 1.5 T | 204 |
| NiFe2O4 (d = 12 nm) | - | 62 | 1.5 T | 204 |
| Zn0.4Mn0.6Fe2O4 (d ~15 nm) | - | 860 | 4.5 T | 205 |
| Magnetic NPs with different surface coatings | ||||
| IONP@dense SiO2 (1 nm thick) | - | 94 | 215 | |
| IONP@dense SiO2 (14 nm thick) | - | 32 | ||
| IONP(d = 11 nm)@mSiO2 (19 nm thick) | - | 84.3 | 0.47 T | 254 |
| IONP(d = 11 nm)@mSiO2 (32 nm thick) | - | 79.9 | 0.47 T | 254 |
| IONP(d = 11 nm)@mSiO2 (42 nm thick) | - | 50.1 | 0.47 T | 254 |
| IONP(d = 10 nm)@mSiO2 | - | ~160-170 | 7.0 T | 95 |
| IONP(d = 10 nm)@mSiO2, hydrothermally treated | - | ~130-160 | 7.0 T | 95 |
| IONP(d = 15 nm)@casein | - | 273 | 3.0 T | 219 |
| CoFe2O4 (d = 7 nm)@SiO2 (10 nm thick) | - | 113 | 1.4 T | 203 |
| Fe3O4 (d = 7 nm)@SiO2 (10 nm thick) | - | 82.2 | 1.4 T | 203 |
| IONP(d = 3.6 nm)@diphosphate-PEG | - | 24.6 | 3.0 T | 31 |
| IONP(d = 3.6 nm)@hydroxamate-PEG | - | 48.8 | 3.0 T | |
| IONP(d = 3.6 nm)@dopamine-PEG | - | 44.8 | 3.0 T | |
| Fe3O4@ATPS (d = 6.5 nm)b | - | 83.8 | 0.50 T | 255 |
| Fe3O4@PEI (d = 11.5 nm) | - | 137.1 | 0.50 T | 255 |
| Fe3O4@PEI-PEG (d = 11.5 nm) | - | 156.2 | 0.50 T | 255 |
| IONP@DEGb | - | 119 | 3.0 T (25°C) | 61 |
| IONP@PEG(600 Da) | - | 55 | 3.0 T (25°C) | |
| IONP(d = 6.6 nm)@PEG(750 Da) | - | ~360 | 0.47 T | 217 |
| IONP(d = 6.6 nm)@PEG(2000 Da) | - | ~175 | 0.47 T | |
| IONP(d = 13.8 nm)@PEG(7.4 nm thick) | - | 385 | 7.0 T | 60 |
| IONP(d = 3 nm)@PEG- phosphine oxides | 4.78 | - | 3.0 T | 159 |
| Feridex, IONP(d = 15 nm)@dextran | - | 314.5 | 7.0 T | 218 |
| IONP(d = 15 nm)@serum albumin | - | 123.6 | 7.0 T | |
| Fe5C2@phospholipid(d = 20 nm) | - | 464 | 7.0 T | 194 |
| Fe5C2@phospholipid(d = 5 nm) | - | 342 | 7.0 T | 211 |
| Fe5C2@ZDS(d = 5 nm) | - | 385 | 7.0 T | |
| Fe5C2@casein(d = 5 nm) | - | 836 | 7.0 T | |
| Fe5C2@casein(d = 22 nm) | - | 973 | 7.0 T | |
| Clusters/aggregates of IONPs | ||||
| Aggregated PEI-IONP (d = 9 nm) | - | 550-580 | 3.0 T | 220,221 |
| IONP (d = 30 nm) | - | 44.87 | 1.4 T | 222 |
| Linear chain of self-assembled IONPs (d = 30 nm) | - | 101.05 | 1.4 T | 222 |
| Micelle particle (d ~ 63 nm) incorporated with IONPs (d = 10 nm) | - | 910 | 7.0 T | 223 |
| Ferridex, IONP (d = 9.1 nm)@dextran | - | 159 | 3.0 T | 224 |
IONPs(d = 9.1 nm) in hydrogel (size  53-94 nm) 53-94 nm) |
- | 505 | 3.0 T | |
Cluster of IONPs(d = 10-20 nm) coated with polydopamine (overall size  ~120 nm) ~120 nm) |
- | 433.03 | 9.4 T | 225 |
| IONP(d = 8-10 nm)-graphene conjugates | - | 108.1 | 3.0 T | 226 |
IONPs(d ~13.3 nm) loaded liposome (size  ~212 nm) ~212 nm) |
- | 259.5 | 7.0 T | 227 |
| T1-T2 dual-mode contrast agent | ||||
| Gd3+ doped IONP (d = 4.8 nm) | 7.85 (Gd) | 41.1 (Fe) | 7.0 T | 230 |
| Gd3+ doped IONP (d = 14 nm) | 69.5 (Gd) | 146.5 (Fe) | 7.0 T | 231 |
| Eu3+ doped IONP (d = 14 nm) | 36.8 (Eu+Fe) | 97.5 (Eu+Fe) | 0.5 T | 233 |
| MnFe2O4 (d = 12 nm) | 38.2 | 280.8 | 0.5 T | 232 |
| MnFe2O4 (d = 9 nm) | 32.1 | 205.5 | 0.5 T | |
| MnFe2O4 (d = 7 nm) | 27.2 | 146.5 | 0.5 T | |
| MnFe2O4 (d = 5 nm) | 18.0 | 45.9 | 0.5 T | |
| FeMnSiO4 hollow sphere (d = 80 nm, 5.5 nm thick) | 0.6 (Mn, pH 7.4) |
49.43 (Fe, pH 7.4) |
234 | |
| 1.92 (Mn, pH 5.0) |
92.39 (Fe, pH 5.0) |
|||
| MnO/MnO2 doped MSN | 18.0 (Mn) | 45.9 (Mn) | 3.0 T | 256 |
| Gd(DTPA) labelled IONP | 11.17(Gd) | 30.32 (Fe) | 3.0 T | 235 |
| MnFe2O4 (d = 15 nm)-SiO2 (16 nm in thickness)-Gd2O(CO3)2 (1.5 nm in thickness) | 33.1 | 274 (Fe + Gd) | 3.0 T | 237 |
Zn0.4 Fe2.6O4( = 15 nm)-SiO2(16 nm in thickness)-Mn(NMOF) (1.5 nm in thickness) = 15 nm)-SiO2(16 nm in thickness)-Mn(NMOF) (1.5 nm in thickness) |
8.2 | 238.4 (Fe + Mn) | 3.0 T | 11 |
| Fe3O4/Gd2O3 core/shell nanocube (10 nm long) | 45.24 | 186.51 | 1.5 T | 39 |
| A Gd(DOTA) coupled Au NP (d = 5 nm) fused with an IONP@PEG (d ~10 nm) | 43.6(Gd) 1.65(Gd+Fe) |
123 (Fe) | 7.0 T | 239 |
| Dumbbell hybrid nanostructure: Gd(DOTA) coupled Au NP (d = 9 nm) + Pt cube (  = 4.3 nm) + IONP@PEG (d ~ 10 nm) = 4.3 nm) + IONP@PEG (d ~ 10 nm) |
30.4(Gd) 3.88(Gd+Fe) |
128 (Fe) | 7.0 T | 239 |
| Dumbbell hybrid nanostructure: Gd(DOTA) coupled Au NP (d = 10 nm) + Pt cube (d = 5.1 nm) + IONP@PEG (d ~ 13 nm) |
32.1 (Gd) 4.13(Gd+Fe) |
136 (Fe) | 7.0 T | 239 |
a: Temperature and pH values are not shown in the table if not mentioned in the original publications.
T1 contrast agents
To enhance  , one widely explored approach is to dock multiple metal chelates onto a macromolecule or a NP. In addition to increasing the number of paramagnetic centers, the coupling also helps slow down the tumbling motion of the magnetic center to better fit the Larmor frequency (ωH). Further, the coupling strategy also offers more opportunities to modulate the neighboring chemical environment of the paramagnetic centers for optimized water residency (τm and τm') and to maximize the hydration numbers (q and qSS). Metal chelates can be introduced either onto the surface or into the interior of a macromolecule/NP host, and good water accessibility towards metal chelates is necessary for efficient relaxation. Additionally, researchers have also begun to use paramagnetic metal ions directly to build up various contrast agents via different strategies, such as forming nanocrystals, doping or trapping metal ions inside certain nanostructures, or having them chelated in the functional pockets of other macromolecular hosts. To ensure efficient interfacial interaction between the contrast agents and protons, it is often necessary to impart a hydrophilic coating to the NP surface, which benefits proton diffusion and coordination with the magnetic cores. Moreover, the coating may prevent surface deterioration and metal fall-off, which can negatively affect contrast or complicate signal interpretation.
Paramagnetic centers imparted onto the surface of macromolecules/NPs
One common variety in this category is Gd-polymeric conjugates. Researchers have used metal chelators as a reaction precursor and incorporated them into a polymer backbone during co-polymerization. For instance, Aaron et al. made Gd(DTPA) cysteine copolymers that were modified with polyethylene glycol (PEG) side chains 75,76. Having a flexible structure, the r1 of these polymer conjugates is often limited by the fast local motions of the metal chelates, and is in the range of 5 to 9 mM-1s-1 at 3.0 T 75,76. In these cases, tuning the length and grafting density of PEG chains may affect water access and exchange. Li et al. prepared Gd(DO3A)-grafted polymers with linear, hyperbranched, and star-like architectures, and their r1 values were 15.6, 15.4, and 13.5 mM-1s-1, respectively, at 0.47 T 77. These were higher than the free Gd(DO3A) (r1 of 5.2 mM-1s-1), which is attributed to a slowed-down rotational motion of the magnetic centers. Among the Gd polymers, the star-like one afforded the smallest r1, which is likely due to the poorer water accessibility to the Gd center.
Gd-labeled dendrimers have also been reported. Unlike other polymers, the size, molecular weight, branch number, and metal chelate number can be precisely tuned in a dendrimer 78. The most common dendrimers contain an ammonia or aliphatic diamine core, from which polyamidoamine (PAMAM) units are grown 78-81. Meanwhile, other types of dendrimers, such as polyglycerol (PG)-, poly(ethylenimine) (PEI)- 82, esteramide (EA)- and branched poly-L-lysine (PLL)-based dendrimers 83, have also been invented. Chelators and other functional molecules (e.g., PEG or a tumor-targeting ligand) can be conjugated to the terminus of each branch 79. The r1 of Gd-dendrimers ranges from ~10 to ~36 mM-1s-1 (0.47-2 T), and researchers may increase the generation number, design a densely packed dendrimer structure to hinder the Gd-chelate internal motion, and graft more Gd-chelates onto each dendrimer to increase the r1 on a per dendrimer basis. In addition to the molecular weight impact 79-81,83, the r1 is also affected by the surface properties of a dendrimer. One factor is the surface density of chelates. When the density of surface chelates is above a critical point, an enhanced Gd3+-Gd3+ dipolar interaction may be involved, causing enhanced electron-spin relaxation, reduced efficiency of proton relaxation, decreased effective hydration numbers, and, as a result, lowered r1 values 78-81. The other aspect is the surface polarity 79,80,82, which is mainly dependent on the surface charge and hydrophilic functional groups. Formation of hydrogen bonding and dipolar or electrostatic interaction between the branches contributes to an enhanced structural rigidity, which also helps improve r1.
Metal chelates can also be decorated onto the surface of liposome- or micelle-based NPs, and the resulting NPs afford r1 as high as 134.8 mM-1 s-1 at 3.0 T due to prolonged rotational correlation times 84-86. For instance, the Botta group developed a Gd(DOTA)-grafted lipid NP by modifying Gd(DOTA) with two carbon-chain anchors (i.e., GAC12) and inserting them into the lipid bilayer (Figure 3A) 87. The tight anchoring led to a slow rotational motion of Gd(DOTA) and, as a result, a high r1 of 34.8 mM-1s-1 (0.47 T, 25 °C). The other crucial factor for high r1 is the surface hydrophilicity, which offers good water access to contrast agents and optimizes the water residency. Ratzinger et al. reported that poly(D,L-lactide-co-glycolide) (PLGA) NPs can be decorated with Gd(DOTA) using PEI as a spacer. The r1 of the resulting particles ranged from 16.0 to 17.5 mM-1s-1 at 1.41 T 88.
Figure 3.

(A) Complex Gd(DOTA)(GAC12)x (x = 1, 2) embedded in a lipid bilayer. Adapted with permission from 80, copyright 2010 American Chemical Society. (B) A partially optimized structure of gold nanodot (201 gold atoms) coated with thiol derivative Gd(DTTA)s (51 chelates) on the surface interacting with 112 water molecules. Adapted with permission from 82, copyright 2009 American Chemical Society. (C) The triskelion and cage forms of Gd-clathrin contrast agents. Adapted with permission from 100 copyright 2012 Public Library of Science.
For inorganic NPs, metal chelates are often loaded onto the NP surface through a rigid chemical bond. For instance, Moriggi et al. tethered thiolated Gd(DTTA) onto the surface of 1-13 nm gold nanodots (Figure 3B) 89. With a short and rigid benzenethiol linker and a high packing density, the Gd(DTTA) chelates presented a slow internal motion, which contributed to a relatively high r1 of 60 mM-1s-1 at 0.7 T (30 MHz). Irure et al. imparted saccharide molecules (e.g., β-galactose) as a surface blocker onto a thiolated Gd(DO3A) decorated with ~2 nm gold nanodots 90. When tuning the length of the spacer to bring the saccharides into close proximity with Gd(DO3A), the internal motion of Gd(DO3A)s was efficiently slowed down, leading to r1 enhancement from 7 to 18 mM-1s-1 at 1.41 T. Li et al. decorated a layer of polymer coordinated with Gd3+ onto gold nanostars, achieving an r1 of 10.6 mM-1s-1 at 7.0 T 91. Liu et al. functionalized CuS NPs with Mn(II)(DTPA)s, and the resulting NPs with a diameter of 9.0 nm exhibited a high r1 of 7.10 mM-1s-1 at 7.0 T due to a high loading content of Mn2+ onto each NP 92.
Paramagnetic centers loaded or doped into the interior of nanoparticles
Many NPs afford hollow or porous structures. It is possible to load paramagnetic centers into the interior of these NPs. For instance, Gd(DOTA) has been encapsulated into liposomes 93. Effectively isolated by the bi-layer lipid, the paramagnetic centers have limited access to the bulk water, making the r1 of these particles low in the normal state. When the liposomal structure is breached, the magnetic centers are liberated, leading to an increase of r1. This property has been utilized to study the fate of drug-carrying liposomes after systemic injection 93.
Another nanoplatform that has been intensively explored is mesoporous silica NPs (MSNs), which possess tunable, nanometer scale (3 to 25 nm) pores throughout their matrix. This provides surface areas as large as thousands m2 per gram of silica with good water accessibility 94,95. For instance, Lin et al. were able to load up to 0.329 mmol of Gd(DTPA)-triethylsilane into each gram of MSNs 94. The resulting NPs showed an r1 of 19.0 mM-1s-1 (on a per Gd basis at 3.0 T). Such an increase of r1 relative to free Gd(DTPA) was attributed to slowed-down molecular tumbling. The r1 was further increased to 25.7 mM-1s-1 (Gd, 3.0 T) when the particles were PEGylated (5000 Da), in which case both qSS and τm' were increased 94. Kotb et al. reported an AGuIX NP with a diameter of 3.1 nm, which was prepared by covalently grafting Gd-chelates onto inorganic polysiloxane nanomatrix 96. This NP was used for MRI-guided radiation therapy and investigated in a proof-of-concept study before Phase I Clinical Trial.
There have also been efforts towards developing inorganic nanostructures decorated with Gd chelates, or embedded with Gd3+/Mn2+ dopants. To ensure efficient relaxation, a water-accessible surface structure is required. For instance, Mi et al. confined Gd(DTPA)s inside calcium phosphate (CaP) NPs with pores or cracks on the outer surface, leading to an ~6-fold enhancement of r1 at 0.59 T compared to free Gd(DTPA) 97,98. The same group also prepared Mn2+-doped CaP NPs, which had an r1 of 4.96 mM-1s-1 (Mn, 1.0 T) at neutral pH 7.4 and 19.96 mM-1s-1 (Mn, 1.0 T) when Mn2+ ions were liberated at acidic pH 99. Chen et al. prepared polymeric micelles made of poly(lactide) (PLA)-block-mono-methoxy-PEG (PLA-b-PEG), and grew a layer of CaP shell doped with Gd3+ onto the surface of the particles 100. Yang et al. synthesized Gd3+-doped ZnS quantum dots (i.e., Gd-Cu-In-S/ZnS quantum dots) and evaluated them as fluorescence/MRI dual modality imaging probes. The hydrophobic quantum dots were coated with a lipid vesicle formed by PEGylated dextran-stearyl acid, and the resulting particles afforded an r1 of 9.45 mM-1s-1 (Gd) at 1.41 T 101. Tu et al. reported the synthesis of 4.3 nm Mn-doped silicon quantum dots. These NPs showed strong fluorescence and a high r1 of 25.50 mM-1s-1 (Mn) at 1.4 T, 37 °C 102.
Gd- or Mn-doped nanoscale metal organic frameworks (NMOFs) represent another class of isoreticular (same topology) T1 contrast agents. These NPs are built by linking Gd3+/Mn2+ with organic bridging ligands to form molecular sieve-like structures with highly ordered coordination geometry and good water access 103. One downside is that the as-synthesized NMOFs often need to be coated with a layer of silica or polymers to protect the particles from degradation or aggregation in water, which may negatively affect r1. Nonetheless, Gd-NMOFs in rod-, plate-, and block-like morphologies have been prepared via surfactant-mediated synthesis 103,104. Their  values range from 13 to 35.8 mM-1s-1 (Gd) at 3.0 T, depending largely on the NP geometry and surface coatings 103. For Mn-NMOF, Taylor et al. prepared Mn-NMOF nanorods that were 50-100 nm in length and coated them with a thin silica shell 105. The resulting NPs exhibited an r1 of 4.6 to 5.5 mM-1s-1 (Mn) at 9.4 T.
Protein-based T1 contrast agents
Compared with artificial polymers and NPs, proteins afford advantages such as low toxicity, high biodegradability, size homogeneity, plastic surface properties, and sometimes tunable tertiary structures. These make them a unique platform to construct T1 contrast agents. Metal cations can be immobilized onto the surface or into the water-accessible interior space of a protein. Upon binding, the global rotational motion of metal cations is effectively slowed down. The internal motion may need to be suppressed by adjusting the bound rigidity. An increased qSS is usually observed when metals are located at a polar, charged, or hydrated site of a protein, which leads to r1SS enhancement. On the other hand, adjacent amino acid side chains may displace the water ligands 2, causing a drop in r1IS.
One example is lipoproteins, which are natural NPs affording high binding affinity towards macrophages and low density lipoprotein (LDL) receptors 106. Similar to liposomes, Gd-chelates can be coupled to a lipid molecule and then inserted into the phospholipid monolayer of a lipoprotein 107. For instance, Castelli et al. loaded Gd-AAZTA (q = 2) onto the surface of ~30 nm LDLs. The resulting Gd-LDLs contained up to 400 Gd-AAZTAs per particle and the r1 was 8800 mM-1s-1 on a per particle basis (0.47 T, 25 °C), or ~22 mM-1s-1 on a per Gd basis 108. These NPs hold potential as tumor imaging probes because LDL receptors are overexpressed in many tumors 107. Meanwhile, Gd chelate-loaded high density lipoprotein (HDL) can be prepared through a similar strategy. The resulting Gd-HDLs are often 7-12 nm in dimeter and the r1 is ~10 mM-1s-1 (Gd) 109. Gd-HDLs have been studied in atherosclerotic plaque imaging due to the intrinsic roles of HDLs in adjusting cholesterol levels in the peripheral tissues 106,109.
Gd-loaded clathrins have also been investigated. Clathrin triskelion is a ubiquitous protein that serves as a transporter to deliver cargo into cells (Figure 3C). Each clathrin triskelion consists of 3 heavy protein chains, and 36 clathrin triskelions can self-assemble into 1 clathrin cage, whose size ranges from 30 to 100 nm. Vitaliano and her colleagues developed two types of clathrin based T1 contrast agents by conjugating Gd(DTPA) to a clathrin triskelion 110. The first was an ~18.5 nm Gd-clathrin triskelion, which had ~81 Gd(DTPA) molecules on each clathrin triskelion (i.e., 27 Gd-DTPA per heavy chain), and the second one was an ~55 nm Gd-clathrin cage, which had 432 Gd(DTPA) molecules on each clathrin cage (i.e., 4 Gd-DTPA per heavy chain). For the Gd-clathrin triskelion, the r1 was 16 mM-1s-1 (Gd) or 1166 mM-1s-1 (Gd-clathrin triskelion) at 0.47 T. For the Gd-clathrin cage, the r1 was 81 mM-1s-1 (Gd) and 31512 mM-1s-1 (Gd-clathrin cage) 110. Interestingly, both NP conjugates were capable of crossing the BBB of rats following intravenous, intraperitoneal, and intranasal administration 110.
Viruses have also been utilized as scaffolds to construct MRI contrast agents 111. One example is Cowpea chlorotic mottle virus (CCMV) coat proteins, which can self-assemble into either an icosahedral capsid or a tubular structure in the presence of artificial DNA molecules. Liepold et al. covalently coupled Gd(DOTA) to CCMV capsids via the reactive lysine residues on the capsid surface 112. The resulting ~30 nm Gd(DOTA)-CCMV capsid afforded 60 Gd(DOTA) molecules per particle and exhibited an r1 of 46 mM-1s-1 (Gd) at 1.5 T. The r1 enhancement relative to Gd(DOTA) was again attributed to the slow tumbling and enhanced hydration numbers (qSS). On the other hand, the r1 might be restrained by a slow water exchange rate. This is because one of the four carboxylate groups in DOTA was converted to an amide, increasing the lifetime of bound water molecules from approximately 250 ns to greater than 1 ms, which was relatively long compared to the ideal lifetime window of 20-30 ns. A similar strategy has been adopted to covalently conjugate Gd(DOTA) to the surface of Tobacco mosaic virus (TMV) 111,113. The resulting r1 was around 3.7-18.4 mM-1s-1 (Gd), which was affected by the conjugation site and field strengths. The Raymond and Francis groups conjugated Gd(DTPA)s to the interior surface of bacteriophage M2 capsids, yielding stable and water-soluble Gd(DTPA)-conjugated viral capsids with an elevated r1 of 41.6 mM-1s-1 at 0.7 T, 25 °C and 31.0 mM-1s-1 at 1.4 T, 25 °C 114,115.
In addition to synthetic chelators, intrinsic metal-binding pockets of viral protein capsids have also been exploited for Gd3+ complexation. For instance, Liepold et al. reported that CCMV capsids possess metal binding sites at the three-axis that could be used for Gd3+ chelation 112. The r1 of the resulting Gd-CCMV complex was 202 mM-1s-1 (Gd) at 1.5 T 111. The same group also fused calmodulin, a Ca2+ binding protein, into CCMV. The recombinant protein was efficient in chelating Gd3+, showing an r1 of 210 mM-1s-1 (Gd) at 1.5 T. The increased r1 relative to Gd(DOTA)-CCMV was attributed to an increased binding affinity to Gd3+, which prolonged the fast local motion correlation time (τf) as well as the global rotational correlation time (τg). Apoferritin, a virus-like protein with a 7-8 nm cavity, has been used to encapsulate metal chelates 108,116. The protein cage interior surface is abundant in hydrated, polar chemical functional groups. On the other hand, its surface contains multiple hydrophilic channels that allow for smooth water exchange between the cage interior and the aqueous surroundings. These result in a prolonged secondary water residency (τm') and an increased hydration number (qSS), both of which contribute to an increased r1SS. For instance, Gd(DOTP) and Gd(HP-DO3A) were loaded into the interior of apoferritins, and the resulting NPs manifested a 20-fold enhancement in r1 117,118.
The metal binding sites of proteins can be artificially altered to achieve MRI contrast agents of exceptional r1 values. For instance, Yang and her colleagues prepared a recombinant protein called ProCA1 by de novo integration of Gd3+ ion binding site(s) into a stable host protein, the domain 1 of rat CD2 (10 kDa) 119. The resulting protein showed an overall good affinity towards Gd3+ over common physiological cations (e.g., Ca2+, Zn2+, and Mg2+) and a very high r1 (117 mM-1s-1 (Gd)) at 1.5 T, compared to that of 5.4 mM-1s-1 (Gd) for Gd(DTPA)) 120,121. Subsequent studies demonstrated that the r1 and r2 of Gd-ProCA1 could be further enhanced by PEGylation, which expanded the volume of hydrated spheres and increased the hydration numbers. The same group very recently developed a new generation of a protein probe called ProCA32, which used parvalbumin instead of CD2 as the host protein 122. ProCA32 boasted unprecedented Gd3+ selectivity (e.g., 1011-fold higher than Zn2+) and high relaxivities (i.e., r1 = 33.14 mM-1s-1 and r2 = 44.61 mM-1s-1 (Gd) at 1.4 T). According to the authors, the high relaxivities were mainly attributed to the abundance of exchangeable protons in the secondary hydration shell around the metal-binding site.
Metal chelates can also be introduced onto protein surfaces in situ. This is usually achieved by a modified metal chelate with high binding affinity towards a protein in the serum. One example is MS-325 (gadofosveset, brand name Ablavar), a Gd(DTPA) derivative that binds serum albumin, the most abundant protein in the blood stream 116. MS-325 can immediately bind to serum albumin after systemic injection, leading to a 5 to 9-fold enhancement in r1 due to a slowed tumbling and an increased qSS 2,123. Along the same direction, there have been recent efforts in making Gd chelates with multiple binding ligands and short, rigid linkers for optimal contrast effect 124,125. In addition to albumin, researchers have also explored fibrin and collagen as potential protein targets. Fibrin is produced during blood clotting, and is an ideal biomarker for thrombosis. EP-2104R, a probe containing 4-mer Gd(DOTA) per molecule and affording high affinity towards fibrin, has been developed for fibrin imaging 2,126. Collagen is the most abundant protein constituent in connective tissue and is a key biomarker for fibrosis. EP-3533, which contains 3-mer 3 Gd(DOTA) and can bind to type I collagen with low micromolar level affinity, has been synthesized and studied in the clinic 2,126. More recently, this idea has been extended to target other molecules in living subjects. As an example, Caravan et al. reported that Gd-metallopeptide, or GdP3W, can bind DNA and the interaction led to an enhancement of r1 from 16.2 to 29.6 mM-1s-1 at 0.47 T, and from 21.2 to 42.4 mM-1s-1 at 1.41 T 127. Huang et al. synthesized a Gd chelate that effectively bound to extracellular DNA and the process caused an r1 increase 128. This probe holds great potential as a MRI agent to assess tissue necrosis or tissue remodeling after myocardial infarction 2.
Magnetic nanocrystals as T1 contrast agents
Nanocrystals containing paramagnetic centers such as Gd3+, Mn2+, or Fe3+ have been synthesized and explored as T1 contrast agents. Compared to metal chelates, inorganic nanocrystals afford many more paramagnetic centers per probe. However, the T1 relaxation depends heavily on direct dipole-dipole interactions between metals and water molecules, meaning that the atoms in the interior of a nanocrystal have a negligible contribution to the relaxation. From this perspective, NPs of a small size are favored because of their high surface-to-bulk ratio (Figure 4A) 129, and surface modification is usually necessary to optimize the colloidal stability and facilitate the metal-water interaction on the surface of nanocrystals.
Figure 4.

(A) The surface-to-bulk Gd3+ ratio increases by reducing the NaGdF4 NP diameter, leading to an elevated r1 (1.5 T). Adapted with permission from 119, copyright 2011 American Chemical Society. (B) Ultra-small IONPs (~3 nm) incubated with MCF-7 cells for T1-weighted MRI. The high-resolution TEM image of the NP is shown in the right corner. Scale bar, 2 nm. Adapted with permission from 149, copyright 2011 American Chemical Society. (C) The hydroxyl groups on the surface of Gd3N@C80[DiPEG(OH)x] NPs provide large numbers of exchangeable protons for relaxation and facilitate water-Gd3+ dipolar interaction by forming hydrogen bonds. Adapted with permission from 164, copyright 2010 American Chemical Society. (D) The presence of unusual Gd3+ cluster structures within gadonanotubes, as shown in the crystal structure of [Nd6(μ6-O)(μ3-OH)8(H2O)24]8+. Adapted with permission from 181, copyright 2000 American Chemical Society. (E) 3D simulation of the “secondary electron spin transfer” process of water-soluble GO-Gd@C82 nanohybrids. Adapted with permission from 165, copyright 2014 Springer Nature. (F) Water bridge coordination with two nearby Gd3+ centers on the (100) facet of a Gd2O3 nanoplate according to DFT calculations. Adapted with permission from 154, copyright 2016 Royal Society of Chemistry.
Gd2O3 NPs, for instance, have been synthesized by different methods (e.g., polyol synthesis 130-132, thermal decomposition 38, bio-mineralization 133, and hydrothermal approach 134), with sizes ranging from 1 to 15 nm 38,130-134. The probe preparation often includes a post-synthesis surface modification step (with polysiloxane 130, D-glucuronic acid 131, polyvinyl pyrrolidone (PVP) 38, polysiloxane 135, etc.) that endows particles with good colloidal stability and surface hydrophilicity in aqueous solutions. The r1 of the resulting Gd2O3 NPs ranges from 2 to 40 mM-1s-1 (Gd), depending largely on the particle size 38,130-135. For instance, Ahmad et al. prepared 1-3 nm ultrasmall Gd2O3 NPs through a hydrothermal reaction; these NPs exhibited an r1 value ranging from 26 to 38 mM-1s-1 (Gd) at 1.5 T, with smaller particles showing higher r1 values 134. In addition to Gd2O3, other Gd salts have also been made into nanocrystals using wet chemistry. For instance, Carniato et al. prepared GdF3 NPs less than 5 nm in diameter through co-precipitation 136; the r1 of the resulting NPs was in the range of 3 to 6 mM-1s-1 (Gd) at 0.47 T 136. Hifumi et al. made GdPO4 nanocrystals by co-precipitating Gd3+ and PO43- in the presence of dextran 137. The resulting dextran-coated GdPO4 NPs had a size of 20-30 nm and an r1 of 13.9 mM-1s-1 (Gd) at 0.47 T 137. NaGdF4 NPs were synthesized via pyrolysis in organic solvents such as 1-octadecene. The as-synthesized, hydrophobic NPs can be surface-exchanged with PEG di-acid or PVP 129,138,139. 2 nm PEGylated NaGdF4 NPs, for instance, had an r1 value of 8-9 mM-1s-1 (Gd) at 1.5 T and 3.0 T 129,138,139. Recently, Huang et al. prepared a folic acid PEI-decorated NaGdF4:Eu NP as a fluorescence/MRI dual-modal nanoprobe via a facile hydrothermal approach. The resulting NP possessed an overall diameter of 56 nm and an r1 of 3.26 mM-1s-1 at 1.5 T 140.
Considering the potential toxicity of Gd, there have been efforts of preparing alternative, less toxic magnetic nanocrystals. For instance, manganese oxide NPs in the form of MnO, Mn3O4, or a mixture of the two, have been prepared 141,142. Na et al. synthesized MnO NPs by thermal decomposition and coated the NPs with PEG-phospholipids 143. The synthesized NPs possessed an r1 of 0.12 to 0.37 mM-1s-1 (Mn), which was inversely correlated with the NP size. Subsequent studies showed that the r1 can be increased to ~2 mM-1s-1 (Mn) by coating the NPs with hydrophilic coatings such as albumins 144 or mesoporous silica 145,146. There have been efforts towards preparing hollow MnO NPs, in the hope of increasing the amount of surface Mn. For instance, Shin et al. reported a hollow MnO NP modified by PEGylated phospholipid, which exhibited an r1 of 1.42 mM-1s-1 (Mn) at 3.0 T 146. Kim et al. synthesized a mesoporous silica-coated hollow MnO NP, which showed an r1 of 0.99 mM-1s-1 (Mn) at 11.7 T 145. On the other front, reducing the size of MnO NPs has also been explored. For instance, Baek et al. and Omid et al. reported the synthesis of ultrasmall MnO NPs (2-5 nm), with an r1 of ~6-7 mM-1s-1 (Mn) at 3.0 T 147,148. Compared to MnO, Mn3O4 NPs showed comparable or slightly higher r1. For instance, Huang et al. prepared ~10 nm Mn3O4 nanocrystals whose r1 was ~ 2.06 mM-1s-1 (Mn) at 3.0 T 149. Xiao et al. used a laser ablation method to prepare 9 nm Mn3O4 NPs, and their r1 was 8.26 mM-1s-1 (Mn) at 3.0 T 150. Shi and his coworkers used a solvothermal decomposition method to prepare PEG-PEI-coated Mn3O4 NPs (r1 = 0.59 mM-1s-1 at 0.5 T) 151 and cysteine-PEG-citrate-coated Mn3O4 NPs (r1 = 3.66 mM-1s-1 at 0.5 T) 152, and the relatively high r1 was attributed to the hydrophilic surface coating.
Manganese oxides are gradually decomposed in an acidic environment in vivo (e.g., ~pH 6.8 in the tumor microenvironment, and ~pH 5.5 in the lysosomes). This results in release of free Mn2+ to the surroundings, accompanied with contrast amplification on T1-weighted MRI. This property has been utilized to develop MnO-based pH-sensitive MRI probes 99. Recently, Cheng et al. developed a rhomboid-shaped MnCO3 NP coated with polydopamine. The resulting NPs had a high r1 of 6.3 mM-1s-1 at 7.0 T, pH 7.4 and 8.3 mM-1s-1 at 7.0 T, pH 6.0. The hydrophilic and loose surface coating as well as the abundance of free π-electrons from polydopamine facilitated fast water exchange and r1 enhancement 153. More examples of Mn2+-based MRI nanoscale architectures such as rattle-type, nanosheets, or heterogeneous structures of MnOx NPs, are discussed by Hsu et al. in a recent review article 142.
Aside from Gd3+ or Mn2+, other paramagnetic metals have also been investigated. Ge et al. embedded Cu2+ ions into polydopamine NPs to prepare a novel theranostic agent 154. The resulting NPs had an average diameter of 51 nm and exhibited an r1 of 5.39 mM-1s-1 per Cu at 1.5 T, pH 7.4. While mostly exploited as T2 contrast agents, IONPs of very small sizes have also shown promise as T1 contrast agents 155. Previously, preclinical and clinical studies suggested the potential of using ferumoxytol (IONP size ~5 nm) as an alternative T1 contrast agent for patients with compromised renal functions 155-157. The Shi group prepared citrate-stabilized, 2.7 nm IONPs via a solvothermal method, which exhibited an r1 of 1.4 mM-1s-1 (Fe) at 1.5 T 158. Kim et al. synthesized 3 nm IONPs capped with PEG-phosphine oxides, which showed r1 of 4.78 mM-1s-1 (Fe) at 3.0 T and a relatively low r2/r1 ratio of 6.12 (Figure 4B) 159. Li et al. reported the synthesis of 3.3 nm IONPs by a high-temperature co-precipitation method 160. The r1 and r2 of the resulting particles were 8.3 mM-1s-1 and 35.1 mM-1s-1 (on a per Fe basis, at 4.7 T), respectively.
Recently, versatile two-dimensional (2D) nanostructures have been prepared. The architecture allows for a high ratio of metal ions exposed to the surroundings, facilitating water-metal dipolar interactions and relaxation. For instance, the Hyeon group reported a PEGylated MnOx nanoplate with a width ranging from 8 to 70 nm and a thickness of ~1 nm 161. The nanoplate exhibited an r1 up to 5.5 Mm-1s-1 (1.5 T). The Tan group prepared a MnO2 nanosheet 162. They found a dramatic enhancement in both r1 (from 0.10 mM-1s-1 to 4.89 mM-1s-1, 3.0 T, 37 °C) and r2 (from 0.42 mM-1s-1 to 50.57 mM-1s-1, 3.0 T, 37 °C) when the MnO2 nanosheets were reduced to Mn2+ by intracellular glutathione. The Gao group developed a series of Fe3O4 nanoplates having a thickness ranging from 2.8 to 8.8 nm 163. The nanoplates exhibited an r1 up to 43.18 mM-1s-1 (1.5 T) due to a high surface-to-volume ratio and exposure of the iron-rich (111) facet of the Fe3O4 crystal. The same group later reported that Gd2O3 nanoplates with an exposed metal-rich (100) facet were ~4-times higher in r1 than those whose oxygen-terminated (111) facet was exposed 164. This phenomenon was explained by density functional theory (DFT) calculations, which showed that water molecules were able to bridge-coordinate with two nearby magnetic centers for the (100) type nanoplates (Figure 4F). This work highlights the importance of tailoring surface crystal structures for r1 enhancement.
Metallo-carbonaceous nanostructures as T1 contrast agents
Paramagnetic centers, especially Gd3+, can be loaded onto or into carbon particles of different structures, including gadographenes or gadographene oxides 165-167, endohedral gadofullerenes 168-175, gadonanotubes 176-182, and gadodots 183-187, etc. For most of the metallo-carbonaceous contrast agents, good water access to metal ion centers, smooth water exchange, and prevention of metal ion leakage, are crucial for efficient relaxation. These factors are largely determined by the 2D- or 3D-architectures, the carbonaceous nanostructure surface properties, and the organic coatings.
For gadographenes or gadographene oxides, Gd3+ is loaded on the surface of a graphene or graphene oxide (GO) sheet, often through physical adsorption 165. The loading is easier with GO, whose surface displays multiple carboxyl groups. The r1 of the resulting gadographenes or gadographene oxides typically ranges from 20 to 90 mM-1s-1 (Gd) 165-167. For instance, Ren et al. reported a carboxyl-functionalized GO loaded with 2.8 wt% Gd3+. The NPs afforded good colloidal stability and a high r1 of 63.8 mM-1s-1 (Gd) at 3.0 T 166. Similarly, Mn2+ can be loaded onto graphene or GO. For instance, Kanakia et al. prepared a Mn2+ intercalated graphene nanoplatelet 188. These NPs showed a very high r1 of 92.2 mM-1s-1 (Mn) at 0.47 T. Hung et al. used Lipari-Szabo formalism to simulate the fast local motion of Gd3+-encapsulated graphenes and GOs. The fitted τf was below 0.5 ns regardless of τR, indicating that the captured nuclear magnetic relaxation was not dependent on anisotropy 165. Although exactly how Gd3+ interacts with the carbon scaffolds remains unclear, the fast local motion of Gd3+ would limit r1 165. In addition, it was found that introducing surfactants (e.g., sodium cholate, Pluronic F108NF) onto the graphene surface may cause an r1 decrease 165. This is attributed to reduced water accessibility, decreased effective hydration numbers (q + qSS), as well as changes to the Gd3+ microenvironment and the electronic properties of the nanostructures.
For gadofullerenes, gadonanotubes, and gadodots, Gd3+ is encapsulated within a closed or half-closed carbon architecture. In theory, the dipolar interaction between Gd3+ and water is at the minimum. Yet, a large r1 is usually observed with these nanostructures. One possible explanation is that the particles induce water relaxation through a “secondary electron spin transfer” process 175. More specifically, the carbon shell in these nanostructures possess delocalized electrons that can interact with Gd3+, causing a shift of electron spins from the caged Gd3+ to the carbon nanostructure. As a result, the water relaxation capacity is extended to the carbon shell, which efficiently interacts with the aqueous surroundings. Another possible explanation is that the carboxyl or hydroxyl groups on the surface of the carbon scaffold may provide abundant exchangeable protons in the proximity of Gd3+ for relaxation (e.g., Gd@C60[C(COOH)2]10, and Gd3N@C80[DiPEG(OH)x]) 174,189. The defects (or, in the case of carbon nanotubes, the cylinder channel) on the carbon nanostructures may also provide additional water access 165,176. For Gd3+-entrapped carbon nanotubes, Sethi et al. believed that water molecules were not only able to diffuse into the hydrophobic channel, but also underwent fast molecular transport within it 176.
Endohedral gadofullerenes are usually synthesized by evaporating a Gd2O3 and graphite mixture in the presence of arc discharge current. The as-synthesized endohedral gadofullerenes may contain 1 to 3 Gd3+ ions per particle. Further surface modification with ligands such as PEG is usually needed to improve the physiological stability of the particles 173. One problem of this approach is that the yield is very low, often less than 1% 173. Moreover, the raw product often contains empty fullerenes that are 10-fold in excess, and the purification is laborious 168,172,173. Recent studies showed that including nitrogen-containing precursors could improve the production yield 170. But due to the presence of large amounts of amorphous carbon species in the raw soot, it still requires multiple rounds of electrochemical extraction and HPLC purification to enrich endohedral gadofullerenes 173. Nonetheless, pure endohedral gadofullerenes may yield an r1 that is close to the theoretical maximum based on the Solomon-Bloembergen-Morgan (SBM) theory 79. Examples include Gd@C60(OH)x, which has an r1 of 97.7 mM-1s-1 at 1.4 T 173, and Gd3N@C80, which has an r1 value of over 200 mM-1s-1 at 0.35 T and 0.47 T on a per gadofullerene basis (there are three Gd3+ ions per fullerene) 171,173. In particular, Zhang et al. reported that PEGylated Gd3N@C80 (molecular weight of PEG = 350-750 Da) afforded an r1 of 232-237 mM-1s-1 per endofullerene (or 77-79 mM-1s-1 per Gd) at 2.4 T, making it one of the most potent T1 contrast agents (Figure 4C) 174. Other than encapsulating Gd3+ into fullerene, the Gao group conjugated Gd(DOTA) moieties onto the C60-fullerene surface via a 2-aminoethyl linker 190. Due to confined rotation of each Gd(DOTA), the r1 values were elevated from 3.2 and 5.4 mM-1s-1, to 29.2 and 49.7 mM-1s-1, at 1.5 and 0.5 T, respectively.
Several groups, including us, have reported the synthesis of gadodots 183-186. Compared to gadofullerenes, gadodots have a relatively large size, wide size distribution, and low r1 (e.g., 5-12 mM-1s-1) 183-186, but they afford a relatively high yield, and strong luminescence 187. For instance, we synthesized ~11 nm gadodots by calcination of Gd(DTPA). The particles were highly fluorescent, photostable, and resistant to physiological degradation. The r1 of the NPs was 5.88 mM-1s-1 (Gd) at 7.0 T 183. When the particles were coupled with c(RGDyK), the gadodot conjugates were able to selectively accumulate in tumors through RGD-integrin interactions, which could be visualized on a T1-weighted map. Meanwhile, the intratumoral distribution of the particles could be examined by immunofluorescence imaging.
Gadonanotubes are usually synthesized by sonicating carbon nanotubes with GdCl3. This causes Gd3+ clusters (e.g., Gd6(μ6-O)(μ3-OH)8(H2O)24) to form inside the carbon nanotubes 176,177,182. The clustering contributes to a large hydration number, and prevents Gd3+ from leaking out of the nanotubes (Figure 4D) 176. Subsequent surface modification (e.g., PEGylation) is necessary to prevent bundling of the gadonanotubes through van der Waals interactions. The resulting conjugates typically exhibit a very high r1 of ~150-180 mM-1s-1 (Gd) at 1.5 T, 37 °C 176,182. Under low field strengths (0.01 MHz), r1 values as high as ~635 mM-1s-1 (Gd) have been observed due to strong electronic relaxation 176. Recently, Gizzatov et al. synthesized highly carboxylated graphene nanoribbons (GNRs) by reductively cutting multi-walled carbon nanotubes with a K/Na alloy, followed by surface functionalization with p-carboxyphenyldiazonium salts and direct Gd3+ loading. The resulting Gd-GNRs were 125-280 nm in width and 7-15 nm in thickness, and possessed an r1 of 70±6 mM-1s-1 (Gd) at 1.41 T 167.
Hybrid metallo-carbonaceous nanostructures have also been made. For instance, Ananta et al. reported that by geometrically confining Gd-based contrast agents (e.g., Magnevist, Gd@C60(OH)27, or Gd3+-encapsulated ultrathin carbon nanotube) within the pores of silicon microparticles (normally 1 μm in size and ~0.4 μm in thickness), the T1 contrast abilities can be dramatically enhanced 181. Specifically, the r1 was increased from ~50 to ~200 mM-1s-1 (Gd) for Gd@C60(OH)27 at 1.5 T, and ~100 to ~150 mM-1s-1 (Gd) for Gd3+-encapsulated carbon nanotubes. The enhancement was attributed to a decreased rotational motion, good water access, and an optimal proton exchange. Cui et al. loaded gadofullerenes into the hydrophobic pockets of graphene oxide (GO) via π-π interactions 175. The resulting nano-hybrid afforded an extraordinary r1 of 368.7 mM-1s-1(Gd) at 1.5 T and 439.7 mM-1s-1(Gd) at 4.7 T. In addition to the confinement benefits stated above, the authors also attributed the relaxivity increase to the efficient transfer of electron spin densities from the caged Gd3+ to the GO surface (Figure 4E) 175,191.
T2 contrast agents
Superparamagnetic NPs with high magnetic moments
Most T2 contrast agents are Fe-based superparamagnetic NPs. The NP synthesis is typically achieved through bottom-up wet chemistry approaches. These include: (1) water-based synthesis, such as co-precipitation and hydrothermal reaction (2) water-in-oil microemulsion, and (3) organic solvent-based synthesis, such as thermal decomposition and solvothermal reactions 46,192,193. As discussed in Mechanism Section, direct water contact is not required for T2 relaxation, which is different from T1. Instead, r2SS is the major contributor for r2. The relaxivity enhancement can be achieved by increasing particle magnetization, water access to the secondary sphere, and dynamic water exchange between the second sphere and bulk water.
IONPs are the most commonplace T2 contrast agents. They are made of ferromagnetic maghemite (γ-Fe2O3) or magnetite (Fe3O4), whose MS values are ~70 or ~80-90 emu/g at room temperature 194. Despite the mediocre MS, IONPs afford good biocompatibility and biodegradability, low cost, and straightforward synthesis, making them widely used in pre-clinical and clinical MR imaging 63,67-71. Conventional IONPs, such as ferumoxides and ferucarbotran, are synthesized by co-precipitation, and their mS is in the range of 30 to 50 emu/g, much lower than that of the bulk material 51. These translate to mediocre r2 values, ranging from ~98 to ~190 mM-1s-1 (Fe) 51,195-197. With advanced synthetic approaches, IONPs with improved crystallinity can be obtained. For instance, Wang et al. used a hydrothermal method to synthesize highly crystalline IONPs whose mS is 85 emu/g 198. Meanwhile, pyrolysis-based synthetic protocols have been established to prepare large-scale IONPs with close-to-bulk magnetization and accurate size control 47,199-202.
Additionally, different transition metals can be doped into IONPs to obtain composite ferrite materials, i.e., MxFe3-xO4 (M = Fe, Co, Mn, Ni, or Zn). The doping may alter the crystallographic atom arrangement and magnetic spin alignment, and in turn affect the macroscopic magnetic properties 203. For instance, the Cheon group prepared 12 nm MnFe2O4, Fe3O4, CoFe2O4, and NiFe2O4 NPs, and found that their magnet moments (mS) were 110 emu/g, 101 emu/g, 99 emu/g, and 85 emu/g, respectively 204. The differences in magnetism translated to variations in contrast abilities. Specifically, the r2 values were 218 mM-1s-1 (Fe), 172 mM-1s-1 (Fe), 152 mM-1s-1 (Fe), and 62 mM-1s-1 (Fe) at 1.5 T for MnFe2O4, Fe3O4, CoFe2O4, and NiFe2O4 NPs, respectively. Using a similar approach, the same group also doped Zn2+ into MnFe2O4 NPs 205. It was found that Zn2+ dopants occupied the tetrahedral instead of the octahedral sites of ferrites, causing a more dramatic increase in magnetism. In particular, 15 nm Zn0.4Mn0.6Fe2O4 NPs showed an extremely high r2 of 175 emu/g and an r2 of 860 mM-1s-1 (Fe) at 4.5 T 205.
It is also possible to synthesize non-spherical IONPs. With a reduction in anisotropy, these NPs may have superior magnetic properties. For instance, Hauke et al. prepared iron oxide nanorods with a length of 24 nm and diameter of 2.5 nm via a one-step template-mediated method from iron oleate. The iron oxide nanorods afforded a high saturation magnetization of 370 emu/cm3, which is close to the value of bulk maghemite, 400 emu/cm3 206. The Gao group synthesized octapod IONPs with an edge length of 30 nm and a hydrodynamic size of 58 nm by introducing Cl- anions during the synthesis process. The yielded NPs had an r2 of 679.30 mM-1s-1 (Fe) at 7.0 T, 27 °C 47. The same group later reported a 2D-Fe3O4 nanoplate with the (111) surface exposed, and the particles showed a higher r2 up to 311.88 mM-1s-1 at 0.5 T than IONPs of equivalent surface area due to a reduced surface/shape anisotropy and an enlarged effective diameter (Figure 5B-D) 163.
Figure 5.

(A) Due to reduced surface/shape anisotropy, octapod IONPs are capable of generating a larger volume of magnetic inhomogeneity than spherical particles with the same geometric volume. Scale bar, 100 nm. Adapted with permission from 41, copyright 2013 Springer Nature. (B) TEM images of 2D-Fe3O4 nanosheet with a thickness of 8.8 nm. Scale bar, 100 nm (insert, 5 nm). 2D-Fe3O4 nanosheets exhibited higher r2 values (C) and larger effective diameters (D) than IONPs of equivalent surface area. Adapted with permission from 153, copyright 2014 American Chemical Society.
Metallic and alloy magnetic materials have also been investigated. For instance, the Sun group prepared Fe NPs by pyrolyzing Fe(CO)5 in 1-octadecene under Ar protection 207. However, rapid air oxidation and the associated magnetism loss made it almost impossible to use these Fe NPs for bio-applications. To solve the problem, the group passivated the surface of the as-synthesized Fe particles with a dense layer of Fe3O4 by controlled oxidation of hexadecyammonium chloride, so that the iron oxide layer can protect the Fe cores from direct air exposure. Formation of a Fe/Fe3O4 core-shell structure led to generation of additional exchange anisotropy and magnetization stabilization. The resulting NP exhibited a high mS value of 164 emu/g due to the Fe core and a high r2 up to 220 mM-1s-1 (Fe) at 3.0 T, 25 °C. A similar finding was reported by the Tilley group, who heated [Fe(C5H5)(C6H7)] at 130 °C to synthesize an α-Fe/magnetite (Fe3O4) or maghemite (Fe2O3) core/shell NP (core/shell: 9.0/3.2 nm). The resulting NPs exhibited mS of 150 emu/g and r2 up to 324 mM-1s-1 (9.4 T); both values are higher than IONPs of the same size (mS = 40-70 emu/g, r2 = 145 emu/g) 208. The Dai group adopted a chemical vapor deposition approach to synthesize FeCo nanocrystals and coated the particles with a graphitic shell to prevent oxidation 209. The resulting, 7 nm FeCo NPs exhibited an extremely high mS value of 215 emu/g, which is close to the bulk value 209. The r1 and r2 values were 70 mM-1s-1 and 644 mM-1s-1 (Fe+Co) at 1.5 T, respectively 209. Recently, the Hou group and us reported a facile wet chemistry method to prepare Fe5C2 NPs 194,210,211. These NPs possessed a close-to-bulk mS of 125 emu/g, and they were highly resistant to air oxidation. Phospholipid-coated ~20 nm Fe5C2 NPs showed a high r2 relaxivity of 464.02 mM-1s-1 (Fe) at 7.0 T 194.
Impact of surface coating on r2
The surface properties of NPs affect their r2 in a complex way, as witnessed in magnetic NPs with distinct coating species 212. Compared to the extensive effort in preparing NPs of higher magnetism, however, there has been far less effort in modulating the surface properties of NPs to enhance r2. This is probably because the surface implications are broader but less explicit.
Firstly, the capping ligands of NPs may affect the arrangement of surface atoms, thereby influencing the particle magnetization. Roca et al. reported that an oleic acid coating of IONPs helped render the layout of surface iron atoms similar to those in the interior. This meant a reduced surface canting effect and hence improved magnetization. They found that 17 nm IONPs coated with oleic acid exhibited a higher mS than those that were not (76 vs. 66 emu/g at 298 K) 213. Other chelating agents (e.g., phosphates, sulfates, and citrate) are expected to have a similar surface impact 213,214.
Secondly, NP coatings may influence the magnetic field inhomogeneity, which is crucial to r2. This is often seen with capping ligands that are rich in π-electrons. When magnetic NPs create a fluctuating magnetic field upon a radio frequency perturbation, the electrons in the surrounding atoms undergo circulations. This generates small local magnetic fields of an opposite direction, which contribute to enhanced field inhomogeneity. As an example, Zeng et al. used three types of PEG derivatives, including diphosphate-PEG, hydroxamate-PEG, and catechol-PEG, to coat IONPs 31. The diphosphate group provided the strongest covalent binding to the surface Fe2+/Fe3+, while catechol and hydroxamate groups offered additional π-π and p-π conjugation. They found that diphosphate-PEGcoated 3.6 nm IONPs had an r2 of 24.6 mM-1s-1 (Fe) at 3.0 T. As a comparison, catechol-PEG- and hydroxamate-PEG-coated 3.6 nm IONPs exhibited much higher r2 values of 44.8 and 48.8 mM-1s-1 (Fe), respectively.
Thirdly, NP coatings occupy or interact with the aqueous surroundings, which affects r2SS. This influence is at least two-fold. The first is the impact on water accessibility, primarily affected by the thickness and density of surface coatings. An increased coating thickness means more space occupied by the coating materials, which is unfavorable for elongating water-NP distance and reducing magnetic inhomogeneity. For instance, Joshi et al. showed that when increasing silica coating thickness from 1 to 14 nm, the r2 of IONP@SiO2 NPs decreased from 94 to 32 mM-1s-1 (Fe) 215. Hurley et al. showed that when IONPs were coated with 14 nm thick solid silica, there was a drop in r2 from 47 to 23 mM-1s-1 (Fe) at 1.4 T 95. Meanwhile, when the particles were coated with mesoporous silica of the same thickness, r2 remained unchanged. This emphasizes the importance of a water-accessible surface architecture to r2 enhancement. The second is the water residency in the secondary sphere that also impacts r2. Because the residency time of the diffusing water molecules (τm') is usually shorter than the relaxation time (T2m'), extending the water stay is beneficial for r2 enhancement. Hence, a hydrophilic and highly hydrated surface coating is usually favorable. However, as discussed above, too thick a coating may end up squeezing the space of the secondary sphere and negatively affecting r2. More specifically, for NPs having a thin coating layer, water molecule diffusion follows Brownian random motion, and residency in the second sphere (i.e., τm') is largely dependent on the particle surface area. For these NPs, r2 increases as the particle core size grows, at least within a certain size range 44,216. For particles having a thick coating layer, however, the coating plays dual roles in the relaxation process. On the one hand, it may slow down random diffusional motion of water molecules, leading to a prolonged τm' (or τD') 61. On the other hand, a larger or denser coating will occupy more secondary shell space and cause a reduced hydration volume. For instance, Hu et al. reported that the r2 of diethylene glycol-coated IONPs was 119 mM-1s-1 (Fe) (3.0 T, 25 °C), while that of PEG600-coated particles was 55 mM-1s-1 (Fe) 61. LaConte et al. found that when increasing the molecular weight of PEG coating from 750 to 2000 Da, the r2 of PEGylated IONPs (6.6 nm) dropped from ~360 to ~175 mM-1s-1 (Fe) at 0.47 T 217. Tong et al. studied PEGylated IONPs (13.8 nm) of different thicknesses and they found that the highest r2 was achieved when the PEG coating thickness was 7.4 nm (385 mM-1s-1(Fe), 7.0 T) 60. This suggests the existence of an optimal core-to-coating ratio (i.e., ~0.93 in Tong's work), at which the τm' extension and qSS reduction effects are balanced.
Currently, small ligands, polymers, and silica are overwhelmingly used in surface modification of magnetic NPs. Proteins, many of which afford good hydrophilicity, abundant hydrated functional groups, and tertiary structures favoring water access and retention, have been understudied. Previously, we reported the synthesis of human serum albumin (HSA)-coated IONPs, which gave a high r2 of 314.5 mM-1s-1 (Fe) at 7.0 T 218. Recently, Huang et al. employed casein to coat 15 nm IONPs, and they found that the resulting NPs possessed an r2 of 273 mM-1s-1 (Fe, 3.0 T), ~2.5 times higher than those coated with amphiphilic polymers (109 mM-1s-1) 219. Such an r2-enhancing effect with casein coating was also observed by our group with Fe5C2 NPs. For casein-coated 22 nm Fe5C2, we recorded an extremely high r2 of 973 mM-1s-1 (Fe) at 7.0 T (Figure 6A) 211. Although the exact mechanism is unknown, we believe it is related to an increased hydration number and a decreased water diffusion rate (1/τD') caused by the casein coating 34,211,218. Similarly, an r2 increase was observed with virus-coated NPs. For instance, Shukla et al. encapsulated cubic IONPs into Brome mosaic virus (BMV) via a templated self-assembly process 111. The resulting core-shell NPs exhibited a high r2 of 376 mM-1s-1 (Fe), which was 4-fold higher than Feridex and 6.5-fold higher than Supravist.
Figure 6.

(A) Fe5C2 NPs (~22 nm) coated with casein exhibit extremely high r2 of 973 mM-1s-1 (Fe) at 7.0 T. As a comparison, phospholipid- and zwitterion-dopamine-sulfonate (ZDS)-coated NPs showed an r2 of around 450 mM-1s-1. Adapted from 201 under the Creative Commons Attribution License. (B) Cartoons, TEM images, simulation models and calculated stray fields of three nanoclusters of IONPs of heterogeneous geometries. Adapted with permission from 217, copyright 2017 Nature Publishing Group.
With appropriate surface chemistry, multiple magnetic NPs can aggregate in a controlled manner to form a nanocluster. This often results in increased magnetization, enhanced magnetic field inhomogeneity, and possibly extended water residency. This phenomenon can be utilized to prepare particles having high r2 values. For example, the Shen and Shi groups observed r2 as high as 550-580 mM-1s-1 at 3.0 T with aggregated PEI-decorated IONPs 220,221. Peiris et al. prepared linear nano-chains made of ~30 nm IONPs 222. The nano-chains exhibited an r2 of 101.05 mM-1s-1 (Fe) at 1.4 T, compared to that of 44.87 mM-1s-1 for individual IONPs. Moffat et al. incorporated multiple 10 nm IONPs into poly(acrylamide) micelles 223. The resulting ~63 nm nanospheres showed a very high r2 of 910 mM-1s-1 (Fe) at 7.0 T. Paquet et al. assembled 9.1±2.1 nm IONPs within a hydrogel coating; the resulting nanoclusters showed a high r2 of 505 mM-1s-1 (Fe) at 3.0 T 224. Wu et al. prepared an ~120 nm IONP cluster by encapsulating multiple 10-20 nm IONPs into a poly(dopamine) shell 225. These NPs afforded a high r2* of 433.03 mM-1s-1 (Fe) at 9.4 T. Yang et al. imparted multiple 8-10 nm IONPs onto the surface of graphene, and the resulting conjugates exhibited an r2 of 108.1 mM-1s-1 (Fe) at 3.0 T 226. Marie et al. loaded 13.3 nm IONPs into liposomes, producing 212 nm particles that had an r2 of 259.5 mM-1s-1 (Fe) at 7.0 T 227. Recently, Zhou et al. prepared a series of iron oxide clusters using IONPs of heterogeneous geometries 228. They observed an ~3-8-fold enhancement of r2 relative to nanoclusters made with IONPs of the same geometry. This r2 enhancement came from an artificially reduced field symmetry, which created additional local field inhomogeneity. Introducing cube- or plate-shaped IONPs of reduced anisotropy further enhanced this field asymmetry (Figure 6B).
T1-T2 dual-mode contrast agents
While T2 contrast agents afford higher relaxivities than their T1 counterparts, their diagnostic accuracy is influenced more by artifacts (e.g., hemorrhage, air, metallic impurities, and blood clots 11). To address this issue, there has been a recent interest in developing dual-functional MRI contrast agents that can simultaneously accelerate T1 and T2. It is hoped that with dual-mode scans, imaging results can self-validate, thereby reducing the risks of misdiagnosis 228,229.
Such a dual-mode probe can be created via a “two-to-one” approach, which uses one magnetic component to shorten both T1 and T2. For example, the Gao group synthesized 4.8 nm Gd-doped IONPs through thermal decomposition. The resulting NPs exhibited high r1 (7.85 mM-1s-1 (Gd)) and mediocre r2 (41.14 mM-1s-1 (Fe)) at 7.0 T. Both phantom and in vivo studies confirmed the feasibility of using such particles for dual-mode MRI 230. The same group later reported the synthesis of ~14 nm Gd-doped IONPs, whose r1 and r2 were 69.5 mM-1s-1 (Gd) and 146.5 mM-1s-1 (Fe) at 7.0 T, respectively 231. The high r1 and r2 of Gd-doped IONPs were attributed by the authors to the formation of Gd2O3 clusters within the superparamagnetic iron oxide domain 231. They also reported 5 nm MnFe2O4 NPs [r1 and r2 were 18.0 mM-1s-1 (Mn) and 45.9 mM-1s-1 (Fe) at 0.5 T, respectively], and 14 nm Eu3+-doped IONPs [r1 and r2 were 36.8 mM-1s-1 (Eu+Fe) and 97.5 mM-1s-1 (Eu+Fe) at 0.5 T, respectively], both of which could be used as dual-mode contrast agents 232,233. Recently, Chen et al. reported the synthesis of FeMnSiO4 hollow nanospheres and assessed their potential as a pH-responsive dual-mode contrast agent 234. The NPs were stable at pH 7.4. When the pH was decreased to 5.0, however, Mn2+ was liberated while iron was retained in the nanostructure. This led to a simultaneous increase of r1 [0.6 to 1.92 mM-1s-1 (Mn)] and r2 [from 49.43 to 92.39 mM-1s-1 (Fe)] at pH 5.0.
A dual-mode contrast agent can also be synthesized through a “two-to-two” approach, in which case the shortening of T1 and T2 is mediated by two components within a composite nanostructure. Since direct water contact is necessary for T1 relaxation but not so for T2 relaxation, a “two-to-two” agent often adopts a core-shell nanostructure, with the T1 component exposed to the bulk water and the T2 component located at the center. For instance, Li et al. synthesized Fe3O4/Gd2O3 core/shell nanocubes and investigated their potential as a dual-mode contrast agent (Figure 7A) 39. The r1 and r2 of the nanocubes were 45.24 mM-1s-1 (Gd) and 186.51 mM-1s-1 (Fe) at 1.5 T (Figure 7B). However, in such a hybrid structure, the T2 moiety may quench the T1 moiety, leading to a compromised r1 229,235,236. To solve the problem, Choi et al. prepared a sandwich-like hybrid NP that consisted of a Gd2O(CO3)2 shell (the T1 moiety), a MnFe2O4 NP core (the T2 moiety), and a SiO2 isolation layer in between. They found that a 16 nm silica layer was optimal to prevent the inter-moiety interferences, in which case a maximized r1 [33.1 mM-1s-1 (Gd)] was achieved without compromising r2 [274 mM-1s-1 (Mn + Fe)] 237. The same group recently reported a new “two-to-two” agent where they used a less toxic T1 material, Mn-NMOF, to replace Gd2O(CO3)2 as the shell (Figure 7C). Similarly, when the SiO2 layer was 16 nm, optimal r1 and r2 were reached (8.2 mM-1s-1 (Mn) and 238.4 mM-1s-1 (Mn + Fe), respectively, Figure 7D) 11. Gao et al. also reported a T1-T2 dual mode contrast agent with an r1 = 6.13 mM-1s-1 and an r2 = 36.89 mM-1s-1 (3.0 T) by coating one SiO2 layer (thickness = 19 nm) onto monodispersed IONPs (diameter = 12 nm) then growing an additional mesoporous SiO2 (thickness = 12.5 nm) on top of it for grafting Gd(DTPA) 238. In addition to core-shell nanostructures, dumbbell-like dual-mode contrast agents have also been exploited. For instance, Cheng et al. prepared a hybrid NP composed of a Gd-chelate-coated gold NP (5-10 nm), an IONP (10-12 nm), and a Pt nanorod (4 nm in length) linker. These NPs exhibited high r1 and r2 of 18.6-43.6 mM-1s-1 (Gd) and 123-136 mM-1s-1 (Fe) at 7.0 T, respectively 239.
Figure 7.

T1-T2 dual mode contrast agents. (A) HRTEM image of a Fe3O4 nanocube decorated with a Gd2O3 coating. The average edge of the nanocube is 9.2 nm. (B) The r1 and r2 of Fe3O4/Gd2O3 nanocubes are 45.24 and 186.51 mM-1s-1 at 1.5 T. Adapted with permission from 33, copyright 2016 Royal Society of Chemistry. (C) mAFIA, a T1-T2 dual-mode contrast agent, consists of a Zn0.4Fe2.6O4 magnetic NP core (~15 nm), a SiO2 separation layer (~16 nm), and a Mn-NMOF shell (~2 nm). This was visualized in the electron energy loss spectrum analysis, in which Fe, Si, and Mn were coded with yellow, brown, and green respectively. (D) The r1 and r2 of mAFIA are 8.2 and 238.4 mM-1s-1 (1.5 T). Adapted with permission from 10, copyright 2014 American Chemical Society.
The general rules of surface impact on T1 and T2 still apply to these dual-functional contrast agents. For the “two-to-one” design, a high surface-to-volume ratio (e.g., a small size, and enhanced surface curvature), high hydrophilicity, good water accessibility, and stable surface coatings are beneficial factors for T1 and T2. For the “two-to-two” design, where an isolation layer separates the T1 and T2 contrast components, the r1 and r2 are close or equivalent to the individual T1 and T2 components. Either way, appropriate algorithms are needed to best differentiate bona fide signals from the background and artifacts. While interesting, further studies are needed evaluate the benefits of the dual-mode imaging approach in more clinically relevant models.
Conclusion
In summary, the past decade has witnessed fast progress in the development of novel MRI probes, many of which are made of NPs. While the initial efforts focused more on synthesizing NPs of different sizes, shapes, and compositions, there is a growing interest in tuning the surface properties of NPs to achieve high contrast abilities. These endeavors have established an arsenal of nanomaterials with different physiochemical properties, and have improved our understanding of particle-accelerated relaxation in different magnetic fields. It is now possible to employ this knowledge to construct MRI agents with superior r1 or r2 relaxivities or multi-modality/parameter contrast abilities. Meanwhile, it should be kept in mind that high relaxivities are not the only measure that matters. For instance, it is crucial to systematically assess the toxicity, biodegradability, and clearance of these contrast agents before clinical translation.
Acknowledgments
This work was supported by the Department of Defense (CDMRP grant CA140666), National Science Foundation (CAREER grant NSF1552617), and the National Institutes of Health (R01 grants R01EB022596 and R01NS093314). We also thank the support by National Natural Science Foundation of China (NSFC) projects (81271606, 81571708, and 81501506) and the Norman Bethune Program of Jilin University (2015219).
Abbreviations
- MRI
magnetic resonance imaging
- NP
nanoparticle
- IONP
iron oxide nanoparticle
- Gd
gadolinium
- MAR
motional averaging regime
- SDR
static dephasing regime
- ELR
echo-limited region
- SMR
slow-motion regime
- MSN
mesoporous silica nanoparticle
- CaP
calcium phosphate
- PLA
poly(lactide)
- NMOF
nanoscale metal organic frameworks
- LDL
low density lipoprotein
- HDL
high density lipoprotein
- CCMV
Cowpea chlorotic mottle virus
- TMV
Tobacco mosaic virus
- PVP
pyrrolidone
- DFT
density functional theory
- GO
graphene oxide
- RGD
arginine-glycine-aspartic acid
- c(RGDyK)
a cyclic derivative of RGD having a high affinity for αvβ integrin
- GNR
graphene nanoribbon
- BMV
Brome mosaic virus
- DTPA
diethylenetriaminepentaacetic acid
- DO3A
1,4,7-tris(carboxymethylaza) cyclododecane-10-azaacetylamide
- DOTA
tetraazacyclododecane-1,4,7,10-tetraacetic acid
- H8DOTP
1,4,7,10-tetrakis(methylenephosphonic acid)-1,4,7,10- tetraazacyclododecane
- DTTA
ethylenetriamine-N, N,N″,N″-tetraacetate
- PEG
polyethylene glycol
- DEG
diethylene glycol
- PAMAM
polyamidoamine
- PG
polyglycerol
- PEI
poly(ethylenimine)
- EA
esteramide
- PLL
poly-L-lysine
- PLGA
poly(D,L-lactide- co-glycolide)
- AAZTA
6-amino-6-methylperhydro-1, 4-diazepinetetraacetic acid
- HSA
human serum albumin
- BDC
1,4-benzenedicarboxylate
- BTC
benzene- 1,2,4-tricarboxylate
- iBTC
1,3,5-benzene-tricarboxylic acid
- DPDP
dipyridoxyl diphosphate
- EDTA
ethylenediaminetetraacetic acid
- BOM
benzyl-oxymethyl
- CTAB
cetyl trimethylammonium bromide
- ATPS
3-aminopropyltriethoxysilane
- ZDS
zwitterion dopamine sulfonate.
References
- 1.Na HB, Hyeon T. Nanostructured T1 MRI contrast agents. J Mater Chem. 1. Na HB, Hyeon T. Nanostructured T1 MRI contrast agents. J Mater Chem. 2009;19:6267. [Google Scholar]
- 2.Boros E, Gale EM, Caravan P. MR imaging probes: design and applications. Dalt Trans. 2015;44:4804–18. doi: 10.1039/c4dt02958e. [DOI] [PMC free article] [PubMed] [Google Scholar]
- 3.Gobbo OL, Sjaastad K, Radomski MW, Volkov Y, Prina-Mello A. Magnetic nanoparticles in cancer theranostics. Theranostics. 2015;5:1249–63. doi: 10.7150/thno.11544. [DOI] [PMC free article] [PubMed] [Google Scholar]
- 4.Partlow KC, Chen J, Brant JA, Neubauer AM, Meyerrose TE, Creer MH. et al. 19F magnetic resonance imaging for stem/progenitor cell tracking with multiple unique perfluorocarbon nanobeacons. FASEB J. 2007;21:1647–54. doi: 10.1096/fj.06-6505com. [DOI] [PubMed] [Google Scholar]
- 5.Soares JC, Boada F, Keshavan MS. Brain lithium measurements with 7Li magnetic resonance spectroscopy (MRS): a literature review. Eur Neuropsychopharmacol. 2000;10:151–8. doi: 10.1016/s0924-977x(00)00057-2. [DOI] [PubMed] [Google Scholar]
- 6.Ohliger MA, von Morze C, Marco-Rius I, Gordon J, Larson PEZ, Bok R. et al. Combining hyperpolarized 13C MRI with a liver-specific gadolinium contrast agent for selective assessment of hepatocyte metabolism. Magn Reson Med. 2016;0:1–8. doi: 10.1002/mrm.26296. [DOI] [PMC free article] [PubMed] [Google Scholar]
- 7.Rogers NJ, Hill-Casey F, Stupic KF, Six JS, Lesbats C, Rigby SP. et al. Molecular hydrogen and catalytic combustion in the production of hyperpolarized 83Kr and 129Xe MRI contrast agents. Proc Natl Acad Sci. 2016;113:3164–8. doi: 10.1073/pnas.1600379113. [DOI] [PMC free article] [PubMed] [Google Scholar]
- 8.Ruiz-Cabello J, Barnett BP, Bottomley PA, Bulte JWM. Fluorine (19F) MRS and MRI in biomedicine. NMR Biomed. 2011;24:114–29. doi: 10.1002/nbm.1570. [DOI] [PMC free article] [PubMed] [Google Scholar]
- 9.Davies G-L, Kramberger I, Davis JJ. Environmentally responsive MRI contrast agents. Chem Commun (Camb) 2013;49:9704–21. doi: 10.1039/c3cc44268c. [DOI] [PMC free article] [PubMed] [Google Scholar]
- 10.Stephen ZR, Kievit FM, Zhang M. Magnetite nanoparticles for medical MR imaging. Mater Today. 2011;14:330–8. doi: 10.1016/S1369-7021(11)70163-8. [DOI] [PMC free article] [PubMed] [Google Scholar]
- 11.Shin T, Choi J, Yun S, Kim I-S, Song H, Kim Y. et al. T1 and T2 Dual-Mode MRI Contrast Agent for Enhancing Accuracy by Engineered Nanomaterials. ACS Nano. 2014;8:3393–401. doi: 10.1021/nn405977t. [DOI] [PubMed] [Google Scholar]
- 12.Bui T, Stevenson J, Hoekman J, Zhang S, Maravilla K, Ho RJY. Novel Gd nanoparticles enhance vascular contrast for high-resolution magnetic resonance imaging. PLoS One. 2010;5:1–7. doi: 10.1371/journal.pone.0013082. [DOI] [PMC free article] [PubMed] [Google Scholar]
- 13.Liu J, Bu J, Bu W, Zhang S, Pan L, Fan W. et al. Real-time in vivo quantitative monitoring of drug release by dual-mode magnetic resonance and upconverted luminescence imaging. Angew Chem Int Ed Engl. 2014;53:4551–5. doi: 10.1002/anie.201400900. [DOI] [PubMed] [Google Scholar]
- 14.Nedyalkova M, Donkova B, Romanova J, Tzvetkov G, Madurga S, Simeonov V. Iron oxide nanoparticles - in vivo/in vitro biomedical applications and in silico studies. Adv Colloid Interface Sci. 2017;249:192–212. doi: 10.1016/j.cis.2017.05.003. [DOI] [PubMed] [Google Scholar]
- 15.Li L, Jiang W, Luo K, Song H, Lan F, Wu Y. et al. Superparamagnetic iron oxide nanoparticles as MRI contrast agents for non-invasive stem cell labeling and tracking. Theranostics. 2013;3:595–615. doi: 10.7150/thno.5366. [DOI] [PMC free article] [PubMed] [Google Scholar]
- 16.Janib SM, Moses AS, MacKay JA. Imaging and drug delivery using theranostic nanoparticles. Adv Drug Deliv Rev. 2010;62:1052–63. doi: 10.1016/j.addr.2010.08.004. [DOI] [PMC free article] [PubMed] [Google Scholar]
- 17.Mao X, Xu J, Cui H. Functional nanoparticles for magnetic resonance imaging. Wiley Interdiscip Rev Nanomedicine Nanobiotechnology. 2016;8:814–41. doi: 10.1002/wnan.1400. [DOI] [PMC free article] [PubMed] [Google Scholar]
- 18.Botta M, Tei L. Relaxivity enhancement in macromolecular and nanosized Gd III-based MRI contrast agents. Eur J Inorg Chem; 2012. pp. 1945–60. [Google Scholar]
- 19.Xie J, Jon S. Magnetic nanoparticle-based theranostics. Theranostics. 2012;2:122–4. doi: 10.7150/thno.4051. [DOI] [PMC free article] [PubMed] [Google Scholar]
- 20.Shao H, Min C, Issadore D, Liong M, Yoon TJ, Weissleder R. et al. Magnetic nanoparticles and micronmr for diagnostic applications. Theranostics. 2012;2:55–65. doi: 10.7150/thno.3465. [DOI] [PMC free article] [PubMed] [Google Scholar]
- 21.Angelovski G. What We Can Really Do with Bioresponsive MRI Contrast Agents. Angew Chemie - Int Ed. 2016;55:7038–46. doi: 10.1002/anie.201510956. [DOI] [PubMed] [Google Scholar]
- 22.Boesen L. Multiparametric MRI in detection and staging of prostate cancer. Danish Med Bull; 2017. p. 64. [PubMed] [Google Scholar]
- 23.Hegde JV, Mulkern RV, Panych LP, Fennessy FM, Fedorov A, Maier SE. et al. Multiparametric MRI of prostate cancer: An update on state-of-the-art techniques and their performance in detecting and localizing prostate cancer. J Magn Reson Imaging. 2013;37:1035–54. doi: 10.1002/jmri.23860. [DOI] [PMC free article] [PubMed] [Google Scholar]
- 24.Delongchamps NB, Rouanne M, Flam T, Beuvon F, Liberatore M, Zerbib M. et al. Multiparametric magnetic resonance imaging for the detection and localization of prostate cancer: Combination of T2-weighted, dynamic contrast-enhanced and diffusion-weighted imaging. BJU Int. 2011;107:1411–8. doi: 10.1111/j.1464-410X.2010.09808.x. [DOI] [PubMed] [Google Scholar]
- 25.Kurhanewicz J, Vigneron D, Carroll P, Coakley F. Multiparametric magnetic resonance imaging in prostate cancer: present and future. Curr Opin Urol. 2008;18:71–7. doi: 10.1097/MOU.0b013e3282f19d01. [DOI] [PMC free article] [PubMed] [Google Scholar]
- 26.Ghai S, Haider MA. Multiparametric-MRI in diagnosis of prostate cancer. Indian J Urol. 2015;31:194–201. doi: 10.4103/0970-1591.159606. [DOI] [PMC free article] [PubMed] [Google Scholar]
- 27.Wu L, Wen X, Wang X, Wang C, Sun X, Wang K. et al. Local Intratracheal Delivery of Perfluorocarbon Nanoparticles to Lung Cancer Demonstrated with Magnetic Resonance Multimodal Imaging. Theranostics. 2018;8:563–74. doi: 10.7150/thno.21466. [DOI] [PMC free article] [PubMed] [Google Scholar]
- 28.Zamboglou C, Drendel V, Jilg CA, Rischke HC, Beck TI, Schultze-Seemann W. et al. Comparison of 68Ga-HBED-CC PSMA-PET/CT and multiparametric MRI for gross tumour volume detection in patients with primary prostate cancer based on slice by slice comparison with histopathology. Theranostics. 2017;7:228–37. doi: 10.7150/thno.16638. [DOI] [PMC free article] [PubMed] [Google Scholar]
- 29.Boles MA, Ling D, Hyeon T, Talapin DV. Erratum: The surface science of nanocrystals. Nat Mater. 2016;15:364–364. doi: 10.1038/nmat4578. [DOI] [PubMed] [Google Scholar]
- 30.Ling D, Hackett MJ, Hyeon T. Surface ligands in synthesis, modification, assembly and biomedical applications of nanoparticles. Nano Today. 2014;9:457–77. [Google Scholar]
- 31.Zeng J, Jing L, Hou Y, Jiao M, Qiao R, Jia Q. et al. Anchoring group effects of surface ligands on magnetic properties of Fe3O4 nanoparticles: towards high performance MRI contrast agents. Adv Mater. 2014;26:2694–8. doi: 10.1002/adma.201304744. [DOI] [PubMed] [Google Scholar]
- 32.Sattler KD. Handbook of Nanophysics: Nanomedicine and Nanorobotics. 2010.
- 33.Caravan P, Farrar CT, Frullano L, Uppal R. Influence of molecular parameters and increasing magnetic field strength on relaxivity of gadolinium- and manganese-based T1 contrast agents. Contrast Media Mol Imaging. 2009;4:89–100. doi: 10.1002/cmmi.267. [DOI] [PMC free article] [PubMed] [Google Scholar]
- 34.Jacques V, Dumas S, Sun W-C, Troughton JS, Greenfield MT, Caravan P. High-relaxivity magnetic resonance imaging contrast agents. Part 2. Optimization of inner- and second-sphere relaxivity. Invest Radiol. 2010;45:613–24. doi: 10.1097/RLI.0b013e3181ee6a49. [DOI] [PMC free article] [PubMed] [Google Scholar]
- 35.Chen JW, Belford RL, Clarkson RB. Second-Sphere and Outer-Sphere Proton Relaxation of Paramagnetic Complexes: From EPR to NMRD. J Phys Chem A. 1998;102:2117–30. [Google Scholar]
- 36.Runge VM. Notes on “Characteristics of Gadolinium-DTPA Complex: A Potential NMR Contrast Agent.” Am J Roentgenol. 2008;190:1433-4. [DOI] [PubMed]
- 37.Bertin A, Steibel J, Michou-Gallani AI, Gallani JL, Felder-Flesch D. Development of a dendritic manganese-enhanced magnetic resonance imaging (MEMRI) contrast agent: Synthesis, toxicity (in Vitro) and relaxivity (in Vitro, in Vivo) studies. Bioconjug Chem. 2009;20:760–7. doi: 10.1021/bc8004683. [DOI] [PubMed] [Google Scholar]
- 38.Fang J, Chandrasekharan P, Liu XL, Yang Y, Lv YB, Yang CT. et al. Manipulating the surface coating of ultra-small Gd2O3 nanoparticles for improved T1-weighted MR imaging. Biomaterials. 2014;35:1636–42. doi: 10.1016/j.biomaterials.2013.11.032. [DOI] [PubMed] [Google Scholar]
- 39.Li F, Zhi D, Luo Y, Zhang J, Nan X, Zhang Y. et al. Core/shell Fe3O4 /Gd2O3 nanocubes as T1-T2 dual modal MRI contrast agents. Nanoscale. 2016;8:12826–33. doi: 10.1039/c6nr02620f. [DOI] [PubMed] [Google Scholar]
- 40.Powell DH, Ni Dhubhghaill OM, Pubanz D, Helm L, Lebedev YS, Schlaepfer W. et al. Structural and dynamic parameters obtained from 17O NMR, EPR, and NMRD studies of monomeric and dimeric Gd3+ complexes of interest in magnetic resonance imaging: An integrated and theoretically self-consistent approach. J Am Chem Soc. 1996;118:9333–46. [Google Scholar]
- 41.Dumas S, Jacques V, Sun W-C, Troughton JS, Welch JT, Chasse JM. et al. High relaxivity magnetic resonance imaging contrast agents. Part 1. Impact of single donor atom substitution on relaxivity of serum albumin-bound gadolinium complexes. Invest Radiol. 2010;45:600–12. doi: 10.1097/RLI.0b013e3181ee5a9e. [DOI] [PMC free article] [PubMed] [Google Scholar]
- 42.Andrec M, Montelione GT, Levy RM. Estimation of dynamic parameters from NMR relaxation data using the Lipari-Szabo model-free approach and Bayesian statistical methods. J Magn Reson. 1999;139:408–21. doi: 10.1006/jmre.1999.1839. [DOI] [PubMed] [Google Scholar]
- 43.Caravan P. Strategies for increasing the sensitivity of gadolinium based MRI contrast agents. Chem Soc Rev. 2006;35:512–23. doi: 10.1039/b510982p. [DOI] [PubMed] [Google Scholar]
- 44.Ni D, Zhang J, Bu W, Zhang C, Yao Z, Xing H. et al. PEGylated NaHoF4 nanoparticles as contrast agents for both X-ray computed tomography and ultra-high field magnetic resonance imaging. Biomaterials. 2016;76:218–25. doi: 10.1016/j.biomaterials.2015.10.063. [DOI] [PubMed] [Google Scholar]
- 45.Jaccard H. Development and Understanding of Novel Compounds Designed as Potential MRI Contrast Agents. École polytechnique fédérale de Lausanne, Suisse; 2011. [Google Scholar]
- 46.Peng E, Wang F, Xue JM. Nanostructured magnetic nanocomposites as MRI contrast agents. J Mater Chem B. 2015;3:2241–76. doi: 10.1039/c4tb02023e. [DOI] [PubMed] [Google Scholar]
- 47.Zhao Z, Zhou Z, Bao J, Wang Z, Hu J, Chi X. et al. Octapod iron oxide nanoparticles as high-performance T₂ contrast agents for magnetic resonance imaging. Nat Commun. 2013;4:2266. doi: 10.1038/ncomms3266. [DOI] [PubMed] [Google Scholar]
- 48.Koenig SH, Kellar KE. Theory of 1/T1 and 1/T2 NMRD profiles of solutions of magnetic nanoparticles. Magn Reson Med. 1995;34:227–33. doi: 10.1002/mrm.1910340214. [DOI] [PubMed] [Google Scholar]
- 49.Huang J, Zhong X, Wang L, Yang L, Mao H. Improving the magnetic resonance imaging contrast and detection methods with engineered magnetic nanoparticles. Theranostics. 2012;2:86–102. doi: 10.7150/thno.4006. [DOI] [PMC free article] [PubMed] [Google Scholar]
- 50.Noh SH, Na W, Jang JT, Lee JH, Lee EJ, Moon SH. et al. Nanoscale. magnetism control via surface and exchange anisotropy for optimized ferrimagnetic hysteresis. Nano Lett. 2012;12:3716–21. doi: 10.1021/nl301499u. [DOI] [PubMed] [Google Scholar]
- 51.Lu AH, Salabas EL, Schüth F. Magnetic nanoparticles: Synthesis, protection, functionalization, and application. Angew Chemie - Int Ed. 2007;46:1222–44. doi: 10.1002/anie.200602866. [DOI] [PubMed] [Google Scholar]
- 52.Morales MP, Serna CJ, Bødker F, Mørup S. Spin canting due to structural disorder in maghemite. J Phys Condens Matter. 1999;9:5461–7. [Google Scholar]
- 53.Morales MP, Veintemillas-Verdaguer S, Montero MI, Serna CJ, Roig A, Casas L. et al. Surface and Internal Spin Canting in γ-Fe2O3 Nanoparticles. Chem Mater. 1999;11:3058–64. [Google Scholar]
- 54.Duan H, Kuang M, Wang X, Wang YA, Mao H, Nie S. Reexamining the effects of particle size and surface chemistry on the magnetic properties of iron oxide nanocrystals: New insights into spin disorder and proton relaxivity. J Phys Chem C. 2008;112:8127–31. [Google Scholar]
- 55.Jun Y-W, Huh Y-M, Choi J-S, Lee J-H, Song H-T, Kim S. et al. Nanoscale size effect of magnetic nanocrystals and their utilization for cancer diagnosis via magnetic resonance imaging. J Am Chem Soc. 2005;127:5732–3. doi: 10.1021/ja0422155. [DOI] [PubMed] [Google Scholar]
- 56.Muller R, Hergt R, Dutz S, Zeisberger M, Gawalek W. Nanocrystalline iron oxide and Ba ferrite particles in the superparamagnetism-ferromagnetism transition range with ferrofluid applications. J Physics-Condensed Matter. 2006;18:S2527–42. [Google Scholar]
- 57.Tromsdorf UI, Bigall NC, Kaul MG, Bruns OT, Nikolic MS, Mollwitz B. et al. Size and surface effects on the MRI relaxivity of manganese ferrite nanoparticle contrast agents. Nano Lett. 2007;7:2422–7. doi: 10.1021/nl071099b. [DOI] [PubMed] [Google Scholar]
- 58.Sperling RA, Parak WJ. Surface modification, functionalization and bioconjugation of colloidal inorganic nanoparticles. Philos Trans R Soc A Math Phys Eng Sci. 2010;368:1333–83. doi: 10.1098/rsta.2009.0273. [DOI] [PubMed] [Google Scholar]
- 59.Wu W, He Q, Jiang C. Magnetic iron oxide nanoparticles: Synthesis and surface functionalization strategies. Nanoscale Res Lett. 2008;3:397–415. doi: 10.1007/s11671-008-9174-9. [DOI] [PMC free article] [PubMed] [Google Scholar]
- 60.Tong S, Hou S, Zheng Z, Zhou J, Bao G. Coating Optimization of Superparamagnetic Iron Oxide Nanoparticles for High T2 Relaxivity. Nano Lett. 2010;10:4607–13. doi: 10.1021/nl102623x. [DOI] [PMC free article] [PubMed] [Google Scholar]
- 61.Hu F, MacRenaris KW, Waters EA, Liang T, Schultz-Sikma EA, Eckermann AL. et al. Ultrasmall, water-soluble magnetite nanoparticles with high relaxivity for magnetic resonance imaging. J Phys Chem C. 2009;113:20855–60. doi: 10.1021/jp907216g. [DOI] [PMC free article] [PubMed] [Google Scholar]
- 62.Ling D, Lee N, Hyeon T. Chemical synthesis and assembly of uniformly sized iron oxide nanoparticles for medical applications. Acc Chem Res. 2015;48:1276–85. doi: 10.1021/acs.accounts.5b00038. [DOI] [PubMed] [Google Scholar]
- 63.Barrow M, Taylor A, Murray P, Rosseinsky MJ, Adams DJ. Design considerations for the synthesis of polymer coated iron oxide nanoparticles for stem cell labelling and tracking using MRI. Chem Soc Rev. 2015;44:6733–48. doi: 10.1039/c5cs00331h. [DOI] [PubMed] [Google Scholar]
- 64.Wang Y, Gu H. Core-shell-type magnetic mesoporous silica nanocomposites for bioimaging and therapeutic agent delivery. Adv Mater. 2015;27:576–85. doi: 10.1002/adma.201401124. [DOI] [PubMed] [Google Scholar]
- 65.Hayashi K, Nakamura M, Sakamoto W, Yogo T, Miki H, Ozaki S. et al. Superparamagnetic nanoparticle clusters for cancer theranostics combining magnetic resonance imaging and hyperthermia treatment. Theranostics. 2013;3:366–76. doi: 10.7150/thno.5860. [DOI] [PMC free article] [PubMed] [Google Scholar]
- 66.Carr D, Brown J, Bydder G, Steiner R, Weinmann H, Speck U. et al. Gadolinium-DTPA as a contrast agent in MRI: initial clinical experience in 20 patients. Am J Roentgenol. 1984;143:215–24. doi: 10.2214/ajr.143.2.215. [DOI] [PubMed] [Google Scholar]
- 67.Filippousi M, Angelakeris M, Katsikini M, Paloura E, Efthimiopoulos I, Wang Y. et al. Surfactant Effects on the Structural and Magnetic Properties of Iron Oxide Nanoparticles. J Phys Chem C. 2014;118:16209–17. [Google Scholar]
- 68.Sharifi S, Seyednejad H, Laurent S, Atyabi F, Saei AA, Mahmoudi M. Superparamagnetic iron oxide nanoparticles for in vivo molecular and cellular imaging. Contrast Media Mol Imaging. 2015;10:329–55. doi: 10.1002/cmmi.1638. [DOI] [PubMed] [Google Scholar]
- 69.Neuwelt A, Sidhu N, Hu C-AA, Mlady G, Eberhardt SC, Sillerud LO. Iron-Based Superparamagnetic Nanoparticle Contrast Agents for MRI of Infection and Inflammation. Am J Roentgenol. 2015;204:W302–13. doi: 10.2214/AJR.14.12733. [DOI] [PMC free article] [PubMed] [Google Scholar]
- 70.Jafari A, Salouti M, Shayesteh SF, Heidari Z, Rajabi AB, Boustani K. et al. Synthesis and characterization of Bombesin-superparamagnetic iron oxide nanoparticles as a targeted contrast agent for imaging of breast cancer using MRI. Nanotechnology. 2015;26:75101. doi: 10.1088/0957-4484/26/7/075101. [DOI] [PubMed] [Google Scholar]
- 71.Tse BW-C, Cowin GJ, Soekmadji C, Jovanovic L, Vasireddy RS, Ling M-T. et al. PSMA-targeting iron oxide magnetic nanoparticles enhance MRI of preclinical prostate cancer. Nanomedicine (Lond) 2014;10:1–12. doi: 10.2217/nnm.14.122. [DOI] [PubMed] [Google Scholar]
- 72.Koyner JL, Vaidya VS, Bennett MR, Ma Q, Worcester E, Akhter S a. et al. Urinary biomarkers in the clinical prognosis and early detection of acute kidney injury. Clin J Am Soc Nephrol. 2010;5:2154–65. doi: 10.2215/CJN.00740110. [DOI] [PMC free article] [PubMed] [Google Scholar]
- 73.Zhou Z, Lu Z-R. Gadolinium-based contrast agents for magnetic resonance cancer imaging. Wiley Interdiscip Rev Nanomedicine Nanobiotechnology. 2013;5:1–18. doi: 10.1002/wnan.1198. [DOI] [PMC free article] [PubMed] [Google Scholar]
- 74.Aime S, Caravan P. Biodistribution of gadolinium-based contrast agents, including gadolinium deposition. J Magn Reson Imaging. 2009;30:1259–67. doi: 10.1002/jmri.21969. [DOI] [PMC free article] [PubMed] [Google Scholar]
- 75.Mohs AM, Nguyen T, Jeong EK, Feng Y, Emerson L, Zong Y. et al. Modification of Gd-DTPA cystine copolymers with PEG-1000 optimizes pharmacokinetics and tissue retention for magnetic resonance angiography. Magn Reson Med. 2007;58:110–8. doi: 10.1002/mrm.21270. [DOI] [PubMed] [Google Scholar]
- 76.Mohs AM, Zong Y, Guo J, Parker DL, Lu ZR. PEG-g-poly(GdDTPA-co-L-cystine): Effect of PEG chain length on in vivo contrast enhancement in MRI. Biomacromolecules. 2005;6:2305–11. doi: 10.1021/bm050194g. [DOI] [PubMed] [Google Scholar]
- 77.Li Y, Beija M, Laurent S, Elst L Vander, Muller RN, Duong HTT. et al. Macromolecular ligands for gadolinium MRI contrast agents. Macromolecules. 2012;45:4196–204. [Google Scholar]
- 78.Aaron AJ, Bumb A, Brechbiel MW. Macromolecules, dendrimers, and nanomaterials in magnetic resonance imaging: The interplay between size, function, and pharmacokinetics. Chem Rev. 2010;110:2921–59. doi: 10.1021/cr900232t. [DOI] [PMC free article] [PubMed] [Google Scholar]
- 79.Laus S, Sour A, Ruloff R, Tóth É, Merhach AE. Rotational dynamics account for pH-De pendent relaxivities of PAMAM dendrimeric, Gd-based potential MRI contrast agents. Chem - A Eur J. 2005;11:3064–76. doi: 10.1002/chem.200401326. [DOI] [PubMed] [Google Scholar]
- 80.Kukowska-Latallo J. Targeted gadolinium-loaded dendrimer nanoparticles for tumor-specific magnetic resonance contrast enhancement. Int J Nanomedicine. 2008;3:201. [PMC free article] [PubMed] [Google Scholar]
- 81.Kojima C, Turkbey B, Ogawa M, Bernardo M, Regino CAS, Bryant LH. et al. Dendrimer-based MRI contrast agents: the effects of PEGylation on relaxivity and pharmacokinetics. Nanomedicine Nanotechnology Biol Med. 2011;7:1001–8. doi: 10.1016/j.nano.2011.03.007. [DOI] [PMC free article] [PubMed] [Google Scholar]
- 82.Jászberényi Z, Moriggi L, Schmidt P, Weidensteiner C, Kneuer R, Merbach AE. et al. Physicochemical and MRI characterization of Gd3+-loaded polyamidoamine and hyperbranched dendrimers. J Biol Inorg Chem. 2007;12:406–20. doi: 10.1007/s00775-006-0197-3. [DOI] [PubMed] [Google Scholar]
- 83.Floyd WC, Klemm PJ, Smiles DE, Kohlgruber AC, Pierre VC, Mynar JL. et al. Conjugation effects of various linkers on Gd(III) MRI contrast agents with Dendrimers: Optimizing the Hydroxypyridinonate (HOPO) Ligands with Nontoxic, Degradable Esteramide (EA) dendrimers for high relaxivity. J Am Chem Soc. 2011;133:2390–3. doi: 10.1021/ja110582e. [DOI] [PMC free article] [PubMed] [Google Scholar]
- 84.Kamaly N, Kalber T, Ahmad A, Oliver MH, So PW, Herlihy AH. et al. Bimodal paramagnetic and fluorescent liposomes for cellular and tumor magnetic resonance imaging. Bioconjug Chem. 2008;19:118–29. doi: 10.1021/bc7001715. [DOI] [PubMed] [Google Scholar]
- 85.Ghaghada KB, Ravoori M, Sabapathy D, Bankson J, Kundra V, Annapragada A. New Dual Mode Gadolinium Nanoparticle Contrast Agent for Magnetic Resonance Imaging. PLoS One. 2009;4:e7628. doi: 10.1371/journal.pone.0007628. [DOI] [PMC free article] [PubMed] [Google Scholar]
- 86.Silva SR, Duarte ÉC, Ramos GS, Kock FVC, Andrade FD, Frézard F. et al. Gadolinium(III) Complexes with N-Alkyl-N-methylglucamine Surfactants Incorporated into Liposomes as Potential MRI Contrast Agents. Bioinorg Chem Appl. 2015;2015:1–8. doi: 10.1155/2015/942147. [DOI] [PMC free article] [PubMed] [Google Scholar]
- 87.Kielar F, Tei L, Terreno E, Botta M. Large relaxivity enhancement of paramagnetic lipid nanoparticles by restricting the local motions of the GdIII chelates. J Am Chem Soc. 2010;132:7836–7. doi: 10.1021/ja101518v. [DOI] [PubMed] [Google Scholar]
- 88.Ratzinger G, Agrawal P, Körner W, Lonkai J, Sanders HMHF, Terreno E. et al. Surface modification of PLGA nanospheres with Gd-DTPA and Gd-DOTA for high-relaxivity MRI contrast agents. Biomaterials. 2010;31:8716–23. doi: 10.1016/j.biomaterials.2010.07.095. [DOI] [PubMed] [Google Scholar]
- 89.Moriggi L, Cannizzo C, Dumas E, Mayer CR, Ulianov A, Helm L. Gold Nanoparticles Functionalized with Gadolinium Chelates as High Relaxivity MRI Contrast Agents. SI. J Am Chem Soc; 2009. pp. 1–6. [DOI] [PubMed] [Google Scholar]
- 90.Irure A, Marradi M, Arnaiz B, Genicio N, Padro D, Penades S. Sugar/gadolinium-loaded gold nanoparticles for labelling and imaging cells by magnetic resonance imaging. Biomater Sci. 2013;1:658–68. doi: 10.1039/c3bm60032g. [DOI] [PubMed] [Google Scholar]
- 91.Li M, Li L, Zhan C, Kohane DS. Core-shell nanostars for multimodal therapy and imaging. Theranostics. 2016;6:2306–13. doi: 10.7150/thno.15843. [DOI] [PMC free article] [PubMed] [Google Scholar]
- 92.Liu R, Jing L, Peng D, Li Y, Tian J, Dai Z. Manganese (II) chelate functionalized copper sulfide nanoparticles for efficient magnetic resonance/photoacoustic dual-modal imaging guided photothermal therapy. Theranostics. 2015;5:1144–53. doi: 10.7150/thno.11754. [DOI] [PMC free article] [PubMed] [Google Scholar]
- 93.Ren L, Chen S, Li H, Zhang Z, Ye C, Liu M. et al. MRI-visible liposome nanovehicles for potential tumor-targeted delivery of multimodal therapies. Nanoscale. 2015;7:12843–50. doi: 10.1039/c5nr02144h. [DOI] [PubMed] [Google Scholar]
- 94.Lin W, Vivero-Escoto JL, Taylor-Pashow KML, Huxford RC, Della Rocca J, Okoruwa C. et al. Multifunctional mesoporous silica nanospheres with cleavable Gd(III) chelates as MRI contrast agents: Synthesis, characterization, target-specificity, and renal clearance. Small. 2011;7:3519–28. doi: 10.1002/smll.201100521. [DOI] [PMC free article] [PubMed] [Google Scholar]
- 95.Hurley KR, Lin YS, Zhang J, Egger SM, Haynes CL. Effects of mesoporous silica coating and postsynthetic treatment on the transverse relaxivity of iron oxide nanoparticles. Chem Mater. 2013;25:1968–78. doi: 10.1021/cm400711h. [DOI] [PMC free article] [PubMed] [Google Scholar]
- 96.Kotb S, Detappe A, Lux F, Appaix F, Barbier EL, Tran VL. et al. Gadolinium-based nanoparticles and radiation therapy for multiple brain melanoma metastases: Proof of concept before phase I trial. Theranostics. 2016;6:418–27. doi: 10.7150/thno.14018. [DOI] [PMC free article] [PubMed] [Google Scholar]
- 97.Mi P, Kokuryo D, Cabral H, Kumagai M, Nomoto T, Aoki I. et al. Hydrothermally synthesized PEGylated calcium phosphate nanoparticles incorporating Gd-DTPA for contrast enhanced MRI diagnosis of solid tumors. J Control Release. 2014;174:63–71. doi: 10.1016/j.jconrel.2013.10.038. [DOI] [PubMed] [Google Scholar]
- 98.Mi P, Dewi N, Yanagie H, Kokuryo D, Suzuki M, Sakurai Y. et al. Hybrid Calcium Phosphate-Polymeric Micelles Incorporating Gadolinium Chelates for Imaging-Guided Gadolinium Neutron Capture Tumor Therapy. ACS Nano. 2015;9:5913–21. doi: 10.1021/acsnano.5b00532. [DOI] [PubMed] [Google Scholar]
- 99.Mi P, Kokuryo D, Cabral H, Wu H, Terada Y, Saga T. et al. A pH-activatable nanoparticle with signal-amplification capabilities for non-invasive imaging of tumour malignancy. Nat Nanotechnol. 2016;11:724–30. doi: 10.1038/nnano.2016.72. [DOI] [PubMed] [Google Scholar]
- 100.Chen F, Huang P, Zhu YJ, Wu J, Cui DX. Multifunctional Eu3+/Gd3+ dual-doped calcium phosphate vesicle-like nanospheres for sustained drug release and imaging. Biomaterials. 2012;33:6447–55. doi: 10.1016/j.biomaterials.2012.05.059. [DOI] [PubMed] [Google Scholar]
- 101.Yang W, Guo W, Gong X, Zhang B, Wang S, Chen N. et al. Facile Synthesis of Gd-Cu-In-S/ZnS Bimodal Quantum Dots with Optimized Properties for Tumor Targeted Fluorescence/MR in Vivo Imaging. ACS Appl Mater Interfaces. 2015;7:18759–68. doi: 10.1021/acsami.5b05372. [DOI] [PubMed] [Google Scholar]
- 102.Tu C, Ma X, Pantazis P, Kauzlarich SM, Louie AY. Paramagnetic, silicon quantum dots for magnetic resonance and two-photon imaging of macrophages. J Am Chem Soc. 2010;132:2016–23. doi: 10.1021/ja909303g. [DOI] [PMC free article] [PubMed] [Google Scholar]
- 103.Della Rocca J, Liu D, Lin W. Nanoscale metal-organic frameworks for biomedical imaging and drug delivery. Acc Chem Res. 2011;44:957–68. doi: 10.1021/ar200028a. [DOI] [PMC free article] [PubMed] [Google Scholar]
- 104.Rieter WJ, Taylor KML, An H, Lin W, Lin W. Nanoscale metal-organic frameworks as potential multimodal contrast enhancing agents. J Am Chem Soc. 2006;128:9024–5. doi: 10.1021/ja0627444. [DOI] [PMC free article] [PubMed] [Google Scholar]
- 105.Taylor KML, Rieter WJ, Lin W. Manganese-Based Nanoscale Metal-Organic Frameworks for Magnetic Resonance Imaging. J Am Chem Soc. 2008;130:14358–9. doi: 10.1021/ja803777x. [DOI] [PubMed] [Google Scholar]
- 106.Thaxton CS, Rink JS, Naha PC, Cormode DP. Lipoproteins and lipoprotein mimetics for imaging and drug delivery. Adv Drug Deliv Rev. 2016;106:116–31. doi: 10.1016/j.addr.2016.04.020. [DOI] [PMC free article] [PubMed] [Google Scholar]
- 107.Corbin IR, Li H, Chen J, Lund-Katz S, Zhou R, Glickson JD. et al. Low-density lipoprotein nanoparticles as magnetic resonance imaging contrast agents. Neoplasia. 2006;8:488–98. doi: 10.1593/neo.05835. [DOI] [PMC free article] [PubMed] [Google Scholar]
- 108.Delli Castelli D, Gianolio E, Geninatti Crich S, Terreno E, Aime S. Metal containing nanosized systems for MR-Molecular Imaging applications. Coord Chem Rev. 2008;252:2424–43. [Google Scholar]
- 109.Frias JC, Williams KJ, Fisher EA, Fayad ZA. Recombinant HDL-like nanoparticles: A specific contrast agent for MRI of atherosclerotic plaques. J Am Chem Soc. 2004;126:16316–7. doi: 10.1021/ja044911a. [DOI] [PubMed] [Google Scholar]
- 110.Vitaliano GD, Vitaliano F, Rios JD, Renshaw PF, Teicher MH. New Clathrin-Based Nanoplatforms for Magnetic Resonance Imaging. PLoS One. 2012;7:e35821. doi: 10.1371/journal.pone.0035821. [DOI] [PMC free article] [PubMed] [Google Scholar]
- 111.Shukla S, Steinmetz NF. Virus-based nanomaterials as positron emission tomography and magnetic resonance contrast agents: from technology development to translational medicine. Wiley Interdiscip Rev Nanomedicine Nanobiotechnology. 2015;7:708–21. doi: 10.1002/wnan.1335. [DOI] [PMC free article] [PubMed] [Google Scholar]
- 112.Liepold L, Anderson S, Willits D, Oltrogge L, Frank JA, Douglas T. et al. Viral capsids as MRI contrast agents. Magn Reson Med. 2007;58:871–9. doi: 10.1002/mrm.21307. [DOI] [PubMed] [Google Scholar]
- 113.Bruckman M a, Hern S, Jiang K, Flask C a, Yu X, Steinmetz NF. Tobacco mosaic virus rods and spheres as supramolecular high-relaxivity MRI contrast agents. J Mater Chem B Mater Biol Med. 2013;1:1482–90. doi: 10.1039/C3TB00461A. [DOI] [PMC free article] [PubMed] [Google Scholar]
- 114.Hooker JM, Datta A, Botta M, Raymond KN, Francis MB. Magnetic resonance contrast agents from viral capsid shells: A comparison of exterior and interior cargo strategies. Nano Lett. 2007;7:2207–10. doi: 10.1021/nl070512c. [DOI] [PubMed] [Google Scholar]
- 115.Datta A, Hooker JM, Botta M, Francis MB, Aime S, Raymond KN. High relaxivity gadolinium hydroxypyridonate-viral capsid conjugates: Nanosized MRI contrast agents. J Am Chem Soc. 2008;130:2546–52. doi: 10.1021/ja0765363. [DOI] [PubMed] [Google Scholar]
- 116.Viswanathan S, Kovacs Z, Green KN, Ratnakar SJ, Sherry AD. Alternatives to gadolinium-based metal chelates for magnetic resonance imaging. Chem Rev. 2010;110:2960–3018. doi: 10.1021/cr900284a. [DOI] [PMC free article] [PubMed] [Google Scholar]
- 117.Aime S, Frullano L, Crich SG. Compartmentalization of a gadolinium complex in the apoferritin cavity: A route to obtain high relaxivity contrast agents for magnetic resonance imaging. Angew Chemie - Int Ed. 2002;41:1017–9. doi: 10.1002/1521-3773(20020315)41:6<1017::aid-anie1017>3.0.co;2-p. [DOI] [PubMed] [Google Scholar]
- 118.Crich SG, Bussolati B, Tei L, Grange C, Esposito G, Lanzardo S. et al. Magnetic resonance visualization of tumor angiogenesis by targeting neural cell adhesion molecules with the highly sensitive gadolinium-loaded apoferritin probe. Cancer Res. 2006;66:9196–201. doi: 10.1158/0008-5472.CAN-06-1728. [DOI] [PubMed] [Google Scholar]
- 119.Li S, Jiang J, Zou J, Qiao J, Xue S, Wei L. et al. PEGylation of protein-based MRI contrast agents improves relaxivities and biocompatibilities. J Inorg Biochem. 2012;107:111–8. doi: 10.1016/j.jinorgbio.2011.11.004. [DOI] [PMC free article] [PubMed] [Google Scholar]
- 120.Yang JJ, Yang J, Wei L, Zurkiya O, Yang W, Li S. et al. Rational Design of Protein-Based MRI Contrast Agents. J Am Chem Soc. 2008;130:9260–7. doi: 10.1021/ja800736h. [DOI] [PMC free article] [PubMed] [Google Scholar]
- 121.Xue S, Qiao J, Pu F, Cameron M, Yang JJ. Design of a novel class of protein-based magnetic resonance imaging contrast agents for the molecular imaging of cancer biomarkers. Wiley Interdiscip Rev Nanomedicine Nanobiotechnology. 2013;5:163–79. doi: 10.1002/wnan.1205. [DOI] [PMC free article] [PubMed] [Google Scholar]
- 122.Xue S, Yang H, Qiao J, Pu F, Jiang J, Hubbard K. et al. Protein MRI contrast agent with unprecedented metal selectivity and sensitivity for liver cancer imaging. Proc Natl Acad Sci. 2015;112:6607–12. doi: 10.1073/pnas.1423021112. [DOI] [PMC free article] [PubMed] [Google Scholar]
- 123.Caravan P, Cloutier NJ, Greenfield MT, McDermid SA, Dunham SU, Bulte JWM. et al. The Interaction of MS-325 with Human Serum Albumin and Its Effect on Proton Relaxation Rates. J Am Chem Soc. 2002;124:3152–62. doi: 10.1021/ja017168k. [DOI] [PubMed] [Google Scholar]
- 124.Zhang Z, Greenfield MT, Spiller M, McMurry TJ, Lauffer RB, Caravan P. Multilocus binding increases the relaxivity of protein-bound MRI contrast agents. Angew Chemie - Int Ed. 2005;44:6766–9. doi: 10.1002/anie.200502245. [DOI] [PubMed] [Google Scholar]
- 125.Zhang Z, Greenfield MT, Spiller M, McMurry TJ, Lauffer RB, Caravan P. Multilocus binding increases the relaxivity of protein-bound MRI contrast agents. Angew Chemie - Int Ed. 2005;44:6766–9. doi: 10.1002/anie.200502245. [DOI] [PubMed] [Google Scholar]
- 126.Helm PA, Caravan P, French BA, Jacques V, Shen LH, Xu YQ. et al. Postinfarction myocardial scarring in mice: Molecular MR imaging with use of a collagen-targeting contrast agent. Radiology. 2008;247:788–96. doi: 10.1148/radiol.2473070975. [DOI] [PMC free article] [PubMed] [Google Scholar]
- 127.Caravan P, Greenwood JM, Welch T, Franklin SJ. Gadolinium-binding helix - turn - helix peptides : DNA-dependent MRI contrast agents. Chem Commun. 2003;20:2574–5. doi: 10.1039/b307817e. [DOI] [PubMed] [Google Scholar]
- 128.Huang S, Chen HH, Yuan H, Dai G, Schuhle DT, Mekkaoui C. et al. Molecular MRI of acute necrosis with a novel DNA-binding gadolinium chelate kinetics of cell death and clearance in infarcted myocardium. Circ Cardiovasc Imaging. 2011;4:729–37. doi: 10.1161/CIRCIMAGING.111.966374. [DOI] [PMC free article] [PubMed] [Google Scholar]
- 129.Johnson NJJ, Oakden W, Stanisz GJ, Scott Prosser R, van Veggel FCJM. Size-Tunable, Ultrasmall NaGdF4 Nanoparticles: Insights into Their T 1 MRI Contrast Enhancement. Chem Mater. 2011;23:3714–22. [Google Scholar]
- 130.Bridot J-L, Faure AC, Laurent S, Riviere C, Billotey C, Hiba B. et al. Hybrid Gd oxide nanoparticle multimodal contrast agents for in vivo imaging. J Am Chem Soc. 2007;129:5076–84. doi: 10.1021/ja068356j. [DOI] [PubMed] [Google Scholar]
- 131.Park JY, Baek MJ, Choi ES, Woo S, Kim JH, Kim TJ. et al. Paramagnetic ultrasmall gadolinium oxide nanoparticles as advanced T1 MRI contrast agent: Account for large longitudinal relaxivity, optimal particle diameter, and in Vivo T1 MR images. ACS Nano. 2009;3:3663–9. doi: 10.1021/nn900761s. [DOI] [PubMed] [Google Scholar]
- 132.Faucher L, Gossuin Y, Hocq A, Fortin M-A. Impact of agglomeration on the relaxometric properties of paramagnetic ultra-small gadolinium oxide nanoparticles. Nanotechnology. 2011;22:295103. doi: 10.1088/0957-4484/22/29/295103. [DOI] [PubMed] [Google Scholar]
- 133.Wang Y, Yang T, Ke H, Zhu A, Wang Y, Wang J. et al. Smart Albumin-Biomineralized Nanocomposites for Multimodal Imaging and Photothermal Tumor Ablation. Adv Mater. 2015;27:3874–82. doi: 10.1002/adma.201500229. [DOI] [PubMed] [Google Scholar]
- 134.Ahmad MW, Xu W, Kim SJ, Baeck JS, Chang Y, Bae JE. et al. Potential dual imaging nanoparticle: Gd2O3 nanoparticle. Sci Rep. 2015;5:8549. doi: 10.1038/srep08549. [DOI] [PMC free article] [PubMed] [Google Scholar]
- 135.Bridot JL, Faure AC, Laurent S, Rivière C, Billotey C, Hiba B. et al. Hybrid gadolinium oxide nanoparticles: Multimodal contrast agents for in vivo imaging. J Am Chem Soc. 2007;129:5076–84. doi: 10.1021/ja068356j. [DOI] [PubMed] [Google Scholar]
- 136.Carniato F, Thangavel K, Tei L, Botta M. Structure and dynamics of the hydration shells of citrate-coated GdF3 nanoparticles. J Mater Chem B. 2013;1:2442. doi: 10.1039/c3tb20174k. [DOI] [PubMed] [Google Scholar]
- 137.Hifumi H, Yamaoka S, Tanimoto A, Citterio D, Suzuki K. Gadolinium-based hybrid nanoparticles as a positive MR contrast agent. J Am Chem Soc. 2006;128:15090–1. doi: 10.1021/ja066442d. [DOI] [PubMed] [Google Scholar]
- 138.Hou Y, Qiao R, Fang F, Wang X, Dong C, Liu K. et al. NaGdF4 nanoparticle-based molecular probes for magnetic resonance imaging of intraperitoneal tumor xenografts in vivo. ACS Nano. 2013;7:330–8. doi: 10.1021/nn304837c. [DOI] [PubMed] [Google Scholar]
- 139.Xing H, Zhang S, Bu W, Zheng X, Wang L, Xiao Q. et al. Ultrasmall NaGdF4 nanodots for efficient MR angiography and atherosclerotic plaque imaging. Adv Mater. 2014;26:3867–72. doi: 10.1002/adma.201305222. [DOI] [PubMed] [Google Scholar]
- 140.Huang S, Chen P, Xu C. Facile preparation of rare-earth based fluorescence/MRI dual-modal nanoprobe for targeted cancer cell imaging. Talanta. 2017;165:161–6. doi: 10.1016/j.talanta.2016.12.048. [DOI] [PubMed] [Google Scholar]
- 141.Zhen Z, Xie J. Development of manganese-based nanoparticles as contrast probes for magnetic resonance imaging. Theranostics. 2012;2:45–54. doi: 10.7150/thno.3448. [DOI] [PMC free article] [PubMed] [Google Scholar]
- 142.Hsu BYW, Kirby G, Tan A, Seifalian AM, Li X, Wang J. Relaxivity and toxicological properties of manganese oxide nanoparticles for MRI applications. RSC Adv. 2016;6:45462–74. doi: 10.1039/C6RA04421B. [DOI] [PMC free article] [PubMed] [Google Scholar]
- 143.Na H Bin, Lee JH, An K, Park Y Il, Park M, Lee IS. et al. Development of a T1 contrast agent for magnetic resonance imaging using MnO nanoparticles. Angew Chemie - Int Ed. 2007;46:5397–401. doi: 10.1002/anie.200604775. [DOI] [PubMed] [Google Scholar]
- 144.Huang J, Xie J, Chen K, Bu L, Lee S, Cheng Z. et al. HSA coated MnO nanoparticles with prominent MRI contrast for tumor imaging. Chem Commun (Camb) 2010;46:6684–6. doi: 10.1039/c0cc01041c. [DOI] [PMC free article] [PubMed] [Google Scholar]
- 145.Kim T, Momin E, Choi J, Yuan K, Zaidi H, Kim J. et al. Mesoporous silica-coated hollow manganese oxide nanoparticles as positive T1 contrast agents for labeling and MRI tracking of adipose-derived mesenchymal stem cells. J Am Chem Soc. 2011;133:2955–61. doi: 10.1021/ja1084095. [DOI] [PMC free article] [PubMed] [Google Scholar]
- 146.Shin J, Anisur RM, Ko MK, Im GH, Lee JH, Lee IS. Hollow manganese oxide nanoparticles as multifunctional agents for magnetic resonance imaging and drug delivery. Angew Chemie - Int Ed. 2009;48:321–4. doi: 10.1002/anie.200802323. [DOI] [PubMed] [Google Scholar]
- 147.Baek MJ, Park JY, Xu W, Kattel K, Kim HG, Lee EJ. et al. Water-soluble MnO nanocolloid for a molecular T1 MR imaging: a facile one-pot synthesis, in vivo T1 MR images, and account for relaxivities. ACS Appl Mater Interfaces. 2010;2:2949–55. doi: 10.1021/am100641z. [DOI] [PubMed] [Google Scholar]
- 148.Omid H, Oghabian MA, Ahmadi R, Shahbazi N, Hosseini HRM, Shanehsazzadeh S. et al. Synthesizing and staining manganese oxide nanoparticles for cytotoxicity and cellular uptake investigation. Biochim Biophys Acta - Gen Subj. 2014;1840:428–33. doi: 10.1016/j.bbagen.2013.10.001. [DOI] [PubMed] [Google Scholar]
- 149.Huang CC, Khu NH, Yeh CS. The characteristics of sub 10-nm manganese oxide T1 contrast agents of different nanostructured morphologies. Biomaterials. 2010;31:4073–8. doi: 10.1016/j.biomaterials.2010.01.087. [DOI] [PubMed] [Google Scholar]
- 150.Xiao J, Tian XM, Yang C, Liu P, Luo NQ, Liang Y. et al. Ultrahigh relaxivity and safe probes of manganese oxide nanoparticles for in vivo imaging. Sci Rep. 2013;3:3424. doi: 10.1038/srep03424. [DOI] [PMC free article] [PubMed] [Google Scholar]
- 151.Luo Y, Yang J, Li J, Yu Z, Zhang G, Shi X. et al. Facile synthesis and functionalization of manganese oxide nanoparticles for targeted T1-weighted tumor MR imaging. Colloids Surfaces B Biointerfaces. 2015;136:506–13. doi: 10.1016/j.colsurfb.2015.09.053. [DOI] [PubMed] [Google Scholar]
- 152.Wang P, Yang J, Zhou B, Hu Y, Xing L, Xu F. et al. Antifouling Manganese Oxide Nanoparticles: Synthesis, Characterization, and Applications for Enhanced MR Imaging of Tumors. ACS Appl Mater Interfaces. 2017;9:47–53. doi: 10.1021/acsami.6b13844. [DOI] [PubMed] [Google Scholar]
- 153.Cheng Y, Zhang S, Kang N, Huang J, Lv X, Wen K. et al. Polydopamine-Coated Manganese Carbonate Nanoparticles for Amplified Magnetic Resonance Imaging-Guided Photothermal Therapy. ACS Appl Mater Interfaces. 2017;9:19296–306. doi: 10.1021/acsami.7b03087. [DOI] [PubMed] [Google Scholar]
- 154.Ge R, Lin M, Li X, Liu S, Wang W, Li S. et al. Cu2+-Loaded Polydopamine Nanoparticles for Magnetic Resonance Imaging-Guided pH- and Near-Infrared-Light-Stimulated Thermochemotherapy. ACS Appl Mater Interfaces. 2017;9:19706–16. doi: 10.1021/acsami.7b05583. [DOI] [PubMed] [Google Scholar]
- 155.Neuwelt EA, Hamilton BE, Varallyay CG, Rooney WR, Edelman RD, Jacobs PM. et al. Ultrasmall superparamagnetic iron oxides (USPIOs): a future alternative magnetic resonance (MR) contrast agent for patients at risk for nephrogenic systemic fibrosis (NSF)? Kidney Int. 2009;75:465–74. doi: 10.1038/ki.2008.496. [DOI] [PMC free article] [PubMed] [Google Scholar]
- 156.Nayak AB, Luhar A, Hanudel M, Gales B, Hall TR, Finn JP. et al. High-resolution, whole-body vascular imaging with ferumoxytol as an alternative to gadolinium agents in a pediatric chronic kidney disease cohort. Pediatr Nephrol. 2015;30:515–21. doi: 10.1007/s00467-014-2953-x. [DOI] [PMC free article] [PubMed] [Google Scholar]
- 157.Thu MS, Bryant LH, Coppola T, Jordan EK, Budde MD, Lewis BK. et al. Self-assembling nanocomplexes by combining ferumoxytol, heparin and protamine for cell tracking by magnetic resonance imaging. Nat Med. 2012;18:463–7. doi: 10.1038/nm.2666. [DOI] [PMC free article] [PubMed] [Google Scholar]
- 158.Luo Y, Yang J, Yan Y, Li J, Shen M, Zhang G. et al. RGD-functionalized ultrasmall iron oxide nanoparticles for targeted T1 -weighted MR imaging of gliomas. Nanoscale. 2015;7:14538–46. doi: 10.1039/c5nr04003e. [DOI] [PubMed] [Google Scholar]
- 159.Kim BH, Lee N, Kim H, An K, Park Y Il, Choi Y. et al. Large-scale synthesis of uniform and extremely small-sized iron oxide nanoparticles for high-resolution T1 magnetic resonance imaging contrast agents. J Am Chem Soc. 2011;133:12624–31. doi: 10.1021/ja203340u. [DOI] [PubMed] [Google Scholar]
- 160.Li Z, Yi PW, Sun Q, Lei H, Li Zhao H, Zhu ZH. et al. Ultrasmall Water-Soluble and Biocompatible Magnetic Iron Oxide Nanoparticles as Positive and Negative Dual Contrast Agents. Adv Funct Mater. 2012;22:2387–93. [Google Scholar]
- 161.Park M, Lee N, Choi SH, An K, Yu SH, Kim JH. et al. Large-scale synthesis of ultrathin manganese oxide nanoplates and their applications to T1 MRI contrast agents. Chem Mater. 2011;23:3318–24. [Google Scholar]
- 162.Zhao Z, Fan H, Zhou G, Bai H, Liang H, Wang R. et al. Activatable fluorescence/MRI bimodal platform for tumor cell imaging via MnO2 nanosheet-aptamer nanoprobe. J Am Chem Soc. 2014;136:11220–3. doi: 10.1021/ja5029364. [DOI] [PubMed] [Google Scholar]
- 163.Zhou Z, Zhao Z, Zhang H, Wang Z, Chen X, Wang R. et al. Interplay between longitudinal and transverse contrasts in Fe3O4 nanoplates with (111) exposed surfaces. ACS Nano. 2014;8:7976–85. doi: 10.1021/nn5038652. [DOI] [PMC free article] [PubMed] [Google Scholar]
- 164.Zhou Z, Hu R, Wang L, Sun C, Fu G, Gao J. Water bridge coordination on the metal-rich facets of Gd2O3 nanoplates confers high T1 relaxivity. Nanoscale. 2016;8:17887–94. doi: 10.1039/c6nr06444b. [DOI] [PMC free article] [PubMed] [Google Scholar]
- 165.Hung AH, Duch MC, Parigi G, Rotz MW, Manus LM, Mastarone DJ. et al. Mechanisms of gadographene-mediated proton spin relaxation. J Phys Chem C. 2013;117:16263–73. doi: 10.1021/jp406909b. [DOI] [PMC free article] [PubMed] [Google Scholar]
- 166.Ren X, Jing X, Liu L, Guo L, Zhang M, Li Y. Easy preparation of an MRI contrast agent with high longitudinal relaxivity based on gadolinium ions-loaded graphene oxide. RSC Adv. 2014;4:53987–92. [Google Scholar]
- 167.Yoo JM, Kang JH, Hong BH. Graphene-based nanomaterials for versatile imaging studies. Chem Soc Rev. 2015;44:4835–52. doi: 10.1039/c5cs00072f. [DOI] [PubMed] [Google Scholar]
- 168.Stevenson S, Rice G, Glass T, Harich K, Cromer F, Jordan MR. et al. Metallofullerenes in High Yield and Purity. Nature. 1999;80:80–2. [Google Scholar]
- 169.Chen H, Zhen Z, Todd T, Chu PK, Xie J. Nanoparticles for improving cancer diagnosis. Mater Sci Eng R Reports. 2013;74:35–69. doi: 10.1016/j.mser.2013.03.001. [DOI] [PMC free article] [PubMed] [Google Scholar]
- 170.Rodríguez-Fortea A, Alegret N, Poblet JM. Endohedral Fullerenes. Compr Inorg Chem II (Second Ed) From Elem to Appl. 2013;9:907–24. [Google Scholar]
- 171.Chen Z, Ma L, Liu Y, Chen C. Applications of functionalized fullerenes in tumor theranostics. Theranostics. 2012;2:238–50. doi: 10.7150/thno.3509. [DOI] [PMC free article] [PubMed] [Google Scholar]
- 172.Mikawa M, Kato H, Okumura M, Narazaki M, Kanazawa Y, Miwa N. et al. Paramagnetic water-soluble metallofullerenes having the highest relaxivity for MRI contrast agents. Bioconjug Chem. 2001;12:510–4. doi: 10.1021/bc000136m. [DOI] [PubMed] [Google Scholar]
- 173.Lu X, Feng L, Akasaka T, Nagase S. Current status and future developments of endohedral metallofullerenes. Chem Soc Rev. 2012;41:7723. doi: 10.1039/c2cs35214a. [DOI] [PubMed] [Google Scholar]
- 174.Zhang J, Fatouros PP, Shu C, Reid J, Owens LS, Cai T. et al. High relaxivity trimetallic nitride (Gd3N) metallofullerene MRI contrast agents with optimized functionality. Bioconjug Chem. 2010;21:610–5. doi: 10.1021/bc900375n. [DOI] [PMC free article] [PubMed] [Google Scholar]
- 175.Cui R, Li J, Huang H, Zhang M, Guo X, Chang Y. et al. Novel carbon nanohybrids as highly efficient magnetic resonance imaging contrast agents. Nano Res. 2015;8:1259–68. [Google Scholar]
- 176.Sethi R, MacKeyev Y, Wilson LJ. The Gadonanotubes revisited: A new frontier in MRI contrast agent design. Inorganica Chim. Acta. 2012;393:165–72. [Google Scholar]
- 177.Jahanbakhsh R, Atyabi F, Shanehsazzadeh S, Sobhani Z, Adeli M, Dinarvand R. Modified Gadonanotubes as a promising novel MRI contrasting agent. Daru. 2013;21:53. doi: 10.1186/2008-2231-21-53. [DOI] [PMC free article] [PubMed] [Google Scholar]
- 178.Sitharaman B, Kissell KR, Hartman KB, Tran LA, Baikalov A, Rusakova I, Superparamagnetic gadonanotubes are high-performance MRI contrast agents. Chem Commun (Camb); 2005. pp. 3915–7. [DOI] [PubMed] [Google Scholar]
- 179.Tang AM, Ananta JS, Zhao H, Cisneros BT, Lam EY, Wong ST. et al. Cellular uptake and imaging studies of gadolinium-loaded single-walled carbon nanotubes as MRI contrast agents. Contrast Media Mol Imaging. 2011;6:93–9. doi: 10.1002/cmmi.410. [DOI] [PubMed] [Google Scholar]
- 180.Richard C, Doan B-T, Beloeil J-C, Bessodes M, Tóth E, Scherman D. Noncovalent functionalization of carbon nanotubes with amphiphilic Gd3+ chelates: toward powerful T1 and T2 MRI contrast agents. Nano Lett. 2008;8:232–6. doi: 10.1021/nl072509z. [DOI] [PubMed] [Google Scholar]
- 181.Ananta JS, Godin B, Sethi R, Moriggi L, Liu X, Serda RE. et al. Geometrical confinement of gadolinium-based contrast agents in nanoporous particles enhances T1 contrast. Nat Nanotechnol. 2010;5:815–21. doi: 10.1038/nnano.2010.203. [DOI] [PMC free article] [PubMed] [Google Scholar]
- 182.Hartman KB, Laus S, Bolskar RD, Muthupillai R, Helm L, Toth E. et al. Gadonanotubes as ultrasensitive pH-smart probes for magnetic resonance imaging. Nano Lett. 2008;8:415–9. doi: 10.1021/nl0720408. [DOI] [PubMed] [Google Scholar]
- 183.Chen H, Wang GD, Tang W, Todd T, Zhen Z, Tsang C. et al. Gd-Encapsulated Carbonaceous Dots with Efficient Renal Clearance for Magnetic Resonance Imaging. Adv Mater. 2014;26:6761–6. doi: 10.1002/adma.201402964. [DOI] [PMC free article] [PubMed] [Google Scholar]
- 184.Bourlinos AB, Bakandritsos A, Kouloumpis A, Gournis D, Krysmann M, Giannelis EP. et al. Gd(iii)-doped carbon dots as a dual fluorescent-MRI probe. J Mater Chem. 2012;22:23327. [Google Scholar]
- 185.Ren X, Liu L, Li Y, Dai Q, Zhang M, Jing X. Facile preparation of gadolinium(iii) chelates functionalized carbon quantum dot-based contrast agent for magnetic resonance/fluorescence multimodal imaging. J Mater Chem B; 2014. pp. 5541–9. [DOI] [PubMed] [Google Scholar]
- 186.Gong N, Wang H, Li S, Deng Y, Chen X, Ye L. et al. Microwave-assisted polyol synthesis of gadolinium-doped green luminescent carbon dots as a bimodal nanoprobe. Langmuir. 2014;30:10933–9. doi: 10.1021/la502705g. [DOI] [PubMed] [Google Scholar]
- 187.Cao L, Yang ST, Wang X, Luo PG, Liu JH, Sahu S. et al. Competitive performance of carbon “quantum” dots in optical bioimaging. Theranostics. 2012;2:295–301. doi: 10.7150/thno.3912. [DOI] [PMC free article] [PubMed] [Google Scholar]
- 188.Sitharaman B, Kanakia S, Toussaint J, Mullick Chowdhury S, Lalwani G, Tembulkar T. et al. Physicochemical characterization of a novel graphene-based magnetic resonance imaging contrast agent. Int J Nanomedicine. 2013;8:2821. doi: 10.2147/IJN.S47062. [DOI] [PMC free article] [PubMed] [Google Scholar]
- 189.Cossio MLT, Giesen LF, Araya G, Pérez-Cotapos MLS, VERGARA RL, Manca M, Medicinal Chemistry and Pharmacological Potential of Fullerenes and Carbon Nanotubes. Dordrecht: Springer Netherlands; 2008. [Google Scholar]
- 190.Wang L, Zhu X, Tang X, Wu C, Zhou Z, Sun C. et al. A Multiple Gadolinium Complexes Decorated Fullerene as a Highly Sensitive T1 Contrast Agent. Chem. Commun. 2015;51:4390–3. doi: 10.1039/c5cc00285k. [DOI] [PubMed] [Google Scholar]
- 191.Wang R, Carducci MD, Zheng Z. Direct hydrolytic route to molecular oxo-hydroxo lanthanide clusters. Inorg Chem. 2000;39:1836–7. doi: 10.1021/ic991391p. [DOI] [PubMed] [Google Scholar]
- 192.Laurent S, Forge D, Port M, Roch A, Robic C, Vander Elst L. et al. Magnetic Iron Oxide Nanoparticles: Synthesis, Stabilization, Vectorization, Physicochemical Characterizations, and Biological Applications. Chem Rev. 2008;108:2064–110. doi: 10.1021/cr068445e. [DOI] [PubMed] [Google Scholar]
- 193.Shen Z, Wu A, Chen X. Iron Oxide Nanoparticle Based Contrast Agents for Magnetic Resonance Imaging. Mol. Pharm. 2017;14:1352–64. doi: 10.1021/acs.molpharmaceut.6b00839. [DOI] [PubMed] [Google Scholar]
- 194.Tang W, Zhen Z, Yang C, Wang L, Cowger T, Chen H. et al. Fe5C2 Nanoparticles with High MRI Contrast Enhancement for Tumor Imaging. Small. 2014;10:1245–9. doi: 10.1002/smll.201303263. [DOI] [PMC free article] [PubMed] [Google Scholar]
- 195.Wang Y-XJ. Superparamagnetic iron oxide based MRI contrast agents: Current status of clinical application. Quant. Imaging Med Surg. 2011;1:35–40. doi: 10.3978/j.issn.2223-4292.2011.08.03. [DOI] [PMC free article] [PubMed] [Google Scholar]
- 196.Busquets MA, Estelrich J, Sánchez-Martín MJ. Nanoparticles in magnetic resonance imaging: from simple to dual contrast agents. Int J Nanomedicine. 2015;140:1727–41. doi: 10.2147/IJN.S76501. [DOI] [PMC free article] [PubMed] [Google Scholar]
- 197.Lacroix LM, Frey Huls N, Ho D, Sun X, Cheng K, Sun S. Stable single-crystalline body centered cubic Fe nanoparticles. Nano Lett. 2011;11:1641–5. doi: 10.1021/nl200110t. [DOI] [PubMed] [Google Scholar]
- 198.Wang J, Sun J, Sun Q, Chen Q. One-step hydrothermal process to prepare highly crystalline Fe3O4 nanoparticles with improved magnetic properties. Mater Res Bull. 2003;38:1113–8. [Google Scholar]
- 199.Taeghwan Hyeon, Su Seong Lee, Jongnam Park YC, HBN. Synthesis of Highly Crystalline and Monodisperse Maghemite Nanoystallites without a Size-Selection Process. J Am Chem Soc. 2001;123:12789–801. doi: 10.1021/ja016812s. [DOI] [PubMed] [Google Scholar]
- 200.Woo K, Hong J, Ahn JP. Synthesis and surface modification of hydrophobic magnetite to processible magnetite@silica-propylamine. J Magn Magn Mater. 2005;293:177–81. [Google Scholar]
- 201.Sun S, Zeng H, Robinson DB, Raoux S, Rice PM, Wang SX. et al. Monodisperse MFe2O4 (M = Fe, Co, Mn) Nanoparticles. J Am Chem Soc. 2004;126:273–9. doi: 10.1021/ja0380852. [DOI] [PubMed] [Google Scholar]
- 202.Park J, An K, Hwang Y, Park J-G, Noh H-J, Kim J-Y. et al. Ultra-large-scale syntheses of monodisperse nanocrystals. Nat Mater. 2004;3:891–5. doi: 10.1038/nmat1251. [DOI] [PubMed] [Google Scholar]
- 203.Schultz-Sikma EA, Joshi HM, Ma Q, MacRenaris KW, Eckermann AL, Dravid VP. et al. Probing the chemical stability of mixed ferrites: Implications for magnetic resonance contrast agent design. Chem Mater. 2011;23:2657–64. doi: 10.1021/cm200509g. [DOI] [PMC free article] [PubMed] [Google Scholar]
- 204.Lee J-H, Huh Y-M, Jun Y, Seo J, Jang J, Song H-T. et al. Artificially engineered magnetic nanoparticles for ultra-sensitive molecular imaging. Nat Med. 2007;13:95–9. doi: 10.1038/nm1467. [DOI] [PubMed] [Google Scholar]
- 205.Jang JT, Nah H, Lee JH, Moon SH, Kim MG, Cheon J. Critical enhancements of MRI contrast and hyperthermic effects by dopant-controlled magnetic nanoparticles. Angew Chemie - Int Ed. 2009;48:1234–8. doi: 10.1002/anie.200805149. [DOI] [PubMed] [Google Scholar]
- 206.Kloust H, Zierold R, Merkl J-P, Schmidtke C, Feld A, Pöselt E. et al. Synthesis of Iron Oxide Nanorods Using a Template Mediated Approach. Chem Mater. 2015;27:4914–7. [Google Scholar]
- 207.Peng S, Wang C, Xie J, Sun S. Synthesis and stabilization of monodisperse Fe nanoparticles. J Am Chem Soc. 2006;128:10676–7. doi: 10.1021/ja063969h. [DOI] [PubMed] [Google Scholar]
- 208.Cheong S, Ferguson P, Feindel KW, Hermans IF, Callaghan PT, Meyer C. et al. Simple synthesis and functionalization of iron nanoparticles for magnetic resonance imaging. Angew Chemie - Int Ed. 2011;50:4206–9. doi: 10.1002/anie.201100562. [DOI] [PubMed] [Google Scholar]
- 209.Seo WS, Lee JH, Sun X, Suzuki Y, Mann D, Liu Z. et al. FeCo/graphitic-shell nanocrystals as advanced magnetic-resonance-imaging and near-infrared agents. Nat Mater. 2006;5:971–6. doi: 10.1038/nmat1775. [DOI] [PubMed] [Google Scholar]
- 210.Yu J, Yang C, Li J, Ding Y, Zhang L, Yousaf MZ. et al. Multifunctional Fe5C2 nanoparticles: A targeted theranostic platform for magnetic resonance imaging and photoacoustic tomography-guided photothermal therapy. Adv Mater. 2014;26:4114–20. doi: 10.1002/adma.201305811. [DOI] [PubMed] [Google Scholar]
- 211.Cowger TA, Tang W, Zhen Z, Hu K, Rink DE, Todd TJ. et al. Casein-Coated Fe5C2 Nanoparticles with Superior r2 Relaxivity for Liver-Specific Magnetic Resonance Imaging. Theranostics. 2015;5:1225–32. doi: 10.7150/thno.12570. [DOI] [PMC free article] [PubMed] [Google Scholar]
- 212.Li M, Kim HS, Tian L, Yu MK, Jon S, Moon WK. Comparison of two ultrasmall superparamagnetic iron oxides on cyto-toxicity and MR imaging of tumors. Theranostics. 2012;2:76–85. doi: 10.7150/thno.3462. [DOI] [PMC free article] [PubMed] [Google Scholar]
- 213.Roca AG, Marco JF, Del Puerto Morales M, Serna CJ. Effect of nature and particle size on properties of uniform magnetite and maghemite nanoparticles. J Phys Chem C. 2007;111:18577–84. [Google Scholar]
- 214.Tronc E, Jolivet JP. Surface effects on magnetically coupled ”γ-Fe2O3” colloids. Hyperfine Interact. 1986;28:525–8. [Google Scholar]
- 215.Joshi HM, De M, Richter F, He J, Prasad PV, Dravid VP. Effect of silica shell thickness of Fe3O4-SiOx core-shell nanostructures on MRI contrast. J Nanoparticle Res. 2013;15:1448. [Google Scholar]
- 216.Pöselt E, Kloust H, Tromsdorf U, Janschel M, Hahn C, Maßlo C. et al. Relaxivity optimization of a pegylated iron-oxide-based negative magnetic resonance contrast agent for T2-weighted spin-echo imaging. ACS Nano. 2012;6:1619–24. doi: 10.1021/nn204591r. [DOI] [PubMed] [Google Scholar]
- 217.LaConte LEW, Nitin N, Zurkiya O, Caruntu D, O'Connor CJ, Hu X. et al. Coating thickness of magnetic iron oxide nanoparticles affects R2 relaxivity. J Magn Reson Imaging. 2007;26:1634–41. doi: 10.1002/jmri.21194. [DOI] [PubMed] [Google Scholar]
- 218.Xie J, Wang J, Niu G, Huang J, Chen K, Li X. et al. Human serum albumin coated iron oxide nanoparticles for efficient cell labeling. Chem Commun (Camb) 2010;46:433–5. doi: 10.1039/b917195a. [DOI] [PMC free article] [PubMed] [Google Scholar]
- 219.Huang J, Wang L, Lin R, Wang AY, Yang L, Kuang M. et al. Casein-coated iron oxide nanoparticles for high MRI contrast enhancement and efficient cell targeting. ACS Appl Mater Interfaces. 2013;5:4632–9. doi: 10.1021/am400713j. [DOI] [PMC free article] [PubMed] [Google Scholar]
- 220.Li J, Hu Y, Yang J, Sun W, Cai H, Wei P. et al. Facile synthesis of folic acid-functionalized iron oxide nanoparticles with ultrahigh relaxivity for targeted tumor MR imaging. J Mater Chem B. 2015;3:5720–30. doi: 10.1039/c5tb00849b. [DOI] [PubMed] [Google Scholar]
- 221.Hu Y, Wang R, Li J, Ding L, Wang X, Shi X. et al. Facile Synthesis of Lactobionic Acid-Targeted Iron Oxide Nanoparticles with Ultrahigh Relaxivity for Targeted MR Imaging of an Orthotopic Model of Human Hepatocellular Carcinoma. Part Part Syst Charact. 2017;34:1600113. [Google Scholar]
- 222.Peiris PM, Schmidt E, Calabrese M, Karathanasis E. Assembly of Linear Nano-Chains from Iron Oxide Nanospheres with Asymmetric Surface Chemistry. PLoS One. 2011;6:e15927. doi: 10.1371/journal.pone.0015927. [DOI] [PMC free article] [PubMed] [Google Scholar]
- 223.Moffat B a, Reddy GR, McConville P, Hall DE, Chenevert TL, Kopelman RR. et al. A novel polyacrylamide magnetic nanoparticle contrast agent for molecular imaging using MRI. Mol Imaging Off J Soc Mol Imaging. 2003;2:324–32. doi: 10.1162/15353500200303163. [DOI] [PubMed] [Google Scholar]
- 224.Paquet C, De Haan HW, Leek DM, Lin HY, Xiang B, Tian G. et al. Clusters of superparamagnetic iron oxide nanoparticles encapsulated in a hydrogel: A particle architecture generating a synergistic enhancement of the T2 relaxation. ACS Nano. 2011;5:3104–12. doi: 10.1021/nn2002272. [DOI] [PubMed] [Google Scholar]
- 225.Wu M, Zhang D, Zeng Y, Wu L, Liu X, Liu J. Nanocluster of superparamagnetic iron oxide nanoparticles coated with poly (dopamine) for magnetic field-targeting, highly sensitive MRI and photothermal cancer therapy. Nanotechnology. 2015;26:115102. doi: 10.1088/0957-4484/26/11/115102. [DOI] [PubMed] [Google Scholar]
- 226.Yang K, Hu L, Ma X, Ye S, Cheng L, Shi X. et al. Multimodal imaging guided photothermal therapy using functionalized graphene nanosheets anchored with magnetic nanoparticles. Adv Mater. 2012;24:1868–72. doi: 10.1002/adma.201104964. [DOI] [PubMed] [Google Scholar]
- 227.Marie H, Lemaire L, Franconi F, Lajnef S, Frapart YM, Nicolas V. et al. Superparamagnetic liposomes for MRI monitoring and external magnetic field-induced selective targeting of malignant brain tumors. Adv Funct Mater. 2015;25:1258–69. [Google Scholar]
- 228.Zhou Z, Tian R, Wang Z, Yang Z, Liu Y, Liu G. et al. Artificial local magnetic field inhomogeneity enhances T2 relaxivity. Nat Commun. 2017;8:15468. doi: 10.1038/ncomms15468. [DOI] [PMC free article] [PubMed] [Google Scholar]
- 229.Hu F, Zhao YS. Inorganic nanoparticle-based T1 and T1/T2 magnetic resonance contrast probes. Nanoscale. 2012;4:6235. doi: 10.1039/c2nr31865b. [DOI] [PubMed] [Google Scholar]
- 230.Zhou Z, Wang L, Chi X, Bao J, Yang L, Zhao W. et al. Engineered iron-oxide-based nanoparticles as enhanced T1 contrast agents for efficient tumor imaging. ACS Nano. 2013;7:3287–96. doi: 10.1021/nn305991e. [DOI] [PMC free article] [PubMed] [Google Scholar]
- 231.Zhou Z, Huang D, Bao J, Chen Q, Liu G, Chen Z. et al. A synergistically enhanced T1-T2 dual-modal contrast agent. Adv Mater. 2012;24:6223–8. doi: 10.1002/adma.201203169. [DOI] [PMC free article] [PubMed] [Google Scholar]
- 232.Huang G, Li H, Chen J, Zhao Z, Yang L, Chi X. et al. Tunable T1 and T2 contrast abilities of manganese-engineered iron oxide nanoparticles through size control. Nanoscale. 2014;6:10404–12. doi: 10.1039/c4nr02680b. [DOI] [PubMed] [Google Scholar]
- 233.Yang L, Zhou Z, Liu H, Wu C, Zhang H, Huang G. et al. Europium-engineered iron oxide nanocubes with high T1 and T2 contrast abilities for MRI in living subjects. Nanoscale. 2015;7:6843–50. doi: 10.1039/c5nr00774g. [DOI] [PubMed] [Google Scholar]
- 234.Chen J, Zhang W, Guo Z, Wang H-B, Wang D, Zhou J. et al. pH-Responsive Iron Manganese Silicate Nanoparticles as T1-T2* Dual-Modal Imaging Probes for Tumor Diagnosis. ACS Appl Mater Interfaces. 2015;7:5373–83. doi: 10.1021/acsami.5b00727. [DOI] [PubMed] [Google Scholar]
- 235.Bae KH, Kim YB, Lee Y, Hwang J, Park H, Park TG. Bioinspired Synthesis and Characterization of Gadolinium-Labeled Magnetite Nanoparticles for Dual Contrast T1- and T2-Weighted Magnetic Resonance Imaging. Bioconjug Chem. 2010;21:505–12. doi: 10.1021/bc900424u. [DOI] [PubMed] [Google Scholar]
- 236.Yang H, Zhuang Y, Sun Y, Dai A, Shi Xiangyang X, Wu D. et al. Targeted dual-contrast T1- and T2-weighted magnetic resonance imaging of tumors using multifunctional gadolinium-labeled superparamagnetic iron oxide nanoparticles. Biomaterials. 2011;32:4584–93. doi: 10.1016/j.biomaterials.2011.03.018. [DOI] [PubMed] [Google Scholar]
- 237.Choi JS, Lee JH, Shin TH, Song HT, Kim EY, Cheon J. Self-confirming “aND” logic nanoparticles for fault-free MRI. J Am Chem Soc. 2010;132:11015–7. doi: 10.1021/ja104503g. [DOI] [PMC free article] [PubMed] [Google Scholar]
- 238.Gao L, Yu J, Liu Y, Zhou J, Sun L, Wang J. et al. Tumor-penetrating peptide conjugated and doxorubicin loaded T1-T2 dual mode MRI contrast agents nanoparticles for tumor theranostics. Theranostics. 2018;8:92–108. doi: 10.7150/thno.21074. [DOI] [PMC free article] [PubMed] [Google Scholar]
- 239.Cheng K, Yang M, Zhang R, Qin C, Su X, Cheng Z. Hybrid Nanotrimers for Dual T1- and T2-Weighted Magnetic Resonance Imaging. ACS Nano. 2014;8:9884–96. doi: 10.1021/nn500188y. [DOI] [PMC free article] [PubMed] [Google Scholar]
- 240.Aime S, Calabi L, Cavallotti C, Gianolio E, Giovenzana GB, Losi P. et al. [Gd-AAZTA]-: A new structural entry for an improved generation of MRI contrast agents. Inorg Chem. 2004;43:7588–90. doi: 10.1021/ic0489692. [DOI] [PubMed] [Google Scholar]
- 241.Gianolio E, Giovenzana GB, Longo D, Longo I, Menegotto I, Aime S. Relaxometric and Modelling Studies of the Binding of a Lipophilic Gd-AAZTA Complex to Fatted and Defatted Human Serum Albumin. Chem - A Eur J. 2007;13:5785–97. doi: 10.1002/chem.200601277. [DOI] [PubMed] [Google Scholar]
- 242.Zhang G, Zhang R, Wen X, Li L, Li C. Micelles based on biodegradable poly(L-glutamic acid)-b-polylactide with paramagnetic Gd ions chelated to the shell layer as a potential nanoscale MRI-Visible delivery system. Biomacromolecules. 2008;9:36–42. doi: 10.1021/bm700713p. [DOI] [PMC free article] [PubMed] [Google Scholar]
- 243.Besenius P, Heynens JLM, Straathof R, Nieuwenhuizen MML, Bomans PHH, Terreno E. et al. Paramagnetic self-assembled nanoparticles as supramolecular MRI contrast agents. Contrast Media Part Part Syst Charact. 2012;7:356–61. doi: 10.1002/cmmi.498. [DOI] [PubMed] [Google Scholar]
- 244.Shi Y, Pan Y, Zhong J, Yang J, Zheng J, Cheng J. et al. Facile synthesis of gadolinium (III) chelates functionalized carbon quantum dots for fluorescence and magnetic resonance dual-modal bioimaging. Carbon N Y. 2015;93:742–50. [Google Scholar]
- 245.Le Duc G, Miladi I, Alric C, Mowat P, Bräuer-Krisch E, Bouchet A. et al. Toward an image-guided microbeam radiation therapy using gadolinium-based nanoparticles. ACS Nano. 2011;5:9566–74. doi: 10.1021/nn202797h. [DOI] [PubMed] [Google Scholar]
- 246.Overoye-Chan K, Koerner S, Looby RJ, Kolodziej AF, Zech SG, Deng Q. et al. EP-2104R: A fibrin-specific gadolinium-based MRI contrast agent for detection of thrombus. J Am Chem Soc. 2008;130:6025–39. doi: 10.1021/ja800834y. [DOI] [PubMed] [Google Scholar]
- 247.Pan D, Schmieder A, Wickline S, Lanza G. Manganese-based MRI contrast agents: past, present and future. Tetrahedron. 2011;67:8431–44. doi: 10.1016/j.tet.2011.07.076. [DOI] [PMC free article] [PubMed] [Google Scholar]
- 248.Jing L, Liang X, Li X, Lin L, Yang Y, Yue X. et al. Mn-porphyrin Conjugated Au Nanoshells Encapsulating Doxorubicin for Potential Magnetic Resonance Imaging and Light Triggered Synergistic Therapy of Cancer. Theranostics. 2014;4:858–71. doi: 10.7150/thno.8818. [DOI] [PMC free article] [PubMed] [Google Scholar]
- 249.Nordhøy W, Anthonsen HW, Bruvold M, Brurok H, Skarra S, Krane J. et al. Intracellular manganese ions provide strong T1 relaxation in rat myocardium. Magn Reson Med. 2004;52:506–14. doi: 10.1002/mrm.20199. [DOI] [PubMed] [Google Scholar]
- 250.Miao Z-H, Wang H, Yang H, Li Z-L, Zhen L, Xu C-Y. Intrinsically Mn2+-Chelated Polydopamine Nanoparticles for Simultaneous Magnetic Resonance Imaging and Photothermal Ablation of Cancer Cells. ACS Appl Mater Interfaces. 2015;7:16946–52. doi: 10.1021/acsami.5b06265. [DOI] [PubMed] [Google Scholar]
- 251.Corot C, Robert P, Idée JM, Port M. Recent advances in iron oxide nanocrystal technology for medical imaging. Adv Drug Deliv Rev. 2006;58:1471–504. doi: 10.1016/j.addr.2006.09.013. [DOI] [PubMed] [Google Scholar]
- 252.Hadjipanayis CG, Bonder MJ, Balakrishnan S, Wang X, Mao H. Metallic Iron Nanoparticles for MRI Contrast Enhancement and Local Hyperthermia. Small. 2008;4:1925–9. doi: 10.1002/smll.200800261. [DOI] [PMC free article] [PubMed] [Google Scholar]
- 253.Maenosono S, Suzuki T, Saita S. Superparamagnetic FePt nanoparticles as excellent MRI contrast agents. J Magn Magn Mater. 2008;320:79–83. [Google Scholar]
- 254.Ye F, Laurent S, Fornara A, Astolfi L, Qin J, Roch A. et al. Uniform mesoporous silica coated iron oxide nanoparticles as a highly efficient, nontoxic MRI T2 contrast agent with tunable proton relaxivities. Contrast Media Mol Imaging. 2012;7:460–8. doi: 10.1002/cmmi.1473. [DOI] [PMC free article] [PubMed] [Google Scholar]
- 255.Li J, Shi X, Shen M. Hydrothermal Synthesis and Functionalization of Iron Oxide Nanoparticles for MR Imaging Applications. Part Part Syst Charact. 2014;31:1223–37. [Google Scholar]
- 256.Niu D, Luo X, Li Y, Liu X, Wang X, Shi J. Manganese-loaded dual-mesoporous silica spheres for efficient T1- and T2-weighted dual mode magnetic resonance imaging. ACS Appl Mater Interfaces. 2013;5:9942–8. doi: 10.1021/am401856w. [DOI] [PubMed] [Google Scholar]