Abstract
In this chapter, we present updated features to a model developed by Dana-Farber investigators within the Cancer Intervention and Surveillance Modeling Network (CISNET). The initial model was developed to evaluate the impact of mammography screening strategies. This major update includes incorporation of ductal carcinoma in situ (DCIS) as part of the natural history of breast cancer. The updated model allows DCIS in the pre-clinical state to regress to undetectable early stage DCIS, or to transition to invasive breast cancer, or to clinical DCIS. We summarize model assumptions for DCIS natural history and model parameters. Another new development is the derivation of analytical expressions for overdiagnosis. Overdiagnosis refers to mammographic identification of breast cancer that would never have resulted in disease symptoms in the patient’s remaining lifetime (i.e., lead time longer than residual survival time). This is an inevitable consequence of early detection. Our model uniquely assesses overdiagnosis using an analytical formulation. We derive the lead time distribution resulting from early detection of invasive breast cancer and DCIS and formulate the analytical expression for overdiagnosis. This formulation was applied to assess overdiagnosis from mammography screening. Other model updates involve implementing common model input parameters with updated treatment dissemination and effectiveness, and improved mammography performance. Lastly, the model was expanded to incorporate subgroups by breast density and molecular subtypes. The incorporation of DCIS and subgroups and the derivation of an overdiagnosis estimation procedure improve the model for evaluating mammography screening programs.
Keywords: ductal carcinoma in situ, mammography screening, lead time, overdiagnosis
INTRODUCTION
The clinical motivation for screening asymptomatic individuals for cancer is to diagnose the disease early, before it progresses to advanced stages. Modeling approaches provide insights into the expected effectiveness of screening strategies. We developed a model to characterize breast cancer disease progression and depict the early detection process of mammography screening [1–3]. In collaboration with the Cancer Intervention and Surveillance Modeling Network (CISNET) Breast Working Group, our model has been extensively applied to comparative effectiveness research on mammography screening [4–7].
The model developed by Dana-Farber investigators within the CISNET (referred to as Model D) takes an analytical approach to predict breast cancer incidence and mortality as a function of the disease natural history, detection process, and treatment. Model D evaluates the impact of mammography screening and treatment on incidence and mortality of breast cancer. The factors that influence mortality in Model D include performance characteristics of screening tests, screening schedule, natural history parameters (distribution of sojourn time in health states, transition rates between health states), incidence of disease by age, and treatment effectiveness.
This chapter describes a major and a minor update and a new development to Model D since its initial publication in 2006. The major update is the expansion of the natural history model to include ductal carcinoma in situ (DCIS). Therefore, the updated model addresses the natural history of invasive breast cancer as well as DCIS. DCIS represents a spectrum of abnormal cells confined to the breast duct. Despite the possible indolent nature of DCIS, it can potentially progress to invasive breast cancer. The natural history of DCIS—how it develops and if and when it progresses to invasive cancer or regresses to normal tissue—cannot be directly observed and hence is not well understood [8]. With the widespread use of mammography screening, the incidence of DCIS has increased dramatically in the past couple of decades. American Cancer Society estimates for 2015 were approximately 50,000 new diagnoses of female DCIS [9]. These cases would account for 20–25% of screen-detected breast cancers [10]. Inclusion of DCIS in Model D allows for full evaluation of the impact of mammography screening on breast cancer incidence and mortality.
The new development involves the derivation of analytical expressions for quantifying overdiagnosis. For mammography screening, diagnosing patients with breast cancer for abnormalities that would not be detected in their lifetime in the absence of screening is overdiagnosis. Hence, by definition, overdiagnosis can potentially occur only for individuals diagnosed from a screening exam. In the updated version of Model D, diagnosis includes both screen-detected invasive breast cancer and DCIS. Model D now uniquely quantifies the degree of overdiagnosis by formulating the probability of the lead time being longer than the patient’s remaining survival time. In Model D, lead time begins with the event of early detection and extends to when the disease would have been diagnosed from clinical symptoms. A challenge is that lead time is not directly observable as early diagnosis interrupts natural disease progression. However, the lead time can be analytically quantified. We derived the lead time distribution for screen-detected invasive breast cancer and DCIS and applied it to quantify overdiagnosis.
The CISNET Breast Working Group models share the common model input parameters described in the common model input chapter of this monograph [11]. Parameters used in Model D are the US population lifetable, incidence of breast cancer in the absence of screening and treatment, screening test performance, screening dissemination, stage distributions of cases by mode of detection, treatment dissemination, and effectiveness. Since Model D does not require calibration to fit the incidence or mortality data, these input parameters are directly incorporated into the model. As more detailed and refined common input data become available, they are implemented to Model D.
Our main aim in this chapter is to present our updated model of breast cancer progression that includes DCIS. We present the DCIS natural history model specifications and assumptions. We also present our analytical approaches for estimating overdiagnosis from mammography screening for invasive breast cancer and DCIS. This formulation was derived using the relationship between lead time and residual survival function. We also outline our general approaches for a minor update, developing subgroup models such as incorporation of breast density and molecular subtypes of estrogen receptor (ER) and human epidermal growth factor-2 receptor (HER2) status. Lastly, we describe other updated features reflecting better screening performances and complex treatment dissemination and effectiveness.
MODEL OVERVIEW
This section introduces general features of the initial model [2], presents major and minor updates, and outlines a new development.
Basic Model: Natural History of Invasive Breast Cancer
The Dana-Farber CISNET Model D is unique among CISNET breast cancer models because it is an analytical model, where as other CISNET models are simulation-based [7]. Model D depicts the early detection process of screening and predicts breast cancer incidence and mortality as a function of the disease natural history, detection process, and treatment [2,3]. Analytical formulations were derived and implemented in Model D to estimate the impact of mammography screening and treatment on incidence and mortality of breast cancer.
Initially, Model D characterized the natural history of breast cancer by health states involving invasive breast cancer. Two main model assumptions are: 1) invasive breast cancer is progressive and advances to worse states, and 2) the mortality benefit from screening is from a “stage shift” in diagnosis. That is, screening that finds cancer at an earlier disease stage leads to the mortality benefit. The model directly uses observed stage distributions by mode of detection (screen, interval and clinical mode of detection as defined in the common input chapter [11]). For example, for screen-detected cases, breast cancer-specific survival is generated by combining stage-specific baseline survival data (in the absence of screening and treatment) using the observed stage distributions of screen-detected cases. A similar calculation is carried out for the survival of interval and clinical cases. Full details of this procedure were elaborated previously [2]. Other factors such as performance characteristics of screening tests, natural history parameters (sojourn time in health states, transition rates between health states) and treatment effectiveness also influence mortality in Model D.
Any specific screening patterns or combination of screening patterns used in the US population are applied by birth cohort. The mortality benefit of mammography screening is obtained through a stage shift as described above. Treatment effectiveness captured as hazard reductions are applied to the baseline (in the absence of screening and treatment) underlying breast cancer survival data. Since Model D does not require calibration, no extra parameters need to be estimated to fit the observed incidence or mortality data. Therefore, incorporation of common input data is straightforward. In modeling breast cancer incidence and mortality trends in the US female population, dissemination of treatment and screening provided as common input data are directly implemented by birth cohort [11].
Analytical formulations of Model D are implemented using the software Mathcad (version: 14) from Parametric Technology Corporation (PTC) and Mathlab (version: 2014) from Mathworks to generate incidence and mortality-related outcomes.
Updated Model: Natural History of Breast Cancer with Invasive Breast Cancer and DCIS
The major update to our model was adding an in situ breast cancer component to the existing invasive breast cancer natural history model [2]. We used DCIS to represent in situ breast cancer in general. This generalization was felt to be justified as DCIS accounts for the majority of in situ breast cancers, especially those detected by mammography [12–15].
The updated model characterizes the natural history of breast cancer using health states. As described in Figure 1, a normal tissue first transits into a pre-clinical, undetectable in situ state and further progresses to either a pre-clinical, screen-detectable in situ state or a pre-clinical screen-detectable invasive breast cancer state. Specifically, an individual’s health states may be: (1) disease-free (S0), (2) early stage DCIS not detectable by any screening modality (Sdu), (3) early stage DCIS detectable by screening (Sdp), (4) clinical DCIS with symptoms (Sdc), (5) early stage screen-detectable invasive breast cancer (Sp), (6) clinical invasive breast cancer with symptoms (Sc), or (7) breast cancer death (Sd).
Figure 1.
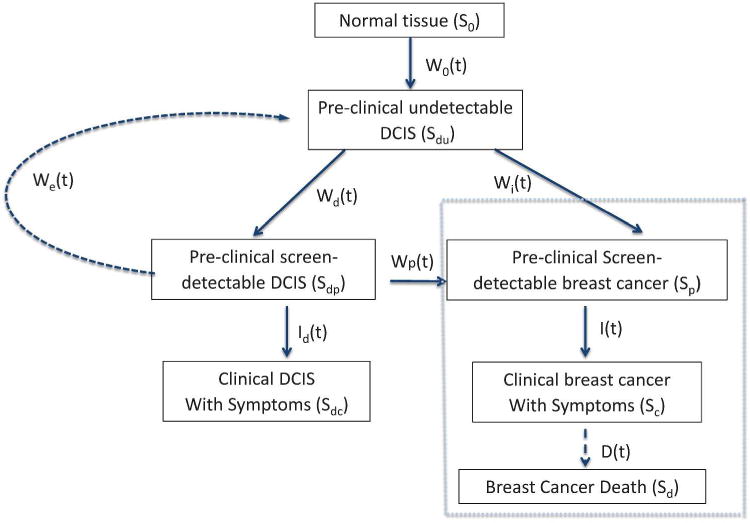
Natural history of breast cancer: Invasive breast cancer and ductal carcinoma in situ. Black-dashed box invasive breast cancer component. S0, disease free state; Sdu, early stage DCIS not detectable by any screening modality; Sdp, early stage DCIS detectable by screening; Sdc, clinical DCIS with symptoms; Sp, early stage screen detectable invasive breast cancer; Sc, clinical invasive breast cancer; Sd, breast cancer death. Cases in Sdc are likely to be treated and cured after diagnosis and not affect the model. Therefore, transitions out of Sdc are not included. Transition probabilities: W0(t) S0 → Sdu during an age interval (t, t+ ∆t); Wd(t) Sdu → Sdp; We(t) Sdp → Sdu; Wp(t) Sdp → Sp; Wi(t) Sdu → Sp; Id(t) Sdp → Sdc; I(t) Sp → Sc; D(t) Sc → Sd. Net transition probability Ws(t)= Wd(t) − We(t) − Wp(t). DCIS, ductal carcinoma in situ.
The invasive breast cancer component of the natural history (Figure 1) was previously developed and validated [1–3, 16]. Briefly, the model assumes that disease progresses to worse states, Sdu → Sp → Sc. Sojourn time in Sp follows an exponential distribution (Zelen 1969) with an age-dependent mean sojourn time of 2–4 years [18]. For early stage DCIS in the preclinical, screen-detectable state: (1) some cases will stay in the early stage and eventually regress to the preclinical, undetectable DCIS state, (2) some will progress to invasive breast cancer, and (3) some will progress to the clinical DCIS state when symptoms appear. We assumed that all three types could be detected by mammography screening. Furthermore, we assumed that DCIS without progression would not result in death.
Transition probabilities between health states are defined as in Figure 1. Overall the proposed DCIS model captures the main DCIS health states and transitions among these health states. We defined W0(t) ∆t as the transition probability of S0 → Sdu during an age interval (t, t + ∆t). Similarly, other transition probabilities are denoted by Wd (t) for Sdu → Sdp, We(t) for Sdp → Sdu, Wp(t) for Sdp → Sp, Wi(t) for Sdu → Sp, Id(t) for Sdp → Sdc, I(t) for Sp → Sc, and D(t) for Sc → Sd. Except for Id(t) and I(t), these transition probabilities are unobservable and cannot be directly estimated. For simplification, the updated DCIS model combines three unobservable transition probabilities to and from the pre-clinical, screen-detectable DCIS state (Sdp) as a net transition probability of Ws(t) = Wd(t) − We(t) − Wp(t). This parameterization simplifies a net of Ws(t) probability to enter Sdp and Id(t) to exit Sdp.
Sojourn time in Sdp is critical for the model because it is the point when screening, but not symptoms, can reveal DCIS. The probability density function of the sojourn time in Sdp is defined as q(t) = (1 − c)λe−λt where λ can be a function of age and c is the fraction of pre-clinical detectable DCIS that does not become clinically detectable. Since we used the net transition probability Ws(t) rather than specifying Wd(t), We(t) and Wp(t) individually, and the exit rate from screen-detectable pre-clinical DCIS was guided by Id(t), we adopted the cure rate model from traditional survival analysis [19]. Thus, sojourn time in Sdp is described by two parts: one part exiting with Id(t) as an exponential rate and the rest described by fraction c. Correspondingly, . This is a slight variation from a commonly adopted form of exponential distribution for Sdp.
Estimation of DCIS Model Parameters
The transition probability of Id(t) can be estimated from observed age-specific DCIS incidence data in the absence of screening. The remaining transition probability, simplified to Ws(t), is calculated recursively using the method described in Lee and Zelen [1]. For this purpose, we used several data sources including US Surveillance, Epidemiology and End Results (SEER) data on DCIS incidence before 1980, when mammography screening began being disseminated in the United States, and Norwegian DCIS incidence data before a national screening program was instituted in 1996. We also used the US DCIS incidence data generated from the age-period-cohort (APC) approach in the absence of screening as described in the common model input chapter [11,20,21].
In addition, we used data from the Norwegian Breast Cancer Screening Program (NBCSP) [22] and Norwegian age-specific DCIS incidence data from 1993–1995 (pre-screening era). The NBCSP started in 1995–1996 as an evaluation program and mammography screening disseminated gradually to the Norwegian female population. By 2006, the entire Norwegian female population aged 50–69 years was invited to participate in the biennial mammography screening program. NBCSP data were summarized by screening rounds to indicate screen-detected DCIS as well DCIS cases diagnosed in the interval between two screening examinations. By modeling the case-finding processes in mammography screening, we estimated the DCIS natural history parameters of λ, c for q(t) and transition probabilities of We(t) and Id(t). Ws(t) and Id(t) were also evaluated using US SEER data (before 1980) and APC-baseline data for various US birth cohorts. Overall, the mean sojourn time in Sdp for the exponential component (1/λ) was 1.5–3 years and the fraction of pre-clinical detectable DCIS (c) that did not transit to clinical DCIS was 0.45–0.55. As demonstrated by Shen and Zelen [18], the estimated sojourn time distribution in Sp for invasive breast cancer does not vary across US, Canadian and European populations. This finding supports our adoption of NBCSP data for the sojourn time distribution data in Sdp. DCIS APC incidence data for the US population was adopted to estimate transition probabilities.
Estimation of Overdiagnosis
The main intent of this section is to present the concept of overdiagnosis and outline Model D’s approach of quantifying overdiagnosis. We formulated a probability of overdiagnosis conditional on time of screen detection. We mainly used this formulation to evaluate the level of overdiagnosis. To demonstrate our analytical formulation of the lead time and overdiagnosis, we adopted the following notations. Consider a mammogram screening program in which screening mammography is repeated at times t0< t1 < t2 < … < tn−1. Let the age at mammography screening examination be denoted by z + tr for the rth examination. Define S as a random variable denoting survival with survival probability P(S > s) = G(s), and T as the lead time conditional on screen detection at tr. Overdiagnosis is defined by an event that occurs when lead time is greater than remaining survival time, i.e., {OD = T > S}. Figure 2 displays the lead time in a case-finding process with repeated screening examinations for invasive breast cancer.
Figure 2.
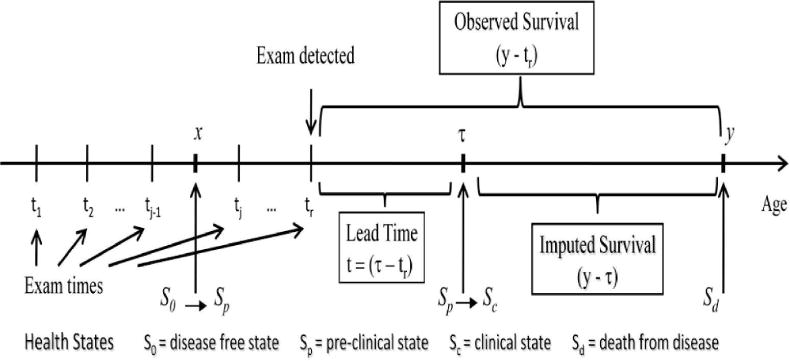
Case-finding process
The probability of overdiagnosis conditional on screen detection at the rth exam and age z +tr is expressed as (1):
| (1) |
where
and f(t|tr, X(tr) = 1) denotes the probability density function for the lead time conditional on screen detection at tr.
Specifically, the probability density function is expressed as:
where for j < r, Wr = 1, β(z + ti) is age-specific sensitivity of mammography, w(x) is transition probability to the pre-clinical sojourn time, q(x) is the probability density function of the pre-clinical state and .
For invasive breast cancer, w(t) = Wi(t) + Wp(t) and q(t) follows an exponential distribution. Using the exponential properties, the following rearrangements can be made:
This leads to an enormous simplification of the P{T > S|S} formulation in (1) to:
| (2) |
The mathematical simplification in (2) does not apply to DCIS, as the current DCIS model does not assume exponential sojourn times but instead assumes more complicated expression of w(t) = Ws(t) and. q(t) = (1 − c)λe−λt and . To quantify overdiagnosis level, P{T > S|S} was estimated for invasive breast cancer based on equation (2) and for DCIS based on equation (1). For the current DCIS model, transition probability Ws(t) combines Wd(t), We(t) and Wp(t). This simplifies the lead time estimation as in invasive breast cancer. The same concept applies in Figure 2 with Sp replaced by Sdp and Sc replaced by Sdc. These probabilities were applied to the total number of screen-detected cases of invasive breast cancer or DCIS for the actual number of overdiagnosed cases. This process is repeated for different screening scenarios.
Subgroup Models and Other Updates
The original model represents an average population across all subgroups. The current model was expanded to incorporate subgroups, specifically molecular subtypes of ER and HER2 [5] and breast density [6]. In general, the same model-building principles and assumptions were applied to all subgroup models. As described in the model overview, basic model section, our model assumes that stage shifts, meaning diagnosis of disease at an earlier state by mammography, play a key role in the mortality benefits of mammography screening. If screening does not result in a stage shift, we would expect no benefit. Thus, disease stage essentially serves as a surrogate variable for determining screening effectiveness. For each subgroup, we used stage distributions for cases that were screen detected, interval detected (diagnosed between two screening examinations), and clinically diagnosed based on symptoms rather than screening. These distributions were applied to subgroup-specific baseline survival data (in the absence of screening and treatment), as described in Lee and Zelen [2], to evaluate the mortality reduction associated with screening in each subgroup.
For example, breast density subgroups were modeled as entirely fatty, scattered density, heterogeneously dense, and extremely dense [11]. For each breast density group, the stage distribution by detection mode was estimated using data collected by the Breast Cancer Surveillance Consortium (BCSC). Table 1 displays exemplar American Joint Committee on Cancer stage distributions by mode of detection for 50- to 64-year-old women undergoing annual mammography screening using digital mammography. Overall, stages shifted to an earlier state for screen-detected cases compared to clinically diagnosed cases. This stage shift was larger in the entirely fatty density group (shift of 22% to 63.5% in stage I, difference of 42%), compared to the heterogeneously dense group (shift of 19.8% to 60% in stage I, difference of 40%). This type of stage distribution data was prepared by age groups and screening intervals for each subgroup. The stage distribution data are an important input parameter for our model for evaluating the impact of screening.
Table 1.
Stage distributions as percentages by breast density and mode of detection for 50- to 64-year-old women following annual screening using digital mammography
| Density | Mode of Detection | Stage I | Stage II− | Stage II+ | Stage III | Stage IV |
|---|---|---|---|---|---|---|
| Entirely Fatty | Screen detected | 63.5 | 21.5 | 8.4 | 5.6 | 1 |
| Interval detected | 39.4 | 29.4 | 14.1 | 13.1 | 4 | |
| Clinically detected | 22 | 29.3 | 17.6 | 18.8 | 12.3 | |
| Heterogeneously Dense | Screen detected | 60 | 21.5 | 10.4 | 7.4 | < 1 |
| Interval detected | 35.8 | 28.3 | 16.8 | 16.4 | 2.6 | |
| Clinically detected | 19.8 | 27.9 | 20.8 | 23.4 | 8.1 |
As more refined subgroup model input parameters became available, we incorporated more detailed subtype-specific natural history parameters. For example, ER and HER2 status were defined as positive or negative. To reflect the more aggressive nature of ER-tumors, these tumors were given a shorter sojourn time in the invasive breast cancer pre-clinical state (mean of 1.6–3.3 years) compared to ER+ tumors (mean of 2.0–4.3 years) [6]. Subtype-specific transition rates between health states (Figure 1) were also incorporated. For example, the transition rate from pre-clinical to clinical state was 4.35-times faster for extremely dense breasts compared to entirely fatty breasts, reflecting the relative risk by breast density [23].
Treatment benefits were captured as hazard reductions applied to the baseline breast cancer survival data by ER/HER2 (in the absence of screening and treatment). Treatment types, corresponding efficacies, and dissemination patterns were updated as input data became available based on common CISNET input parameters [11].
MODEL-PROJECTED RESULTS
DCIS Incidence in SEER 1975–2010
Since Model D does not have parameters that are estimated to fit observed incidence, a comparison of model-projected DCIS incidence and observed DCIS incidence from SEER provides some validation of the DCIS model component.
We used the updated Model D with the DCIS natural history component to project US DCIS incidence rates between 1975 and 2010. Baseline DCIS incidence data in the absence of screening was modeled using the APC approach [11,21]. Mammography patterns disseminated in the United States by birth cohort [11,24] were applied to the baseline APC US DCIS incidence data in the absence of screening. Screen-detected, interval-diagnosed and clinically diagnosed DCIS cases were determined using our natural history model. Figure 3 displays observed and projected DCIS incidence between 1975 and 2010. Model-projected DCIS incidence data were very close to actual observed SEER data. In particular, the model-predicted incidence rate was most accurate for the age group 40–79 years (Figure 3b–e). Therefore, the newly adopted DCIS natural history model and model parameters appear to be a sensible choice. The results validate the updates to Model D for accurately estimating the impact of breast cancer screening on DCIS incidence.
Figure 3.
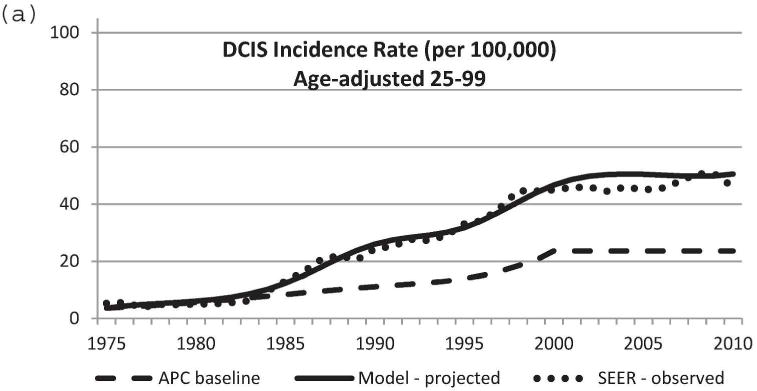
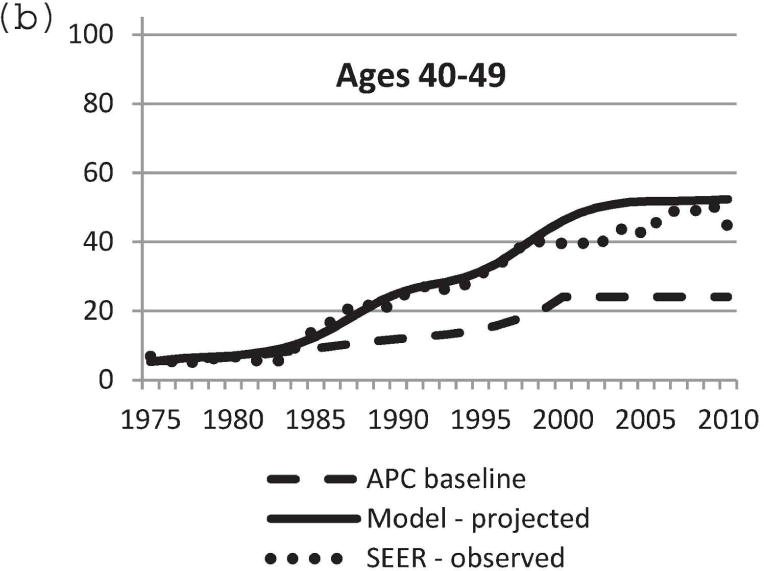
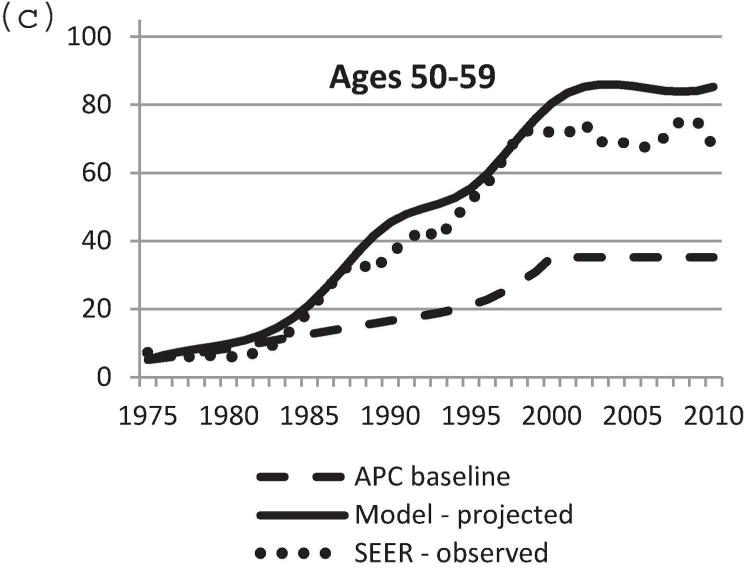
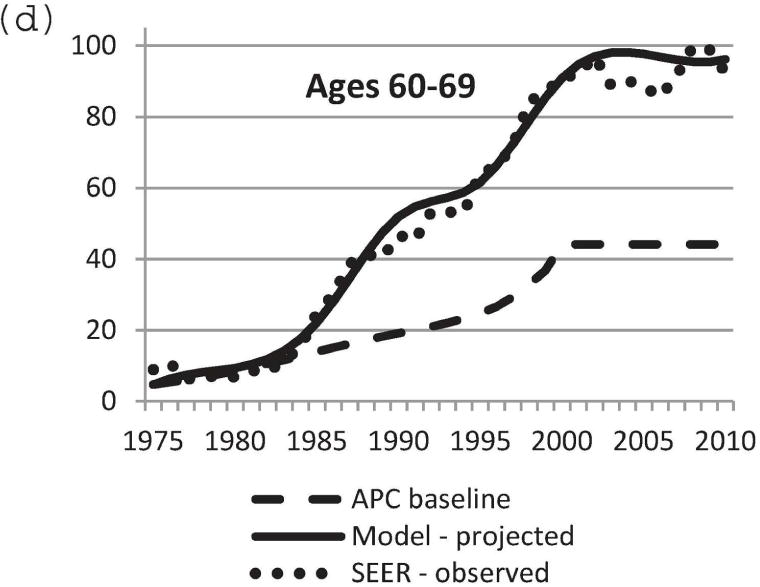
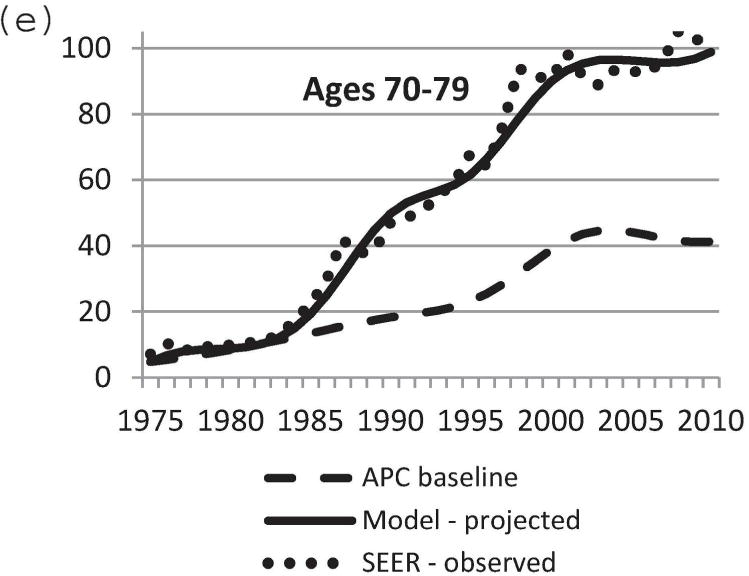
Comparison of model-projected and SEER-observed DCIS incidence. (a) age-adjusted (25–99 years) using the 2000 US standard population; (b)–(e) age-specific rates. Model-projected DCIS incidence data, solid line; SEER data, dotted line; APC-baseline data, dashed line. SEER, Surveillance, Epidemiology and End Results; DCIS, ductal carcinoma in situ; APC, age-period-cohort.
Overdiagnosis
For overdiagnosis, when lead time is greater than residual survival, we formulated the probability of overdiagnosis conditional on age at detection. We used the lifetable of the 1970 birth cohort for residual survival [7]. For invasive cancer, we used the age-dependent mean sojourn time in the preclinical state of 2–4 years (shorter mean sojourn time for women of younger age). The probability of overdiagnosis for invasive breast cancer conditional on age at screen detection clearly increased with age at diagnosis (Figure 4). However, the probability of overdiagnosis for invasive breast cancer was relatively small until older age. For example, probability was below 0.2 until age 83.
Figure 4.
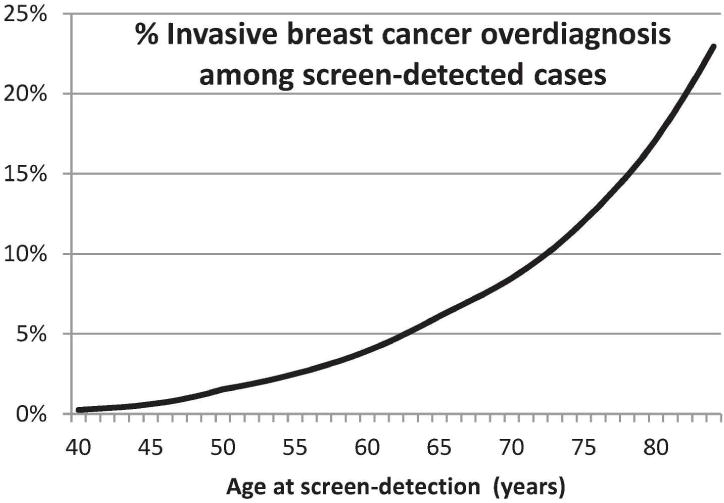
Percentage of invasive breast cancer cases that are overdiagnosed by age at screen detection.
Using the new DCIS natural history components of the model, lead time was evaluated for DCIS and applied to estimate the probability of overdiagnosis for screen-detected DCIS. This was a complex evaluation because the calculation depended on screening schedule, natural history of DCIS, mammography sensitivity, and other model parameters. Nonetheless, the results showed that the overall level of overdiagnosis had less age dependency than overdiagnosis estimates for invasive breast cancer. In addition, we estimated that, across all age groups, 30–50% of cases of screen-detected DCIS represented overdiagnosis. This estimate did not vary much by screening scenarios [8].
SUMMARY
In this chapter, we presented an updated Model D for early detection of breast cancer. The main update to the model was the addition of DCIS. As described in the DCIS overview chapter [8], the natural history of DCIS is complex and identifying a uniquely correct DCIS natural history model is difficult. Contributing factors to the challenge are uncertainty about the natural history of DCIS, wide variation in data used for model specifications and assumptions, and variation in model parameters. Exploring plausible models and model parameters is critical for developing accurate detection estimates for DCIS. Our model with combined transition probabilities presented here led to a good match to observed SEER data. We will continue to improve our model by refining model parameters for each specified path in Figure 1. We also plan to explore other plausible DCIS natural history models. One potential improvement is including transitions from Sdc to Sp or Sc, and/or to Sd. In particular, the addition of transitions from Sdc to Sd allows relaxing the model assumption of no breast cancer deaths for individuals in Sdc.
We used our updated model to estimate overdiagnosis, which for invasive breast cancer we defined as a lead time longer than the person’s remaining lifetime, given the age of diagnosis. This formulation directly addressed the most relevant issue in overdiagnosis of invasive breast cancer: dying of a cause other than breast cancer. For DCIS, lead time definition is complicated because DCIS can progress to clinical DCIS or invasive cancer, or regress. Therefore, overdiagnosis of DCIS is likely to occur when a person dies from a cause other than breast cancer or the DCIS regresses. Despite uncertainty in the DCIS natural history model, which makes quantifying overdiagnosis from DCIS challenging, our results suggested that a large proportion (30–50%) of screen-detected cases of DCIS may represent overdiagnosis.
Updates to include DCIS, breast density, and ER and HER2 status have made Model D, our stochastic analytical model of early breast cancer detection, more versatile. We used the model to quantify overdiagnosis of invasive breast cancer and DCIS. We demonstrated that our model is flexible and adaptable for analysis of specific breast cancer subgroups. As Model D is uniquely analytical, it allows straightforward derivations of analytical expressions for screening-related measures such as overdiagnosis to fully evaluate the impact of mammography screening.
Acknowledgments
This work was supported entirely by the National Institutes of Health under National Cancer Institute Grants U01CA199218, U01CA152958, and R01CA165301. Collection of Breast Cancer Surveillance Consortium (BCSC) data was supported by National Cancer Institute-funded grants P01CA154292 and U54CA163303 and contract HHSN261201100031C. The funding agreement ensured the authors’ independence in designing the study, interpreting the data, writing, and publishing the report.
Contributor Information
Sandra J. Lee, Department of Biostatistics and Computational Biology, Dana-Farber Cancer Institute and Harvard Medical School and in the Department of Biostatistics, Harvard T.H. Chan School of Public Health, Boston, Massachusetts, USA
Xiaoxue Li, Department of Biostatistics and Computational Biology, Dana-Farber Cancer Institute and in the Department of Biostatistics, Harvard T.H. Chan School of Public Health, Boston, Massachusetts, USA
Hui Huang, Department of Biostatistics and Computational Biology, Dana-Farber Cancer Institute, Boston, Massachusetts, USA
Marvin Zelen, Department of Biostatistics, Harvard T.H. Chan School of Public Health, Boston, Massachusetts, USA
References
- 1.Lee SJ, Zelen M. Scheduling periodic examinations for the early detection of disease: applications to breast cancer. J Am Stat Assoc. 1998;93:1271–1281. [Google Scholar]
- 2.Lee SJ, Zelen M. A stochastic model for predicting the moartlity of breast cancer. J Natl Cancer Inst Monogr. 2006;36:79–86. doi: 10.1093/jncimonographs/lgj011. [DOI] [PubMed] [Google Scholar]
- 3.Lee SJ, Zelen M. Mortality modeling of early detection program. Biometrics. 2008;64(2):386–395. doi: 10.1111/j.1541-0420.2007.00893.x. [DOI] [PubMed] [Google Scholar]
- 4.van Ravesteyn NT, Miglioretti DL, Stout NK, Lee SJ, Schechter CB, Buist DS, Huang H, Heijnsdijk EA, Trentham-Dietz A, Alagoz O, Near AM, Kerlikowske K, Nelson HD, Mandelblatt JS, de Koning HJ. Tipping the balance of benefits and harms to favor screening mammography starting at age 40 years: a comparative modeling study of risk. Ann Intern Med. 2012 May 1;156(9):609–17. doi: 10.1059/0003-4819-156-9-201205010-00002. [DOI] [PMC free article] [PubMed] [Google Scholar]
- 5.Stout NK, Lee SJ, Schechter CB, Kerlikowske K, Alagoz O, Berry D, Buist DS, Cevik M, Chisholm G, de Koning HJ, Huang H, Hubbard RA, Miglioretti DL, Munsell MF, Trentham-Dietz A, van Ravesteyn NT, Tosteson AN, Mandelblatt JS. Benefits, harms, and costs for breast cancer screening after US implementation of digital mammography. J Natl Cancer Inst. 2014 May 28;106(6) doi: 10.1093/jnci/dju092. [DOI] [PMC free article] [PubMed] [Google Scholar]
- 6.Munoz D, Near AM, van Ravesteyn NT, Lee SJ, Schechter CB, Alagoz O, Berry DA, Burnside ES, Chang Y, Chisholm G, de Koning HJ, Ali Ergun M, Heijnsdijk EA, Huang H, Stout NK, Sprague BL, Trentham-Dietz A, Mandelblatt JS, Plevritis SK. Effects of screening and systemic adjuvant therapy on ER-specific US breast cancer mortality. J Natl Cancer Inst. 2014 Sep 24;106(11) doi: 10.1093/jnci/dju289. [DOI] [PMC free article] [PubMed] [Google Scholar]
- 7.Mandelblatt JS, Stout NK, Schechter CB, van den Broek JJ, Miglioretti DL, Krapcho M, et al. Collaborative Modeling of the Benefits and Harms Associated With Different U.S. Breast Cancer Screening Strategies. Ann Intern Med. 2016;164(4):215–25. doi: 10.7326/M15-1536. [DOI] [PMC free article] [PubMed] [Google Scholar]
- 8.van Ravesteyn N, van den Broek J, Li X, Weedon-Fekjaer H, Schechter CB, Alagoz O, Weaver D, Brubside E, Pinglia R, de Koning HJ, Lee SJ. Modeling ductal carcinoma in situ (DCIS) – an overview of CISNET model approaches. Medical Decision Making Monographs. 2017 doi: 10.1177/0272989X17729358. [DOI] [PMC free article] [PubMed] [Google Scholar]
- 9.American Cancer Society. Cancer Facts and Figures 2015. Atlanta: American Cancer Society Inc; 2015. [Google Scholar]
- 10.Esserman L, Yau C. Rethinking the standard for ductal carcinoma in situ treatment. JAMA oncology. 2015 Oct;1(7):881–3. doi: 10.1001/jamaoncol.2015.2607. [DOI] [PubMed] [Google Scholar]
- 11.Mandelblatt J, Near A, Miglioretti DL, Munoz D, Sprague B, Trentham-Dietz A, Gangnon A, Kurian A, Weedon-Fekjar H, Cronin K, Plevritis SK. Common Model Inputs in Collaborative Breast Cancer Modeling. Medical Decision Making Monographs. 2017 doi: 10.1177/0272989X17700624. [DOI] [PMC free article] [PubMed] [Google Scholar]
- 12.Luke C, Priest K, Roder D. Changes in incidence of in situ and invasive breast cancer by histology type following mammography screening. Asian Pac J Cancer Prev. 2006 Jan-Mar;7(1):69–74. [PubMed] [Google Scholar]
- 13.Nagi CS, O’Donnell JE, Tismenetsky M, Bleiweiss IJ, Jaffer SM. Lobular neoplasia on core needle biopsy does not require excision. Cancer. 2008 May 15;112(10):2152–8. doi: 10.1002/cncr.23415. [DOI] [PubMed] [Google Scholar]
- 14.Eheman CR, Shaw KM, Ryerson AB, Miller JW, Ajani UA, White MC. The changing incidence of in situ and invasive ductal and lobular breast carcinomas: United States, 1999–2004. Cancer Epidemiol Biomerkers Prev. 2009 Jun;18(6):1763–9. doi: 10.1158/1055-9965.EPI-08-1082. [DOI] [PubMed] [Google Scholar]
- 15.Ward EM, DeSantis CE, Lin CC, Kramer JL, Jemal A, Kohler B, Brawley OW, Gansler T. Cancer statistics: Breast cancer in situ. CA Cancer J Clin. 2015;65(6):481–495. doi: 10.3322/caac.21321. [DOI] [PubMed] [Google Scholar]
- 16.Lee SJ, Zelen M. Modeling the early detection of breast cancer. Ann Oncol. 2003;14:1199–1202. doi: 10.1093/annonc/mdg323. [DOI] [PubMed] [Google Scholar]
- 17.Zelen M, Feinleib M. On the theory of screening for chronic diseases. Biometrika. 1969;56:601–14. [Google Scholar]
- 18.Shen Y, Zelen M. Screening sensitivity and sojourn time from breast cancer early detection trials: mammograms and physical examinations. J Clin Oncol. 2001;19:3496–3499. doi: 10.1200/JCO.2001.19.15.3490. [DOI] [PubMed] [Google Scholar]
- 19.Berkson J, Gage RP. Survival Curve for Cancer Patients Following Treatment. J Am Stat Assoc. 1952;47(259):501–15. [Google Scholar]
- 20.Holford TR, Cronin KA, Mariotto AB, Feuer EJ. Changing patterns in breast cancer incidence trends. J Natl Cancer Inst Monogr. 2006;36:19–25. doi: 10.1093/jncimonographs/lgj016. [DOI] [PubMed] [Google Scholar]
- 21.Gangnon RE, Sprague BL, Stout NK, Alagoz O, Weedon-Fekjaer H, Holfold TR, Trentham-Dietz A. The contribution of mammography screening to breast cancer incidence trends in the United States; an updated age-period-cohort model. Cancer Epidemiol Biomarkers Prev. 2015 Jun;24(6):905–12. doi: 10.1158/1055-9965.EPI-14-1286. [DOI] [PMC free article] [PubMed] [Google Scholar]
- 22.Hofvind Geller B, Vacek PM, Thoresen S, Skaane P. Using the European guidelines to evaluate the Norwegian Breast Cancer Screening Program. Eur J Epidemiol. 2007;22(7):447–55. doi: 10.1007/s10654-007-9137-y. [DOI] [PubMed] [Google Scholar]
- 23.Vacek PM, Geller BM. A prospective study of breast cancer risk using routine mammographic breast density measurements. Cancer Epidemiol Biomarkers Prev. 2004;13(5):715–22. [PubMed] [Google Scholar]
- 24.Cronin KA, Mariotto AB, Clarke LD, Feuer E. Additional common input for analyzing impact of adjuvant therapy and mammography on U.S mortality. J Natl Cancer Inst Monogr. 2006;36:26–29. doi: 10.1093/jncimonographs/lgj005. [DOI] [PubMed] [Google Scholar]


