Abstract
Current density distribution and projected current density calculation following transcranial direct current stimulation (tDCS) forward model in a human head were compared between two modeling pipelines: block and smooth. Block model was directly constructed from MRI voxel resolution and simulated in C. Smooth models underwent a boundary smoothing process by applying recursive Gaussian filters and simulated in COMSOL. Three smoothing levels were added to determine their effects on current density distribution compared to block models. Median current density percentage differences were calculated in anterior superior temporal gyrus (ASTG), hippocampus (HIP), inferior frontal gyrus (IFG), occipital lobes (OCC) and precentral gyrus (PRC) and normalized against a baseline value. A maximum of ± 20% difference in median current density was found for three standard electrode montages: F3-RS, T7-T8 and Cz-Oz. Furthermore, median current density percentage differences in each montage target brain structures were found to be within ± 7%. Higher levels of smoothing increased median current density percentage differences in T7-T8 and Cz-Oz target structures. However, while demonstrating similar trends in each montage, additional smoothing levels showed no clear relationship between their smoothing effects and calculated median current density in the five cortical structures. Finally, relative L2 error in reconstructed projected current density was found to be 17% and 21% for block and smooth pipelines, respectively. Overall, a block model workflow may be a more attractive alternative for simulating tDCS stimulation because involves a shorter modeling time and independence from commercial modeling platforms.
I. Introduction
Current density distributions inside the human head are modeled to predict effects of non-invasive brain stimulation therapies such as transcranial direct current stimulation (tDCS). Because it has not been possible to measure tDCS-related current density distributions, there have been many finite element (FE) studies predicting field distributions inside the head as a result of tDCS treatment [1–7]. Constructing a high-resolution finite element head model is a time consuming process, typically involving days of automatic and manual processing for complex models [2, 5, 7]. If multiple subject specific models are to be created, the efficiency of this process must be maximized. For instance, creation of a block model directly from segmented MRI voxels could reduce modeling time by two to three times while producing less than 15% median current density differences in tDCS target structures. [8]. There now exist methods for in vivo measurement of current distributions caused by tDCS by using MRI to measure magnetic fields (Bz) resulting from tDCS administration [9]. In this context, FE modeling can be validated against these experimental measures. FE models are also used as a priori information in reconstructions of conductivity and current density using these methods. For example, one way to reconstruct conductivity from Bz information is by calculating projected current density (PCD) [10]. Here we present a further comparison between block and smooth process by including a normalization process, additional smoothing levels and PCD calculations.
II. Methods
Simulated head models were constructed from MRI T1-weighted data that was segmented into ten tissue types. Current density was calculated following two workflows: block and smooth. Block models were defined directly from MRI segmentations while smooth models were constructed by applying Gaussian smoothing filters to these segmentations, followed by an automated mesh generation. Three increasing levels of smoothing were simulated and compared with the block model. For each model type, three standard tDCS electrode configurations named F3-RS, T7-T8 and Cz-Oz (following the 10–20 EEG nomenclature) were modeled. The first named electrode in each montage pair was used as the current injection site with a current magnitude of 1 mA and the cathode was grounded. While all segmentation steps were the same in two workflows, block models were solved using in-house C code, and smoothed models were pre-processed to meshes using ScanFE (Simpleware, Exeter UK) and then simulated in COMSOL (Comsol Inc., Burlington, MA). Projected current densities were then calculated from simulated Bz and voltage values derived from each model. The following subsections describe further details of our modeling process.
A. Head model segmentation and conductivity assignments
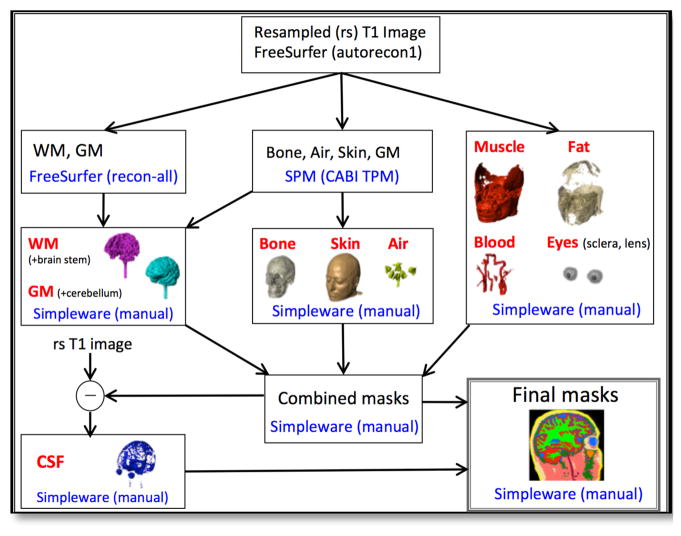
T1-weighted MRI data from a single subject head, spanning from head apex down to the C3 vertebra, was acquired using a 3T Achieva Phillips MRI scanner housed in the McKnight Brain Institute, University of Florida. Prior to segmentation, the T1-data were resampled to an isotropic resolution of 1 mm3 and FOV of 25.6 cm in all three axis directions. Automatic segmentations of white and gray matter were completed in Freesurfer (Cambridge, MA). Bone, air and skin masks were produced in SPM12 (Wellcome Trust Centre for Neuroimaging, London, UK) with an improved tissue probability map developed at CABI [2]. Manual segmentations of CSF, fat, muscle, eyes, blood and corrections to automatic segmented masks output were completed in ScanIP (Simpleware, Exeter, UK). Isotropic conductivities were assigned to each tissue type following referenced value listed in Table 1. The overall segmentation pipeline is summarized in Figure 2.
TABLE I.
Tissue conductivity values for each tissue for frequency less than 1 kHz. asteriks indicates average conductivity values
| Tissue types | Conductivity values (S/m) | Reference |
|---|---|---|
| Air | 0 | - |
| Blood | 6.7×10⁻¹ | Geddes and Baker (1967) |
| Bone | 1.09×10⁻² | Akhtari et al. (2002) |
| Cerebrospinal fluid | 1.8 | Baumann et al. (1997) |
| Fat | 2.5×10⁻² | Gabriel et al. (1996) |
| Gray matter | 1.0×10⁻¹ | Gabriel et al. (1996) |
| Muscle | 1.6×10⁻¹ | Geddes and Baker (1967) |
| Sclera, lens | 5.0×10⁻¹ | Gabriel et al. (1996) |
| Skin | 4.3×10⁻¹ | Holdefer et al. (2006) |
| White matter | 3.835 ×10⁻¹ | Geddes and Baker (1967) |
Figure 2.
A segmentation pipeline to seperate a single human head model into ten tissue compartments (red fonts).
B. Block and smooth model workflow
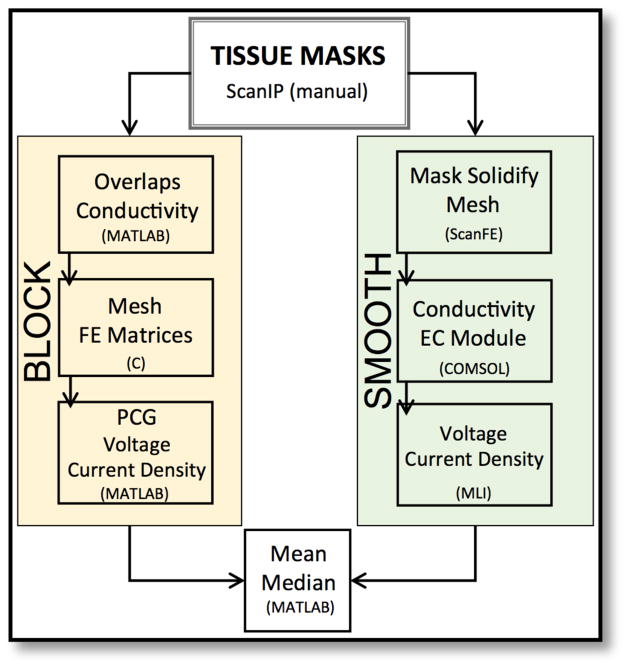
Individual masks obtained at the end of the segmentation pipeline described in Figure 2 were then subjected to separate workflows as shown in Figure 3. The FE simulation satisfied the Laplace equation and solved a mixed boundary value problem and had both Neumann and Dirichlet conditions, such that
Figure 3.
Two distinct simulation workflow for block (left) and smooth (right) models.
| (1) (2) |
where J was the current density and n was the unit normal vector, ε+ and ε− were anode and cathode surface electrodes, respectively. For block models, tissue overlaps were eliminated then stiffness and boundary condition matrices following Galerkin equations were assembled in C [11]. The solution of these matrices was solved in MATLAB by using pre-conjugate method. For smooth models, all tissue masks were first dilated to ensure no gaps in between tissue boundaries (mask solidifying step). Next, tissue masks were added as active models in ScanFE to generate volume meshes and exported to COMSOL. Tissue conductivity assignments, boundary condition definitions and FE simulations were then completed in COMSOL.
C. Model verification
A simple box test was performed to verify that the comparison between the complex head models was solely affected by differences in the block versus smooth workflow. A 10 × 10 × 6 cm box was constructed along with two 8 × 4 cm electrodes placed on the either side of the box. The conductivity of box and the electrode pair was equal to 1, and 1 mA current was injected in one of the electrodes. We ran the box model following both workflows defined in Figure 2 and compared the voltage distribution to calculate resistancedrop across the electrodes as our baseline value. Voltage drop across the electrodes was found to be 0.182 V and 0.159 V for block and smoothed models, respectively. This factor was used to normalize resistance drop across electrodes in all models evaluated in this study.
D. Smoothed model specifications
Models with four increasing levels of smoothness were compared against the block model results. An initial smoothing was performed in ScanIP by applying a recursive Gaussian smoothing filter with 1 pixel distance in x, y and z to all tissue masks. Additional smoothing of second, third and tenth degrees were performed by repeating the same filter application, 1 pixel at a time.
E. Cortical regions calculations
Median normal current density was calculated in each of the following structures: anterior superior temporal gyrus (ASTG), inferior frontal gyrus (IFG), and occipital lobes (OCC), hippocampus (HIP) and pre-central gyrus (PRC). Percentage differences between block and smooth models were computed and normalized against a baseline value obtained in model verification test.
F. Projected current density reconstruction
Bz calculation was performed in C++ and MATLAB by converting simulated Jx and Jy via a Fourier Transform implementation of the Bio-Savart law. Projected current density was then calculated from simulated Bz along with the calculated Bz and voltage from uniform head model following methods described by Kwon, et al [10]. A relative L2 error was used to quantify differences between PCD and simulated current density. Uniform head model conductivity was determined based on an iterative method of which conductivity value produced the smallest L2 error.
III. Results
The following subsections summarize results for block and smooth models comparisons. Median values in target structures were compared between models.
A. Median current density in selected cortical regions
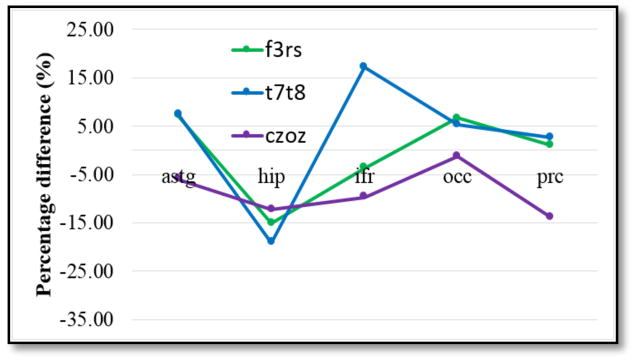
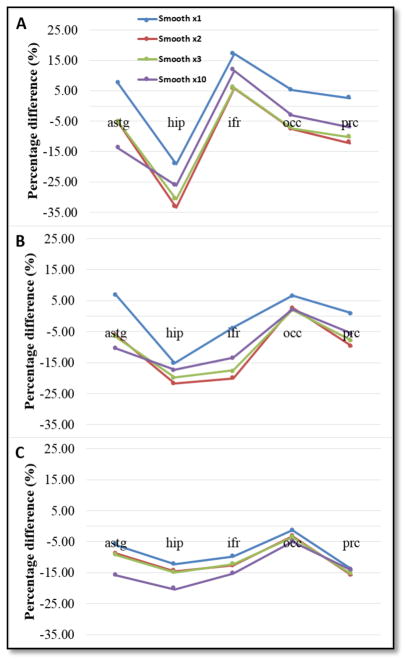
Figure 4 and 5 below show normalized median current density calculated in presumed target cortical structures: ASTG (anterior superior temporal gyrus), HIP (hippocampus), IFR (inferior frontal gyrus), OCC (occipital lobe) and PRC (precentral gyrus) for all three montages. Figure 4 shows the effects of additional smoothing steps specified as smooth x1, x2, x3 and x10. Note that percentage differences presented in Figure 3 were in the range of ±20% and in Figure 4 were in the range of ±35%.
Figure 4.
Normalized median current density in all three montages.
Figure 5.
Normalized median current density for all four cases of smoothing levels for a) T7-T8 b) F3-RS and c) Cz-Oz montage.
B. Projected current density calculation
Varying conductivity values for the uniform model showed that the relative L2 error between PCD and simulated current density decreased as the uniform conductivity was increased. Based on this test, a uniform conductivity of 1.8 S/m was chosen as a basis for PCD calculation in both modeling pipelines. Calculated relative L2 errors in block and smooth were found to be 18% and 21%, respectively.
IV. Discussion
Normalized median current density percentage differences were found in the range of ±20% for the initial smoothing case and increased up to ±35% when additional smoothing was added. There was no clear relationship between additional smoothing and median percentage difference results., We noted that each montage’s target structure showed the smallest percentage differences in median current densities between different models, averaging around of ±7%. For example, ASTG was the target structure for T7-T8 montage, and the median percentage difference for the first level of smooth model was 7%. This difference changed to −14% after the tenth level of smoothing. Median current density percentage decreased from 2% to −20% for the first and second level of smoothing in the IFR targeting F3-RS montage, but increased to −13% for tenth level of smoothing. In terms of projected current density reconstructions, relative L2 errors were found to be 18% and 21% for block and smooth models, respectively, which were in the range of errors reported in a previous study by Kwon et al [10]. The largest relative L2 errors for both modeling pipelines were found in the model periphery, followed by tissue boundaries, specifically white and gray matter, as well as CSF and gray matter. Because creation of smooth boundaries between tissue types did not improve relative L2 error between PCD and simulated current density values, we concluded that block FE modeling is an adequate basis for simulating tDCS and, more importantly, to improve modeling efficiency.
Figure 1.
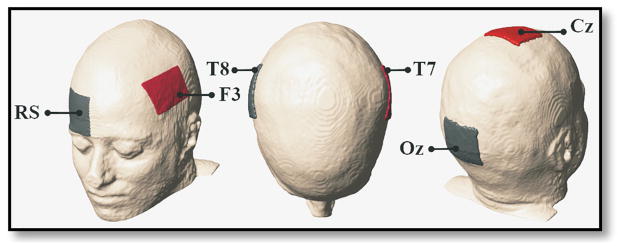
Electrode configurations used in block and smooth models consist of: F3-right supraorbital (RS), T7-T8 and Cz-Oz shown from left to right. Red and gray electrodes represent anode and cathode, respectively.
Acknowledgments
Research reported in this publication was supported by the NIH under award number R21INS081646 to RJS.
Footnotes
Research supported by NIH Grant award number R21INS081646 to RJS.
Contributor Information
Aprinda Indahlastari, Arizona State University, Tempe, AZ 85281, USA, +1 651 815-3893.
Munish Chauhan, Arizona State University, Tempe, AZ 85281, USA, +1 480 799-6611.
Rosalind J. Sadleir, Arizona State University, Tempe, AZ 85281, USA, +1 480 727-9790.
References
- 1.Bikson M, Rahman A, Datta A. Computational Models of Transcranial Direct Current Stimulation. Clinical EEG and Neuroscience. 2012 Jul;43(3):176–183. doi: 10.1177/1550059412445138. [DOI] [PubMed] [Google Scholar]
- 2.Huang Y, Dmchowski JP, Su Y, Datta A, Rorden C, Parra LC. Automated MRI segmentation for individualized modeling of current flow in the human head. J of Neural Engineering. 2013 Oct;10 doi: 10.1088/1741-2560/10/6/066004. [DOI] [PMC free article] [PubMed] [Google Scholar]
- 3.Neuling T, Wagner S, Wolters CH, Zaehle T, Herrmann CS. Finite-element model predicts current density distribution for clinical applications of tDCS and tACS. Frontiers in Psychiatry. 2012 Sep; doi: 10.3389/fpsyt.2012.00083. [DOI] [PMC free article] [PubMed] [Google Scholar]
- 4.Sadleir RJ, Vannorsdall TD, Schretlen DJ, Gordon B. Target optimization in transcranial direct current stimulation. Frontiers in Psychiatry. 2012 Oct; doi: 10.3389/fpsyt.2012.00090. [DOI] [PMC free article] [PubMed] [Google Scholar]
- 5.Rampersad SM, Janssen AM, Lucka F, Aydin U, Lanfer B, Lew S, Wolters CH, Stegeman DF, Oostendorp TF. Simulating Transcranial Direct Current Stimulation With a Detailed Anisotropic Human Head Model. IEEE Trans on Neural Systems and Rehabilitation Engineering. 2014 May;22(3) doi: 10.1109/TNSRE.2014.2308997. [DOI] [PubMed] [Google Scholar]
- 6.Sadleir RJ, Vannorsdall TD, Schretlen DJ, Gordon B. Transcranial direct current stimulation (tDCS) in a realistic head model. J Neuroimage. 2010 Jul;51 doi: 10.1016/j.neuroimage.2010.03.052. [DOI] [PubMed] [Google Scholar]
- 7.Dannhauer M, Brooks D, Tucker D, Macleod R. A pipeline for the Simulation of Transcranial Direct Current Stimulation for Realistic Human Head Models using SCIRun/BioMesh3D. IEEE Eng Med Biol Soc. 2012 doi: 10.1109/EMBC.2012.6347236. [DOI] [PMC free article] [PubMed] [Google Scholar]
- 8.Indahlastari A, Sadleir RJ. A comparison between block and smooth modeling in finite element simulations of tDCS. Engineering in Medicine and Biology Society (EMBC), 2015 37th Annual International Conference of the IEEE; Milan. 2015; pp. 3403–3406. [DOI] [PMC free article] [PubMed] [Google Scholar]
- 9.Kim HJ, Oh TI, Kim YT, Lee BI, Woo EJ, Seo JK, Lee SY, Kwon O, Park C, Kang BT, Park HM. In vivo electrical conductivity imaging of a canine brain using a 3T MREIT system. Physiol Meas. 2008 Sep;29 doi: 10.1088/0967-3334/29/10/001. [DOI] [PubMed] [Google Scholar]
- 10.Kwon OI, Sajib SZK, Sersa I, Oh TI, Jeong WC, Kim HJ, Woo EJ. Current Density Imaging during Transcranial Direct Current Stimulation (tDCS) using DT-MRI and MREIT: Algorithm Development and Numerical Simulations. IEEE Trans on Biomedical Engineering. 2015;22 doi: 10.1109/TBME.2015.2448555. [DOI] [PubMed] [Google Scholar]
- 11.Davies AJ. The finite element method: a first approach. Clarendon Press; Oxford: 1980. [Google Scholar]


