Abstract
Purpose
To determine the relationship between diffusion-weighted imaging (DWI) and diffusion kurtosis imaging (DKI) in patients with acute stroke at admission and the tissue outcome 1 month after onset of stroke.
Materials and Methods
Patients with stroke underwent DWI (b values = 0, 1000 sec/mm2 along three directions) and DKI (b values = 0, 1000, 2000 sec/mm2 along 20 directions) within 24 hours after symptom onset and 1 month after symptom onset. For large lesions (diameter ≥ 1 cm), acute lesion volumes at DWI and DKI were compared with those at follow-up T2-weighted imaging by using Spearman correlation analysis. For small lesions (diameter < 1 cm), the number of acute lesions at DWI and DKI and follow-up T2-weighted imaging was counted and compared by using the McNemar test.
Results
Thirty-seven patients (mean age, 58 years; range, 35–82 years) were included. There were 32 large lesions and 138 small lesions. For large lesions, the volumes of acute lesions on kurtosis maps showed no difference from those on 1-month follow-up T2-weighted images (P = .532), with a higher correlation coefficient than those on the apparent diffusion coefficient and mean diffusivity maps (R2 = 0.730 vs 0.479 and 0.429). For small lesions, the number of acute lesions on DKI, but not on DWI, images was consistent with that on the follow-up T2-weighted images (P = .125).
Conclusion
DKI complements DWI for improved prediction of outcome of acute ischemic stroke.
© RSNA, 2018
Introduction
Recent clinical trials have convincingly demonstrated endovascular therapy to be highly beneficial compared with tissue plasminogen activator alone, particularly at extended time of stroke onset (1–4). To minimize hemorrhage risk and futile recanalization, the infarction core volume is often used as one of the imaging exclusion criteria for endovascular therapy (5,6). It has been shown that prospective classification according to infarction core volume by using diffusion-weighted magnetic resonance (MR) imaging and clinical criteria is associated with a higher likelihood of favorable thrombectomy outcome (7). With the advancement of more effective endovascular treatment options for late recanalization, it has become increasingly important to properly identify the extent of the infarction core to evaluate the treatment effect and to ultimately better guide patient care.
Diffusion-weighted imaging (DWI) is sensitive in depicting acute ischemia and has been used for imaging the irreversibly damaged infarction core (8). Several penumbral assessment paradigms have been practiced, built on the assumption that the lesion on DWI images approximates the infarction core, including perfusion-DWI, MR angiography–DWI, and clinical-DWI mismatches (9–14). While DWI is highly sensitive to ischemic insult, its specificity in depicting the infarction core has been questioned. It has been demonstrated that the regions of lowered apparent diffusion coefficient (ADC) experience graded metabolic derangement and include not only the ischemic core but also potentially salvageable penumbral tissue (15,16). Multiple studies have documented DWI reversibility following recanalization, even in some cases of large lesions on DWI images (17–21). Unfortunately, the severity of ADC change could not differentiate potentially salvageable lesion at DWI from irreversibly damaged infarction core, and new imaging approaches are needed (22,23).
The routine DWI analysis assumes that water molecules follow a Gaussian diffusion profile. This assumption, strictly speaking, applies only to the case of unrestricted diffusion and is crude for modeling in vivo diffusion measurement (24,25). To address this challenge, diffusion kurtosis imaging (DKI) measures not only the commonly used diffusion rate, but also the peakedness (ie, kurtosis) for describing the deviation from Gaussian profile (25–27). Experimental stroke studies have shown that the kurtosis-based lesion is smaller than the DWI-based lesion; the kurtosis lesion was shown not to be responsive to early reperfusion, while the kurtosis-diffusion lesion mismatch often reverses following recanalization (28–30). This suggests that the kurtosis-based lesion captures the most severely injured portion of the DWI-based lesion, while the part of the DWI-based lesion without kurtosis abnormality appears to have less injury.
Our study aimed to determine the relationship between DWI and DKI in patients with acute stroke at admission and the tissue outcome 1 month after the stroke onset.
Materials and Methods
Patients
This study was approved by the institutional review board, and all patients signed informed consent forms. The inclusion criteria were (a) adult, at least 20 years old; (b) clear onset time of stroke attack; (c) the first MR imaging examination within 24 hours after symptom onset; (d) follow-up MR imaging 1 month later; (e) clinical National Institutes of Health Stroke Scale scores assessed by a neurologist (Z.W. with more than 20 years of experience in neurology) before MR imaging examinations.
Exclusion criteria were (a) MR imaging contraindications or claustrophobia; (b) chronic or insidious or unknown onset of stroke attack; (c) thrombolytic therapy; (d) motion artifacts on MR images; (e) patients with cerebral hemorrhage, brain tumors, degenerative brain diseases, craniocerebral trauma, post-craniocerebral operation, dyspnea, coma, or other systemic diseases.
Forty consecutive patients with acute ischemic stroke were recruited between July 2015 and January 2017. Two patients were excluded for head motion and one for thrombolytic therapy; therefore, 37 patients (28 men and nine women; mean age, 58 years; age range, 35–82 years) were included in the data analysis.
MR Protocol
All imaging examinations were performed by using a 3-T Siemens Trio imager with an eight-channel head coil (Siemens Healthineers, Erlangen, Germany), including DWI, DKI, T1-weighted, and T2-weighted sequences. Briefly, DWI was performed by using a single-shot echo-planar imaging sequence with two b values of 0 and 1000 sec/mm2; three diffusion directions; 20 axial sections; repetition time msec/echo time msec, 4300/92; section thickness, 5.0 mm; gap, 1.25 mm; in-plane resolution, 1.2 × 1.2 mm2; matrix, 180 × 180; three acquisitions; and parallel acquisition technique (PAT) factor, 2. The imaging time of DWI was 1 minute 6 seconds. DKI was measured by using multiband diffusion echo-planar imaging sequences with three b values of 0, 1000, and 2000 sec/mm2; 20 diffusion directions; 20 axial sections; 3300/95; section thickness, 5.0 mm; gap, 1.25 mm; in-plane resolution, 1.6 × 1.6 mm2; matrix, 146 × 146; two acquisitions; and multiband accelerated factor, 2. The imaging time of DKI was 2 minutes 10 seconds. In addition, an inversion recovery T1-weighted imaging was performed with 20 axial sections; 2510/9; inversion time (msec), 1038; section thickness, 5.0 mm; gap, 1.25 mm; in-plane resolution, 0.9 × 0.7 mm2; matrix, 240 × 320; and PAT factor, 2. T2-weighted imaging was performed with 20 axial sections; 5000/93; section thickness, 5.0 mm; gap, 1.25 mm; in-plane resolution, 0.7 × 0.7 mm2; matrix, 320 × 320; and PAT factor, 2. The imaging times of T1-weighted and T2- weighted imaging were 1 minutes 47 seconds and 1 minute 2 seconds, respectively.
Data Analysis
The DKI Digital Imaging and Communications in Medicine data were converted to the NIfTI format (FMRIB Software Library, http://www.fmrib.ox.ac.uk/fsl/). Images were then processed for motion correction, eddy current correction, and Gaussian smoothing noise reduction. ADC maps were calculated from the standard DWI postprocessing routines. The mean diffusivity (MD) and mean kurtosis (MK) maps were derived from diffusional kurtosis estimator software (https://www.nitrc.org/projects/dke/). To compare the signal change on ADC, MD, and MK maps, one region of interest was manually outlined at the largest section of the acute lesions in each patient by using MRIcron (https://www.nitrc.org/projects/mricron). The regions of interest were mirrored to the normal-appearing contralateral hemisphere and used as the reference. The percentage change of diffusion metrics from their contralateral normal values was calculated as (ipsilateral value − reference value)/reference value × 100%.
All ischemic lesions were divided into two groups, based on their size. If the maximal diameter of the lesion was equal to or larger than 1 cm, we defined it as a large lesion; for lesions with maximal diameter of less than 1 cm, we defined them as small lesions. For large lesions (maximal diameter ≥1 cm), the lesions were manually drawn on each section of acute ADC, MD, and MK maps, as well as on the 1-month follow-up T2-weighted images, by using Image-J (https://imagej.nih.gov/ij/). The volume of the abnormal area of each parameter map was calculated as follows: sum of abnormal areas of all sections × (thickness + interval). For small lesions (maximal diameter <1 cm), the number of lesions on ADC, MD, and MK maps and on the final T2-weighted images was counted.
Signal measurements, volume outlines, and lesion counting were independently assessed by two radiologists (H.S. with 3 years of experience in radiology and a second radiologist with 2 years of experience in radiology). The results were reviewed by a third radiologist (J.Y.) with over 15 years of experience in neuroradiology.
Statistical Analysis
Statistical analysis was performed by using Statistical Product and Service Solutions software (SPSS, Chicago, Ill). Normality was tested by using the Shapiro-Wilk test. The paired t test was used to analyze the diffusion and kurtosis measurements between the ipsilateral ischemic and contralateral normal regions, and their percentage change was compared by using the Mann-Whitney U test. For large lesions, the Kruskal-Wallis H test was used to compare the differences between the volume on the acute ADC, MD, MK, and on the follow-up T2-weighted images. The Spearman correlation analysis was used to test the initial lesion volumes on ADC, MD, and MK maps with the follow-up T2-weighted lesion volume. For small lesions, the McNemar test was performed to compare the consistency between the number of lesions on ADC, MD, and MK maps and on the follow-up T2-weighted images. P < .05 was considered to indicate a statistically significant difference.
Results
Thirty-seven patients with acute cerebral infarction were included. Patient characteristics are summarized in Table 1. Twenty-one patients showed only large lesions (maximal diameter ≥1 cm), 12 patients showed only small lesions (maximal diameter <1 cm), and four patients showed both small and large lesions.
Table 1.
Patient Characteristics
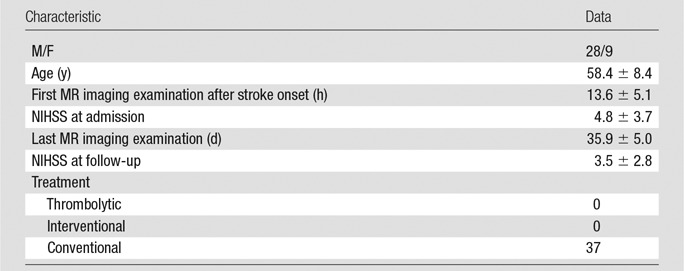
Note.—Unless indicated otherwise, data are means ± standard deviations. NIHSS = National Institutes of Health Stroke Scale.
MK, MD, and ADC Value Changes
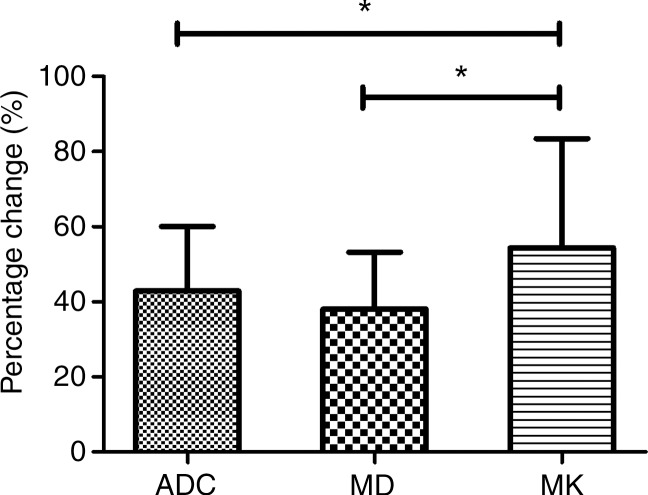
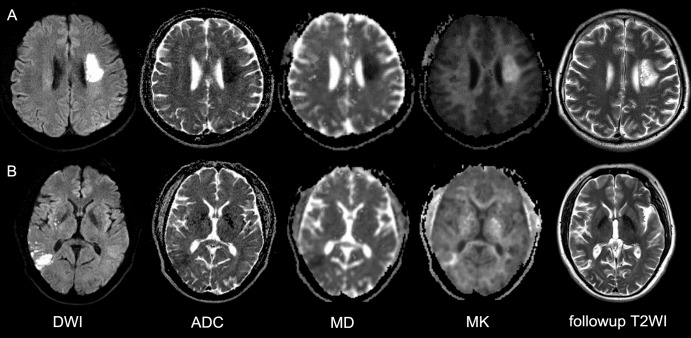
The acute cerebral infarction lesions showed hyperintense signal on DWI images and hypointense signal on ADC and MD maps. However, MK changes within the DWI lesions were heterogeneous, including homogeneous high signal (18 of 32 lesions), inhomogeneous high signal (13 of 32), and no apparent changes (one of 32). Acute lesion ADC and MD values were significantly lower in ischemic lesion compared with the contralateral normal region, whereas MK was higher (Table 2). The percentage changes of the ischemic tissues with respect to the contralateral normal tissue were −42.9% ± 17.2, −37.8% ± 16.6, and +51.3% ± 36.1 for ADC, MD, and MK, respectively. Notably, the relative magnitude change in MK was significantly higher than those in ADC and MD (MD: Z = −3.653, P < .05; ADC: Z = −3.378, P < .05, respectively), without significant differences between ADC and mean diffusivity (Fig 1).
Table 2.
Comparison of ADC, MD, and MK Value Changes for Large (Diameter ≥ 1 cm) Ischemic Lesions

Note.—Unless indicated otherwise, data are means ± standard deviations. ADC = apparent diffusion coefficient, MD = mean diffusivity, MK = mean kurtosis.
*t and P values were two tailed and calculated with the paired t test.
Figure 1:
Graph shows comparison of the percentage changes between ADC, MD, and MK values of the infarction lesions. * = P < .05, ADC = apparent diffusion coefficient, MD = mean diffusivity, MK = mean kurtosis.
Large Acute Ischemic Lesions–Volume Changes
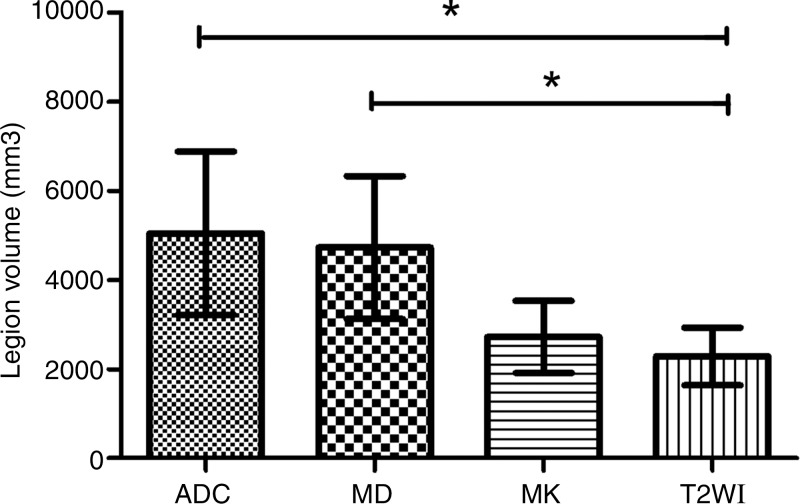
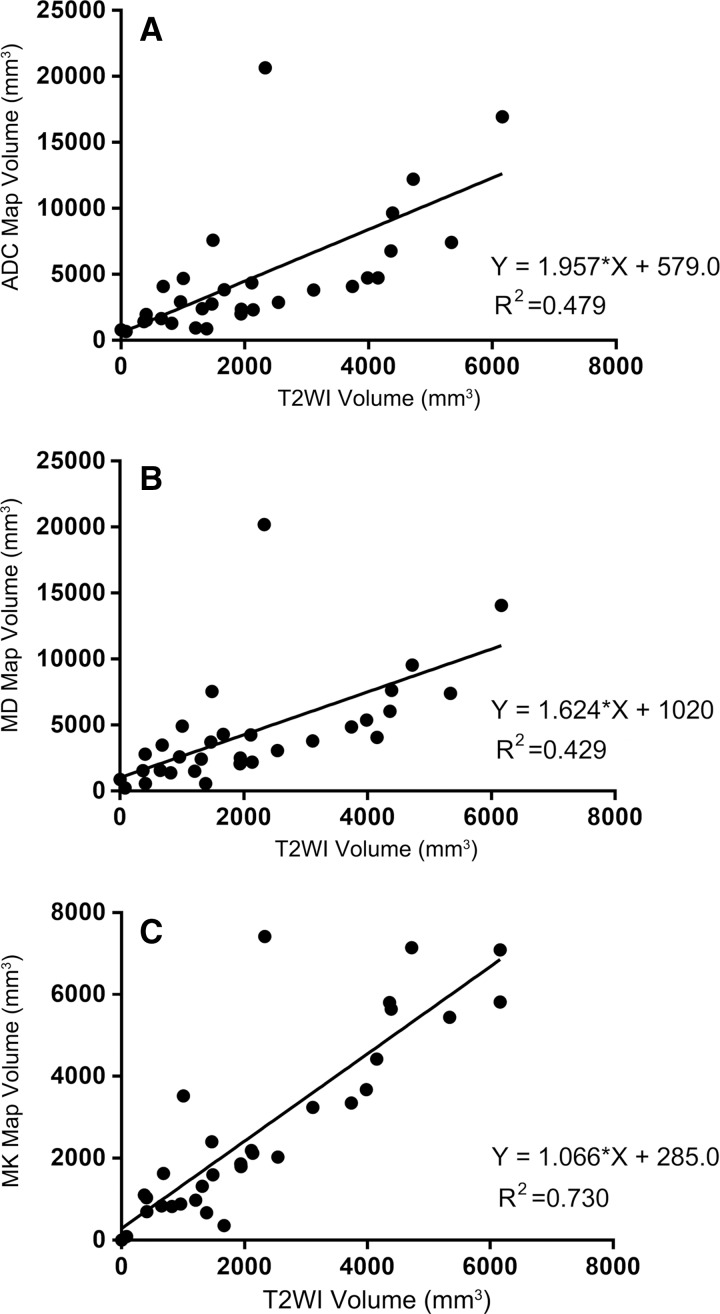
There were 32 large lesions from 25 patients. The lesion on 1-month follow-up T2-weighted images was defined as the outcome of the infarctions. Eighteen of 32 lesions showed similar DWI and DKI volume (patient A in Fig 2); whereas 14 of 32 lesions showed noticeable volume difference between the DWI and DKI maps (patient B in Fig 2). Specifically, the lesion volume on MK maps was 1946.8 mm3 ± 3327.0 and not significantly different (P = .532) from the lesion volume of 1804.2 mm3 ± 3069.8 on follow-up T2-weighted images; whereas the volumes on ADC and MD maps were 3376.7 mm3 ± 4536.8 and 3606.2 mm3 ± 4180.7, respectively, and significantly different from those on follow-up T2-weighted images (both P = .007, Fig 3). Pearson correlation analysis showed that the final T2-weighted imaging volume positively correlated with size on acute ADC, MD, and MK maps (ADC: R2 = 0.479, P < .001; MD: R2 = 0.429, P < .001; MK: R2 = 0.730, P < .001, respectively), with MK lesion volume showing the highest correlation (Fig 4).
Figure 2:
Two representative cases with acute stroke. A, DWI in a 43-year-old man with right-limb weakness for 12 hours. Image shows left corona radiata infarction. DWI and MK demonstrated a similar abnormal area. The lesion on follow-up T2-weighted image is comparable to that in the acute phase. B, DWI in a 53-year-old man with dizziness and vomiting for 12 hours. Initial image showed right temporal lobe infarction with decreased signal on ADC and MD maps and inhomogeneous hyperintensity on MK map. The 1-month follow-up T2-weighted image showed infarction similar to the acute MK lesion. ADC = apparent diffusion coefficient, DWI = diffusion-weighted imaging, MD = mean diffusivity, MK = mean kurtosis, T2WI = T2-weighted image.
Figure 3:
Graph shows comparison of the infarction lesion volume on ADC, MD, MK maps to the final T2-weighted image. The lesion volume on MK map was most similar to the final infarct size. * = P < .05, ADC = apparent diffusion coefficient, MD = mean diffusivity, MK = mean kurtosis, T2WI = T2-weighted image.
Figure 4:
Graphs show correlation of acute, A, ADC, B, MD, and, C, MK lesion volumes with follow-up T2-weighted image. ADC = apparent diffusion coefficient, MD = mean diffusivity, MK = mean kurtosis, T2WI = T2-weighted image.
Small Acute Infarction Lesions–Lesion Numbers
There were 138 small acute lesions in 16 patients on DWI images. A total of 115, 106, and 51 small lesions were counted on ADC, MD, and MK maps, respectively. Among these small acute lesions, 55 were found on the 1-month follow-up T2-weighted images. There was significant consistency between the number of small lesions on the acute MK map and on the follow-up T2-weighted images (P = .125), and there was no consistency between the quantity of small lesions on ADC and MD maps compared with that on follow-up T2-weighted images (both P < .001) (Table 3).
Table 3.
Comparison of Lesion Counts on Acute ADC, MD, and MK Maps and Follow-up T2-weighted Imaging for Small (Diameter < 1 cm) Ischemic Lesions

Note.—P values were calculated with the McNemar test. ADC = apparent diffusion coefficient, MD = mean diffusivity, MK = mean kurtosis.
Discussion
Our study showed that, for large lesions, the acute MK lesion showed a significantly higher correlation with the outcome infarction volume than lesion based on DWI parameters (ie, ADC and MD). For small lesions, a substantial number of diffusion lesions reversed, while kurtosis lesions were persistent on follow-up T2-weighted images. Our observation is in agreement with that in an experimental stroke study that suggested that kurtosis-diffusion mismatch helps identify the portion of DWI lesion that is more likely to recover following early reperfusion (28).
Prior studies have investigated acute DWI reversibility, primarily following early recanalization (18–21). Although there has been debate as to whether the entire DWI reversibility is sustainable, it is generally accepted that a portion of the DWI lesion may be spared from otherwise destined infarction (31). Our study included a prospective cohort of patients with acute stroke without tissue plasminogen activator treatment who demonstrated measurable DWI reversibility. In our cases, the outcome was measured 1 month following acute stroke, at which point the extent of signal abnormality on T2-weighted images provides a good measurement of stroke outcome. Our study showed that, in patients with mild infarction, partial DWI reversibility is not uncommon. It has been shown that there is graded metabolic derangement within the DWI lesion (15,16); future studies will need to evaluate the perfusion or metabolic states of the parts of DWI lesion that eventually proceed to infarction in comparison to the portion that renormalizes.
This study has several limitations. First, it is likely that multiparametric assessment of additional tissue pathophysiologic indexes, such as perfusion, oxygen metabolism, and pH will improve our mechanistic understanding of DWI reversibility (32–34), but such an approach may prolong the acute stroke imaging time. Although we performed MR angiography and arterial spin labeling in several cases, the spatial resolution of arterial spin labeling was not sufficient to segment DWI lesion and assess the tissue perfusion status within the kurtosis and diffusion-kurtosis mismatch areas. For small lesions, this is even more challenging. On the other hand, because volume measurements are unreliable for small lesions, we counted the number of small acute lesions and compared it with the lesion counts on 1-month follow-up MR images. Although the spatial resolution of DKI is slightly lower than that of DWI, MK outperformed MD maps of the same resolution in predicting infarction outcome. Because MK showed significantly higher differences between the lesion and contralateral normal tissue than did MD of the same resolution, the mismatch between MD and MK strongly suggests the underlying diffusional heterogeneity. Finally, our study used the vendor-provided DWI sequence and a customized DKI sequence, and we noted slightly different ADC and MD values. However, we speculate that the observed difference is likely due to a small offset in diffusion gradient calibration, given the percentage reduction of diffusion rate change from that of the contralateral normal tissue between ADC and MD was grossly comparable (42.9% for ADC vs 37.8% for MD).
In summary, this study evaluates the relationship between acute stroke DWI and DKI metrics and the infarction outcome assessed by using 1-month follow-up T2-weighted MR imaging. For large acute lesions, MK lesion volume showed substantially higher correlation with the infarction volume on follow-up T2-weighted than acute diffusion images (ie, DWI, ADC, and MD). For small acute lesions, the number of lesions from the acute MK map, but not from the diffusion maps, showed significant consistency with that from follow-up T2-weighted images. Our study highlights the potential usefulness of DKI in the acute stroke setting as an adjunct tool for routine clinical MR imaging.
Implications for Patient Care
■ Acute stroke lesions on diffusion-weighted (DW) images may be partially reversible.
■ The volume of acute lesions from the mean kurtosis map correlated more strongly with the volume from the follow-up T2-weighted than DW images.
■ The number of acute small lesions from the mean kurtosis map agreed more closely with the number on follow-up T2-weighted than DW images.
■ Diffusion kurtosis imaging provided improved correlation and consistency with the follow-up MR imaging than did routine DW images and apparent diffusion coefficient maps.
Acknowledgments
Acknowledgment
The authors thank Mark Vangel, PhD, of the Harvard Catalyst Biostatistics Program for statistical consultation.
Received March 8, 2017; revision requested May 8; final revision received October 6; accepted October 30; final version accepted November 14.
Supported in part by the National Institute of Neurologic Disorders and Stroke (R01NS083654, R21NS085574).
Disclosures of Conflicts of Interest: J.Y. disclosed no relevant relationships. H.S. disclosed no relevant relationships. A.M.M. disclosed no relevant relationships. Z.W. disclosed no relevant relationships. H.N. disclosed no relevant relationships. W.S. disclosed no relevant relationships. P.Z.S. disclosed no relevant relationships.
Abbreviations:
- ADC
- apparent diffusion coefficient
- DKI
- diffusion kurtosis imaging
- DWI
- diffusion-weighted imaging
- MD
- mean diffusivity
- MK
- mean kurtosis
Contributor Information
Haizhen Sun, Email: pzhesun@nmr.mgh.harvard.edu.
Phillip Zhe Sun, Email: pzhesun@nmr.mgh.harvard.edu.
References
- 1.Berkhemer OA, Fransen PS, Beumer D, et al. A randomized trial of intraarterial treatment for acute ischemic stroke. N Engl J Med 2015;372(1):11–20. [DOI] [PubMed] [Google Scholar]
- 2.Campbell BC, Mitchell PJ, Kleinig TJ, et al. Endovascular therapy for ischemic stroke with perfusion-imaging selection. N Engl J Med 2015;372(11):1009–1018. [DOI] [PubMed] [Google Scholar]
- 3.Goyal M, Demchuk AM, Menon BK, et al. Randomized assessment of rapid endovascular treatment of ischemic stroke. N Engl J Med 2015;372(11):1019–1030. [DOI] [PubMed] [Google Scholar]
- 4.Saver JL, Goyal M, Bonafe A, et al. Stent-retriever thrombectomy after intravenous t-PA vs. t-PA alone in stroke. N Engl J Med 2015;372(24):2285–2295. [DOI] [PubMed] [Google Scholar]
- 5.Furlan AJ. Endovascular therapy for stroke: it’s about time. N Engl J Med 2015;372(24):2347–2349. [DOI] [PubMed] [Google Scholar]
- 6.Campbell BCV, Mitchell PJ, Yan B, et al. A multicenter, randomized, controlled study to investigate EXtending the time for Thrombolysis in Emergency Neurological Deficits with Intra-Arterial therapy (EXTEND-IA). Int J Stroke 2014;9(1):126–132. [DOI] [PubMed] [Google Scholar]
- 7.Leslie-Mazwi TM, Hirsch JA, Falcone GJ, et al. Endovascular stroke treatment outcomes after patient selection based on magnetic resonance imaging and clinical criteria. JAMA Neurol 2016;73(1):43–49. [DOI] [PubMed] [Google Scholar]
- 8.Moseley ME, Kucharczyk J, Mintorovitch J, et al. Diffusion-weighted MR imaging of acute stroke: correlation with T2-weighted and magnetic susceptibility-enhanced MR imaging in cats. AJNR Am J Neuroradiol 1990;11(3):423–429. [PMC free article] [PubMed] [Google Scholar]
- 9.Schaefer PW, Ozsunar Y, He J, et al. Assessing tissue viability with MR diffusion and perfusion imaging. AJNR Am J Neuroradiol 2003;24(3):436–443. [PMC free article] [PubMed] [Google Scholar]
- 10.Muir KW, Buchan A, von Kummer R, Rother J, Baron JC. Imaging of acute stroke. Lancet Neurol 2006;5(9):755–768. [DOI] [PubMed] [Google Scholar]
- 11.Warach S. Measurement of the ischemic penumbra with MRI: it’s about time. Stroke 2003;34(10):2533–2534. [DOI] [PubMed] [Google Scholar]
- 12.Dávalos A, Blanco M, Pedraza S, et al. The clinical-DWI mismatch: a new diagnostic approach to the brain tissue at risk of infarction. Neurology 2004;62(12):2187–2192. [DOI] [PubMed] [Google Scholar]
- 13.Lansberg MG, Thijs VN, Bammer R, et al. The MRA-DWI mismatch identifies patients with stroke who are likely to benefit from reperfusion. Stroke 2008;39(9):2491–2496. [DOI] [PMC free article] [PubMed] [Google Scholar]
- 14.Marks MP, Olivot JM, Kemp S, et al. Patients with acute stroke treated with intravenous tPA 3-6 hours after stroke onset: correlations between MR angiography findings and perfusion- and diffusion-weighted imaging in the DEFUSE study. Radiology 2008;249(2):614–623. [DOI] [PMC free article] [PubMed] [Google Scholar]
- 15.Nicoli F, Lefur Y, Denis B, Ranjeva JP, Confort-Gouny S, Cozzone PJ. Metabolic counterpart of decreased apparent diffusion coefficient during hyperacute ischemic stroke: a brain proton magnetic resonance spectroscopic imaging study. Stroke 2003;34(7):e82–e87. [DOI] [PubMed] [Google Scholar]
- 16.Guadagno JV, Warburton EA, Jones PS, et al. How affected is oxygen metabolism in DWI lesions? a combined acute stroke PET-MR study. Neurology 2006;67(5):824–829. [DOI] [PubMed] [Google Scholar]
- 17.Minematsu K, Li L, Sotak CH, Davis MA, Fisher M. Reversible focal ischemic injury demonstrated by diffusion-weighted magnetic resonance imaging in rats. Stroke 1992;23(9):1304–1310; discussion 1310–1311. [DOI] [PubMed] [Google Scholar]
- 18.Merino JG, Latour LL, Todd JW, et al. Lesion volume change after treatment with tissue plasminogen activator can discriminate clinical responders from nonresponders. Stroke 2007;38(11):2919–2923. [DOI] [PMC free article] [PubMed] [Google Scholar]
- 19.Vilas D, de la Ossa NP, Millán M, Capellades J, Dávalos A. Brainstem lesions in diffusion sequences of MRI can be reversible after arterial recanalization. Neurology 2009;73(10):813–815. [DOI] [PubMed] [Google Scholar]
- 20.Yoo AJ, Hakimelahi R, Rost NS, et al. Diffusion weighted imaging reversibility in the brainstem following successful recanalization of acute basilar artery occlusion. J Neurointerv Surg 2010;2(3):195–197. [DOI] [PubMed] [Google Scholar]
- 21.Yamada R, Yoneda Y, Kageyama Y, Ichikawa K. Reversal of large ischemic injury on hyper-acute diffusion MRI. Case Rep Neurol 2012;4(3):177–180. [DOI] [PMC free article] [PubMed] [Google Scholar]
- 22.Kohno K, Hoehn-Berlage M, Mies G, Back T, Hossmann KA. Relationship between diffusion-weighted MR images, cerebral blood flow, and energy state in experimental brain infarction. Magn Reson Imaging 1995;13(1):73–80. [DOI] [PubMed] [Google Scholar]
- 23.Fiehler J, Foth M, Kucinski T, et al. Severe ADC decreases do not predict irreversible tissue damage in humans. Stroke 2002;33(1):79–86. [DOI] [PubMed] [Google Scholar]
- 24.Jensen JH, Helpern JA, Ramani A, Lu H, Kaczynski K. Diffusional kurtosis imaging: the quantification of non-gaussian water diffusion by means of magnetic resonance imaging. Magn Reson Med 2005;53(6):1432–1440. [DOI] [PubMed] [Google Scholar]
- 25.Jensen JH, Falangola MF, Hu C, et al. Preliminary observations of increased diffusional kurtosis in human brain following recent cerebral infarction. NMR Biomed 2011;24(5):452–457. [DOI] [PMC free article] [PubMed] [Google Scholar]
- 26.Cheung MM, Hui ES, Chan KC, Helpern JA, Qi L, Wu EX. Does diffusion kurtosis imaging lead to better neural tissue characterization? a rodent brain maturation study. Neuroimage 2009;45(2):386–392. [DOI] [PubMed] [Google Scholar]
- 27.Jensen JH, Helpern JA. MRI quantification of non-Gaussian water diffusion by kurtosis analysis. NMR Biomed 2010;23(7):698–710. [DOI] [PMC free article] [PubMed] [Google Scholar]
- 28.Cheung JS, Wang E, Lo EH, Sun PZ. Stratification of heterogeneous diffusion MRI ischemic lesion with kurtosis imaging: evaluation of mean diffusion and kurtosis MRI mismatch in an animal model of transient focal ischemia. Stroke 2012;43(8):2252–2254. [DOI] [PMC free article] [PubMed] [Google Scholar]
- 29.Weber RA, Hui ES, Jensen JH, et al. Diffusional kurtosis and diffusion tensor imaging reveal different time-sensitive stroke-induced microstructural changes. Stroke 2015;46(2):545–550. [DOI] [PMC free article] [PubMed] [Google Scholar]
- 30.Hui ES, Du F, Huang S, Shen Q, Duong TQ. Spatiotemporal dynamics of diffusional kurtosis, mean diffusivity and perfusion changes in experimental stroke. Brain Res 2012;1451(4):100–109. [DOI] [PMC free article] [PubMed] [Google Scholar]
- 31.Inoue M, Mlynash M, Christensen S, et al. Early diffusion-weighted imaging reversal after endovascular reperfusion is typically transient in patients imaged 3 to 6 hours after onset. Stroke 2014;45(4):1024–1028. [DOI] [PMC free article] [PubMed] [Google Scholar]
- 32.An H, Ford AL, Chen Y, et al. Defining the ischemic penumbra using magnetic resonance oxygen metabolic index. Stroke 2015;46(4):982–988[Published correction appears in Stroke 2015;46(4):e95.]. [DOI] [PMC free article] [PubMed] [Google Scholar]
- 33.Guo Y, Zhou IY, Chan ST, et al. pH-sensitive MRI demarcates graded tissue acidification during acute stroke - pH specificity enhancement with magnetization transfer and relaxation-normalized amide proton transfer (APT) MRI. Neuroimage 2016;141(11):242–249. [DOI] [PMC free article] [PubMed] [Google Scholar]
- 34.Wang E, Wu Y, Cheung JS, et al. pH imaging reveals worsened tissue acidification in diffusion kurtosis lesion than the kurtosis/diffusion lesion mismatch in an animal model of acute stroke. J Cereb Blood Flow Metab 2017;37(10):3325–3333. [DOI] [PMC free article] [PubMed] [Google Scholar]


