

Abstract
Purpose
To assess the clinical safety, pharmacokinetics, and tumor imaging characteristics of fluorine 18–(2S,4R)-4-fluoroglutamine (FGln), a glutamine analog radiologic imaging agent.
Materials and Methods
This study was approved by the institutional review board and conducted under a U.S. Food and Drug Administration–approved Investigational New Drug application in accordance with the Helsinki Declaration and the Health Insurance Portability and Accountability Act. All patients provided written informed consent. Between January 2013 and October 2016, 25 adult patients with cancer received an intravenous bolus of FGln tracer (mean, 244 MBq ± 118, <100 μg) followed by positron emission tomography (PET) and blood radioassays. Patient data were summarized with descriptive statistics. FGln biodistribution and plasma amino acid levels in nonfasting patients (n = 13) were compared with those from patients who fasted at least 8 hours before injection (n = 12) by using nonparametric one-way analysis of variance with Bonferroni correction. Tumor FGln avidity versus fluorodeoxyglucose (FDG) avidity in patients with paired PET scans (n = 15) was evaluated with the Fisher exact test. P < .05 was considered indicative of a statistically significant difference.
Results
FGln PET depicted tumors of different cancer types (breast, pancreas, renal, neuroendocrine, lung, colon, lymphoma, bile duct, or glioma) in 17 of the 25 patients, predominantly clinically aggressive tumors with genetic mutations implicated in abnormal glutamine metabolism. Acute fasting had no significant effect on FGln biodistribution and plasma amino acid levels. FGln-avid tumors were uniformly FDG-avid but not vice versa (P = .07). Patients experienced no adverse effects.
Conclusion
Preliminary human FGln PET trial results provide clinical validation of abnormal glutamine metabolism as a potential tumor biomarker for targeted radiotracer imaging in several different cancer types.
© RSNA, 2018
Online supplemental material is available for this article.
Clinical trial registration no. NCT01697930
Introduction
The vital importance of glutamine to cancer biology is well credentialed with extensive preclinical research (1–9). Noninvasive assays of tumor glutamine utilization have important potential applications in clinical radiology for in vivo tumor detection, for tumor metabolic phenotyping, and as target biomarker assays to support the clinical development of novel pharmacotherapeutics targeting tumor glutamine metabolism (10,11). Fluorine 18 (18F) (2S,4R)-4-fluoroglutamine (FGln) is an investigational noninvasive positron emission tomography (PET) biomarker assay of in vivo tumor glutamine flux and metabolism (11). This clinical trial was conducted to assess the clinical safety, pharmacokinetics, and tumor imaging characteristics of a glutamine analog radiologic imaging agent.
Materials and Methods
Research was supported by a David Mahoney Neuroimaging Program grant of the Dana Foundation; a Stand Up to Cancer Dream Team translational research grant (grant SU2C-AACR-DT0509); and the National Institutes of Health–National Cancer Institute (grants P30 CA008748, P50 CA086438, R01 CA164490, R21 CA167803, and R01 CA172546). The authors had control of the data and information submitted for publication.
Study Design
This open-label, nonrandomized, microdose phase I trial of FGln was approved by Memorial Sloan-Kettering Cancer Center’s institutional review board, conducted from January 2013 to October 2016 under a U.S. Food and Drug Administration–approved Investigational New Drug application, and registered at www.clinicaltrials.gov (registration number NCT01697930). The study was conducted in accordance with the Helsinki Declaration and the Health Insurance Portability and Accountability Act. Patients provided written informed consent before participating in the study. Inclusion criteria included the following: age of 21–90 years, serum renal and hepatic function test values lower than 1.5–2.5-fold greater than the laboratory-specific upper limit of normal, histologically confirmed cancer, and tumors visualized with standard imaging (computed tomography [CT], magnetic resonance [MR] imaging, and/or 18F fluorodeoxyglucose [FDG] PET/CT) performed less than 4 weeks before consent. Serum complete blood count and hepatorenal function tests were performed less than 2 weeks before study participation. Patients were excluded if they were pregnant, were breastfeeding, or had an acute major illness. Analyzed data included previously reported data from six patients with glioma (patients 18–23, Table 1) regarding dosimetry, tumor FGln avidity, and histologic characteristics (World Health Organization grade, genetic alterations) (11). From the same six patients, we present data not previously reported regarding plasma protein tracer incorporation, fasting effects on tracer biodistribution, and comparison of bone tracer uptake at FGln PET with bone tracer uptake in a sodium fluoride (NaF) PET reference group.
Table 1.
Summary of Patient and Tumor Characteristics
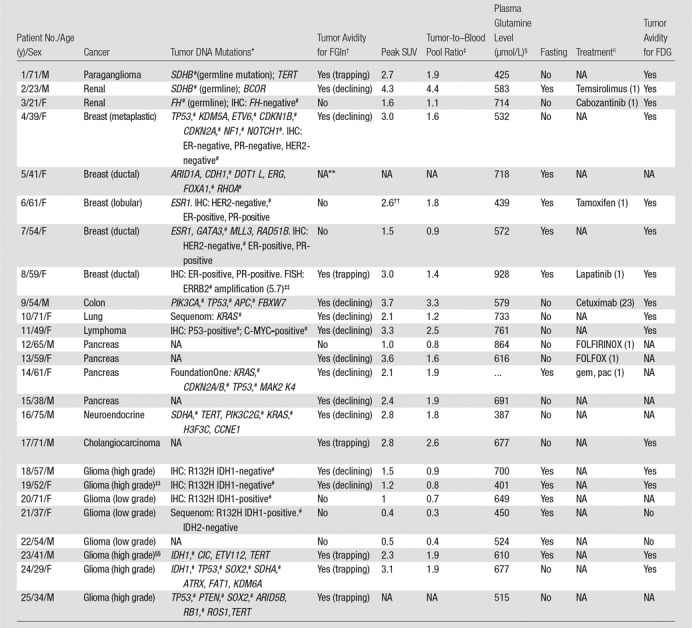
Note.—NA = not applicable or data not available.
*For each patient, the column text specifically indicates when a particular tumor genetic mutation was a germline mutation; all other listed mutations were otherwise identified as somatic mutations (for detailed description of genetic mutations, see Table E1 [online]). Patient-specific tumor mutations were identified with DNA genotyping by using MSK IMPACT unless otherwise specified (FoundationOne or Sequenom; see Materials and Methods). Germline mutations are indicated in parentheses. Also listed are relevant data from immunohistochemistry or fluorescence in situ hybridization when available. ER = estrogen receptor, FISH = fluorescence in situ hybridization, IHC = immunohistochemistry, PR = progesterone receptor.
†Avid tumors demonstrated tracer uptake and retention greater than blood pool and background tissues at FGln PET. Tumor avidity was classified according to PET kinetic phenotype as “trapping,” with minimal-to-nil tracer clearance at delayed time points, or as “declining,” with tumor tracer uptake greater than that in blood pool at delayed time points but progressively declining.
‡Tumor avidity at FGln PET was quantified by using conventional peak SUV and the ratio of tumor peak SUV to blood pool peak SUV, measured from PET images obtained approximately 1 hour after injection (see Materials and Methods).
§Plasma glutamine level immediately before FGln injection. Normal nonfasting reference range is 428–747 µmol/L.
||Any treatment less than 4 weeks before FGln PET; days between last treatment dose and the FGln PET study are shown in parentheses. FOLFOX = 5-fluorouracil, leucovorin, and oxaliplatin; FOLFIRINOX = 5-fluorouracil, leucovorin, oxaliplatin, and irinotecan; gem = gemcitabine; pac = Nab-paclitaxel.
#Mutated genes with known regulatory roles in tumor glutamine utilization (selected citations are provided in Table E4 [online]).
**Patient 5 had ureteral mass initially thought to be tumor but later proven infectious and inflammatory; the mass was FGln PET-negative.
††Patient 6 had tumor with relatively high tumor-to–blood ratio at known tumor site—a gastric metastasis—but tumor was visually indistinct at FGln PET amid diffuse background uptake in gastric wall; thus, the measured peak SUV at the site may represent normal gastric wall uptake rather than tumor uptake.
‡‡Indicates degree of amplication. ERRB2 (HER2) is considered amplified based on the HER2/cen17(chromosome 17) ratio (16.2/3.2 = 5.7). For HER2-positive disease, a ratio greater than 5 is considered high.
§§Patient had both high-grade and low-grade gliomas. Data shown (tumor DNA mutations, SUV, etc) apply to the high-grade glioma tumors (the low-grade gliomas were FGln PET–negative).
Radiopharmaceutical Preparation
FGln precursor was synthesized as previously described (10–12) and manufactured at Memorial Sloan-Kettering Cancer Center’s core facility pursuant to an Investigational New Drug application. FGln purity was analyzed with a chiral column (Chirex 3126 d-penicillamine, 1 mmol/L CuSO4 solution, 1 mL/min). Before release, each FGln dose met drug product acceptance specifications, including radiochemical purity and identity, residual solvent content, endotoxin content, radionuclidic identity, pH, and appearance (Fig E1 [online]). The final product was formulated as a sterile solution for intravenous injection. The mean decay-corrected radiochemical yield (±standard deviation) was 8% ± 3 (range, 1.6%–40%). Specific activity was at least 4.7 GBq/µmol during initial validation studies. The mass amount injected was 100 µg or less.
Patient Preparation
Twelve of the 25 patients fasted, except for oral water intake, at least 8 hours before tracer injection until completion of imaging. The remaining 13 patients did not fast. Two catheters (one for tracer administration, one for blood sampling) were used to access separate upper extremity veins. Patients voided their bladder immediately before injection. Patients were monitored for signs and symptoms 4 hours after injection, contacted approximately 24 hours after injection, and were told to contact investigators if signs or symptoms arose during the 30 days after injection.
FGln PET/CT
PET/CT scans were obtained with a single Discovery 690 PET/CT scanner (GE Healthcare, Chicago, Ill) with patients supine. After spiral CT, 30-minute dynamic acquisition PET imaging of a single scanner bed position tumor region of interest began immediately before injection. Single peripheral intravenous injection of a mean of 244 MBq ± 118 FGln (<100 µg) quantum satis 5–10 mL in sterile water was administered in less than 30 seconds. PET imaging from skull to thighs followed, with delayed scans a mean of 90 minutes ± 30 and 150 minutes ± 30 after injection. Additional details are given in Appendix E1 (online).
PET/CT data were analyzed with dedicated software (Hermes Gold4.4-B [Hermes Medical Solutions, Stockholm, Sweden] and AW Suite on Centricity PACS [GE Healthcare Integrated IT Solutions, Barrington, Ill]) by an experienced physician (M.P.S.D., with 15 years of experience). Tumor uptake measured in a three-dimensional volume of interest was quantified by means of the peak standardized uptake value (SUV) (13) and the tumor–blood pool activity ratio. The peak SUV volume of interest is a 1-cm3 volume of interest that includes maximal SUV pixel; after initial manual placement, software automatically spatially repositions the volume of interest to maximize peak SUV. Tumor FGln “avidity” was defined as uptake greater than blood pool activity at all time points. Nonavidity was defined as uptake less than or equal to blood pool activity more than 10 minutes after injection. Tracer biodistribution and excretion were derived from PET-based volume of interest analyses. Excreta absent from the field of view at delayed time points were quantified as the ratio difference between normalized field of view total activity at a delayed time point versus an initial time point. Renal clearance was calculated as 0.693 ÷ λu, where λu is the rate constant of the fitted formula describing cumulative urinary activity as a monoexponential time function. Mean normal organ radiation doses (in centigrays per megabecquerel administered) and effective dose (in centisieverts per megabecquerel administered) were calculated for an adult human standard anatomic model on the basis of Committee on Medical Internal Radiation Dose guidelines by using OLINDA/EXM v.1 software (Vanderbilt University, Nashville, Tenn). Additional details are given in Appendix E1 (online).
Skeletal tracer uptake in patients receiving FGln were compared with skeletal uptake of exogenous free 18F in a separate patient group undergoing 18F NaF PET for routine cancer care (Appendix E1 [online]).
Plasma Radioassays
Plasma radioactivity clearance and plasma radiometabolite concentrations were assayed from serial blood samples collected approximately 1, 5, 15, 30, and 150 minutes after injection. Catheters were flushed with saline between blood draws, with the sample discarded immediately before each collection. Samples (approximately 5 mL) were collected in tubes containing heparin kept on wet ice until radioassay. From each sample, blood aliquots were separated for well counting and radio high-performance liquid chromatography–based metabolite analyses (Appendix E1 [online]).
Tumor DNA Sequencing
Tumor specimens were obtained for standard medical care. Immunohistochemistry was performed according to standard practice and genetic testing according to oncologist judgment. Tumor genomic profiling was obtained in 13 patients by using a MSK-IMPACT (Memorial Sloan Kettering Integrated Mutation Profiling of Actionable Cancer Targets, New York, NY) genomic profiling assay (n = 12) (14) or FoundationOne assay (n = 1) (Foundation Medicine, Cambridge, Mass). Sequenom mass spectrometry was performed in two patients without genomic profiling, targeting specific tumor genetic mutations either in AKT1, BRAF, EGFR, ERBB2, KRAS, MEK1 (MAP2 K1), NRAS, and PIK3CA, or IDH1 and IDH2. No tumor genetic data were available in 10 patients.
Statistical Analysis
Graphs were plotted and statistical analyses performed with use of software (SAS Studio 3.5; SAS Institute, Cary, NC). Experimental data were summarized by using descriptive statistics. Data distributions were evaluated with the Kolmogorov-Smirnov test and normal probability plots. Data from fasting versus nonfasting patients were compared by using nonparametric one-way analysis of variance with posthoc Bonferroni correction. The Fisher exact test was used to compare the frequency of male and female patients. Early versus late plasma radiotracer concentrations were compared by using the two-sample paired sign test. P < .05 was considered indicative of a statistically significant difference. All statistical tests were two-sided.
Results
Patients
Twenty-five patients joined the study. A summary of demographic characteristics is given in Table 1. No patient experienced adverse effects from FGln injection.
FGln Plasma Metabolites and Clearance
Radiotracer clearance from blood and plasma was biphasic, with an initial phase (α) of short half-life (t1/2) followed by a prolonged terminal phase (β) (mean blood t1/2α = 4.2 minutes ± 2.1, t1/2β = 147.2 minutes ± 47.7; mean plasma t1/2α = 4.6 minutes ± 2.1, t1/2β = 172.1 minutes ± 149.2). The mean blood-plasma radiotracer activity ratio was 0.74 ± 0.2 at 5 minutes and 0.81 ± 0.3 at 60 minutes (P = .15). The mean patient cumulative urinary isotope excretion was 10.9% injected dose ± 3.4. No biliary excretion was detected. Tracer variably was visualized within loops of distal small intestines and proximal large intestines, likely representing tracer secreted into bowel lumen by means of intestinal amino acid transporters.
Plasma radiotracer was predominantly intact parent compound with progressive accumulation of radiometabolites across time points (Table E1 [online]). The amount of radiotracer associated with plasma proteins did not decrease with time after injection, which is suggestive of polypeptide tracer incorporation because glutamine does not bind nonspecifically to plasma proteins.
FGln Biodistribution
Table 2 describes tracer biodistribution (Fig 1). Acute fasting before injection did not affect plasma glutamine concentrations or FGln biodistribution (Tables E2, E3 [online]). Normal soft tissues predominantly demonstrated progressive tracer clearance. In the skeleton, tracer accumulated preferentially in red marrow regions of axial skeleton and bony pelvic girdle. Lesser, often scant, activity was visualized in the peripheral skeleton (Fig E2 [online]). At FGln PET, bone uptake at 1 hour after injection (Table 2) was approximately half the bone uptake observed in control patients (n = 10) undergoing NaF (ie, free 18F) PET bone scanning, with humerus and thoracic spine uptake (average SUV) of 1.9 ± 0.6 and 7.2 ± 1.6, respectively, at 1 hour (mean, 71 minutes ± 12) after injection. Skeletal FGln tracer uptake did not obscure the detection of skeletal metastases, as described below. FGln radiation dosimetry was comparable to standard diagnostic radiopharmaceuticals (effective dose: 0.7 mSv/37 MBq [11]).
Table 2.
Tracer Biodistribution in Human Subjects 1 Hour and 2 Hours after FGln Injection
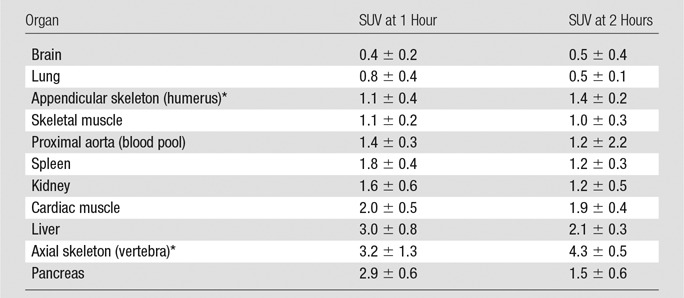
Note.—Data are averages ± standard deviations.
*Tracer uptake in humerus was considered representative of compact bone and/or osteogenic cell tracer avidity, and tracer uptake in the spine was considered representative of tracer uptake in bone red marrow (see Results). FGln radiation dosimetry is favorable (14).
Figure 1:

Three-dimensional maximum intensity projection PET image obtained 69 minutes after injection of 273 MBq FGln, spanning from midskull to proximal thighs, shows FGln-avid MYC-positive lymphoma (patient 11, Table 1), including biopsy-proven neck adenopathy (arrow). Typical FGln biodistribution is visualized (Table 2).
FGln PET Depicts Tumors of Several Cancer Types and with Genetic Mutations That Affect Glutamine Metabolism
FGln PET depicted tumors of several cancer types (Table 1) in 17 of the 25 patients. The mean size of dominant soft-tissue tumors evaluated was 2.8 cm (range, 1.1–11.5 cm). Soft-tissue tumor avidity became visually distinct relative to mediastinal blood pool activity on PET images and achieved maximum uptake less than 30 minutes after injection. For all tumors—both avid and nonavid—peak SUV values 1 hour after injection ranged from 0.4 to 4.3 (average, 2.3 ± 1.0), with tumor–blood pool ratios ranging from 0.8 to 4.4 (Table 1). Several patients received systemic anticancer treatments during or recently before FGln PET (Table 1). Recent cytotoxic treatment reduces tumor FGln avidity (11). As in animal studies (10), time-activity curves of FGln-avid soft-tissue tumors in patients demonstrated a rise to plateau (n = 6) or a rise and delayed fall (n = 11). Osseous tumors demonstrated visually distinct focal uptake, greater than that in surrounding bone, at all time points. Osseous tumor SUVs progressively increased to the last PET time point approximately 3 hours after injection (Fig E2 [online]).
Seventeen of the 25 patients had FDG PET scans for comparison. Of these, 12 patients had tumors that were both FGln avid and FDG avid (Fig 2). Three patients had FDG-avid tumors with no detectable FGln avidity. Two patients had tumors that were negative for avidity at FDG PET and FGln PET. Correlation of tumor FGln avidity with FDG avidity approached significance with the Fisher test (P = .07). Lack of background brain FGln uptake (Table 2) afforded superior tumor-background contrast for FGln PET compared with FDG PET (11) in the detection of brain tumors.
Figure 2:

Images in patient with SDHB-mutant metastatic paraganglioma and pheochromocytoma (patient 1). Images on left are FGln PET (top) and companion CT (bottom) images obtained in single axial thoracic plane. Images on right are FDG PET (top) and companion CT (bottom) images obtained in corresponding axial thoracic plane and were obtained 2 weeks after FGln PET. Hypermetabolic osteolytic spinal metastasis, with extraosseous component, is present (arrows). FGln PET image was obtained 36 minutes after injection of 148 MBq FGln; at this early time point, tracer accumulation in normal bone (eg, unaffected portion of vertebra, arrowheads) is scant.
Altered tumor glutamine metabolism can be associated with tricarboxylic acid cycle gene alterations (2–4). Tricarboxylic acid cycle gene mutations occurred in eight of the 15 patients with tumor genetic profiling (Tables 1, E4 [online]): six sequenced patients, including three with germline mutations and three with somatic mutations, and two patients with isocitrate dehydrogenase mutations at immunohistochemical examination. Of these eight patients, five demonstrated tumor FGln avidity (Figs 2, 3), including four whose FGln-avid tumors had tumor DNA mutations of succinate dehydrogenase (SDH) (Table 1). Tumor isocitrate dehydrogenase gene mutations were identified in four patients: two with FGln-avid high-grade gliomas and two with FGln PET–negative low-grade gliomas. A patient with a germline mutation of fumarate hydratase had FGln PET–negative soft-tissue tumors; PET detection of these tumors was potentially limited by ongoing cytotoxic cancer pharmacotherapy.
Figure 3a:

Detection of SDHB-mutant metastatic renal cancer (patient 3, Table 1) with FGln PET/CT. Corresponding (a) PET, (b) CT, and (c) fusion PET/CT images in single axial thoracic plane obtained 74 minutes after injection of 233 MBq FGln. Nodal mass of metastatic disease in right pulmonary hilum demonstrates distinct tracer avidity (arrow) compared with blood pool (*).
Figure 3b:

Detection of SDHB-mutant metastatic renal cancer (patient 3, Table 1) with FGln PET/CT. Corresponding (a) PET, (b) CT, and (c) fusion PET/CT images in single axial thoracic plane obtained 74 minutes after injection of 233 MBq FGln. Nodal mass of metastatic disease in right pulmonary hilum demonstrates distinct tracer avidity (arrow) compared with blood pool (*).
Figure 3c:

Detection of SDHB-mutant metastatic renal cancer (patient 3, Table 1) with FGln PET/CT. Corresponding (a) PET, (b) CT, and (c) fusion PET/CT images in single axial thoracic plane obtained 74 minutes after injection of 233 MBq FGln. Nodal mass of metastatic disease in right pulmonary hilum demonstrates distinct tracer avidity (arrow) compared with blood pool (*).
Of the five patients with breast cancer, one patient had FGln-avid tumors lacking immunohistochemical expression of estrogen, progesterone, or HER2 receptors (patient 4, Table 1). Genomic profiling of this triple-negative breast cancer (TNBC) yielded genetic mutations and amplifications of genes that regulate glutamine metabolism, including mutations of p53, CDKN2A, NF1, and NOTCH1 and amplification of CDKN1B (15–17). A patient with receptor-positive (non-TNBC) breast cancer (patient 8) had FGln-avid subcentimeter brain metastases; tumor genotyping identified ERRB2 amplification, which is implicated in glutamine hypermetabolism (18). Three remaining patients with non-TNBC had FGln-nonavid tumors with tumor genomic profiling showing no mutations associated with increased glutamine metabolism. Aggressive, high-grade gliomas (n = 6) were FGln-avid, whereas indolent low-grade tumors (n = 5) were PET-negative. FGln PET depicted tumors of several other cancer types in patients with tumor genetic mutations implicated in glutamine hypermetabolism (Table 1).
Discussion
Herein, we report on the feasibility of in vivo tumor detection with noninvasive FGln PET for several different cancer types. Our results suggest that FGln PET is a promising investigational radiologic probe of in vivo tumor glutamine flux and metabolism. Translational research with MR spectroscopy has yielded important in vivo insights into tumor glutamine metabolism (19,20). MR spectroscopy researchers often quantify a combined glutamine-glutamate “peak” due to signal overlap. Newer techniques employing infused hyperpolarized probes and high-field-strength imagers can reduce this overlap. To our knowledge, no exogenously labeled form of glutamine for MR spectroscopy has been tested clinically.
Multiple genes important to tumor biology are key regulators of tumor glutamine flux and metabolism, such as MYC (6–8), P53 (21), EGFR, PIK3CA, MTOR, and GLUD (22,23), and tricarboxylic acid cycle enzymes such as SDH (2). In our study, relevant tumor genetic alterations were found in several patients with FGln-avid tumors, including high tumor FGln avidity in three different patients with SDH mutations. These SDH-mutant tumors also demonstrated marked glucose hypermetabolism on standard FDG PET images (24).
Glutamine and glucose are the two primary metabolic substrates in cancer cell metabolism. Cancer cells exhibit increased glutamine influx and utilization in cellular bioenergetics, biomass production, cell signaling, and homeostasis of pH and redox potential, supporting tumor growth (1,25). Tumor cells may increase anaplerotic glutamine utilization when relying on increased aerobic glycolysis (ie, the “Warburg effect”) to obtain anabolic precursors for macromolecular synthesis, toward cancer cell multiplication and tumor growth (1–9,26). Trial results support this metabolic paradigm: FGln-avid tumors were always FDG-avid and more aggressive clinically. FDG PET–negative tumors were also FGln PET–negative.
Abnormally high glutamine flux and metabolism form a metabolic hallmark of aggressive tumors (26). Most mammalian cells cannot proliferate without exogenous glutamine uptake (27). Glutamine transporters are often overexpressed in cancerous tumors (11) and glutamine-metabolizing enzymes are required for growth of “glutamine-addicted” tumor cells (7–9). In this trial, clinically aggressive high-grade gliomas and TNBC tumors were FGln-avid, whereas less-aggressive low-grade gliomas and receptor-positive tumors were FGln PET–negative, except for brain metastases in one patient with receptor-positive breast cancer with ERRB2 overexpression, which is implicated in glutamine hypermetabolism (18). Aggressive TNBC is reported to be a “glutamine-addicted” cancer (28). FGln PET might have prognostic value as a metabolic biomarker of tumor aggressiveness.
In vitro models demonstrate that tumor cell FGln uptake involves transporters used by normal glutamine (Fig E3 [online]) (10–12). Cellular uptake requires transport against a concentration gradient, with glutamine concentrations in cytoplasmic and intercellular fluid of approximately 5.0 and 0.5 mmol/L, respectively (29). For tumor cells in phosphate-buffered saline, the addition of glutamine to phosphate-buffered saline in the physiologic extracellular range (0.5–1.0 mmol/L) progressively inhibits tumor cell accumulation of FGln in a dose-dependent manner (10,12,30). Glutamine efflux is regulated in part by extracellular concentrations of other amino acids through shared membrane antiporters.
In this study, we detected no significant effect of acute fasting (approximately 8 hours) on preinjection plasma glutamine levels or in vivo uptake of FGln by tumors and bodily organs. Because of the small sample size, a type II error is possible; however, a major effect of fasting on FGln biodistribution seems unlikely. By logistics, nonfasting patients typically had no caloric intake less than 1 hour before or after injection. Thus, trial data do not exclude a possible effect of caloric intake immediately before or after FGln injection on plasma amino acid levels and postprandial hormone levels that may alter FGln biodistribution (31). FGln might have utility for PET imaging of tumor metabolism in patients with diabetes or other patients for whom the fasting requirements of FDG PET pose difficulties.
After tumor uptake of FGln, preclinical experiments have demonstrated that radiotracer is found intracellularly in cytoplasm and as a metabolic substrate directed into biosynthetic and bioenergetic pathways (30,32), including radiotracer “trapping” in protein synthesis (10,33). Protein incorporation of exogenous glutamine occurs rapidly in proliferating tumor cells (34), and amino acids with a fluorine atom substituting for a hydrogen atom are generally good substrates for aminoacyl-transferase (35). Ploessl et al (33) showed in vitro that protein incorporation of FGln into tumor cells was markedly inhibited by cycloheximide, which blocks the translocation step of ribosomal polypeptide synthesis. FGln tracer demonstrated a sustained association with plasma polypeptides in serial blood specimens, after injection, in trial subjects, providing corroborative in vivo clinical evidence of anabolic trapping of FGln radiolabel. In vitro incubation of tumor cells with FGln also yields intracellular production of soluble radiometabolites (10,32,33).
A glutaminase reaction, converting FGln to 18F 4-fluoroglutamate, and a subsequent alanine aminotransferase (EC 2.6.1.2) reaction have been demonstrated in vivo in animal experiments. To our knowledge, cytoplasmic alanine aminotransferase is the only enzyme known to yield free 18F as a secondary metabolic product from FGln (32). Metabolite analyses of plasma specimens from our patient who received FGln confirmed in vivo production of free 18F metabolite. Lieberman et al (10) found that, after incubation of tumor cells with FGln, supernatants of cell lysates contained predominantly parent compound with approximately 10% as 18F 4-fluoroglutamate radiometabolite. Methods presented by Lieberman et al did not account for secondary metabolism of 18F 4-fluoroglutamate, including production of free 18F that freely effluxes from cells, thus probably underestimating 18F 4-fluoroglutamate production (and FGln metabolism) (32). Cooper et al (32) showed that FGln is an excellent substrate for glutaminase, equivalent to normal glutamine.
Animal xenograft tumors avidly retain radiotracer after intravenous FGln injection but rapidly clear radiotracer after injection of exogenous 18F 4-fluoroglutamate (33). 18F 4-fluoroglutamate in tumor cytoplasm—introduced by means of exogenous uptake or produced intracellularly by cytoplasmic glutaminolysis of FGln—is likely rapidly metabolized by cytoplasmic alanine aminotransferase, releasing free 18F that clears from tumor cells (33). In our trial, most osseous tumors demonstrated progressive tracer accumulation to the last time point—probably attributable, in part, to progressive accumulation of radiometabolite (free) 18F that physicochemically adsorbs to extratumoral hydroxyapatite matrix at osseous tumor sites as for NaF PET scans. At less than 30 minutes after injection, background skeletal tracer uptake was low; during this time, tracer avidity at osteolytic metastases was likely predominantly tracer uptake in tumor cells rather than on bony matrix. Most FGln-avid soft-tissue tumors demonstrated partial tracer clearance at delayed time points, potentially attributable to cellular efflux of FGln or radiometabolite, including metabolic release of free 18F through cytoplasmic glutaminolysis.
This trial was not designed to evaluate the diagnostic accuracy of FGln PET for tumor detection. Tumor FGln avidity might vary by cancer type. Apparent tumor FGln avidity was potentially reduced by recent antitumor therapy in several patients.
The results of our study trial demonstrate the safety and feasibility of detecting tumors in vivo with noninvasive FGln PET for several different cancer types. FGln PET has no fasting requirement. Preclinical and trial data support FGln avidity as a PET biomarker of glutamine flux and metabolism and suggest possible correlations among tumor FGln PET phenotype, oncometabolic genotype, and tumor aggressiveness. Further trials to study FGln PET diagnostic accuracy for tumor detection and as a biomarker of tumor metabolic response to therapy are warranted.
Implication for Patient Care
■ 18F-(2S,4R)-4-fluoroglutamine PET offers an investigational alternative clinical PET assay of tumor metabolism without a requirement for patient fasting, unlike FDG PET.
APPENDIX
SUPPLEMENTAL FIGURES
Received November 17, 2016; revision requested January 10, 2017; revision received September 20; accepted December 10; final version accepted December 27.
Supported by the David Mahoney Neuroimaging Program of the Dana Foundation, the National Cancer Institute (grants P50 CA086438, R01 CA164490, R01 CA172546, and R21 CA167803), and Stand Up To Cancer (grant SU2C-AACR-DT0509). MSKCC core facilities are supported by a National Institutes of Health Cancer Center Support grant (grant P30 CA08748). Salary support provided by the National Cancer Institute (grants R21 CA167803 and R01 CA172546 to M.P.S.D.).
Disclosures of Conflicts of Interest: M.P.S.D. disclosed no relevant relationships. J.J.H. disclosed no relevant relationships. S.V. disclosed no relevant relationships. H.Z. disclosed no relevant relationships. E.M.B. disclosed no relevant relationships. J.B. disclosed no relevant relationships. A.M.O. disclosed no relevant relationships. J.J.H. Activities related to the present article: disclosed no relevant relationships. Activities not related to the present article: received grants from Novartis, Eisai, and Cancer Genetics; received personal fees from Novartis, Eisai, and Chugai. Other relationships: disclosed no relevant relationships. I.K.M. disclosed no relevant relationships. K.S. disclosed no relevant relationships. C.P. disclosed no relevant relationships. B.J.B. disclosed no relevant relationships. P.B.Z. disclosed no relevant relationships. J.F.G. disclosed no relevant relationships. D.P.K. disclosed no relevant relationships. W.W. disclosed no relevant relationships. S.K.L. disclosed no relevant relationships. K.F.K. disclosed no relevant relationships. J.S.L. disclosed no relevant relationships.
Abbreviations:
- FDG
- fluorine 18 fluorodeoxyglucose
- FGln
- fluorine 18 (2S,4R)-4-fluoroglutamine
- IDH
- isocitrate dehydrogenase
- SDH
- succinate dehydrogenase
- SUV
- standard uptake value
- TNBC
- triple-negative breast cancer
References
- 1.DeBerardinis RJ, Mancuso A, Daikhin E, et al. Beyond aerobic glycolysis: transformed cells can engage in glutamine metabolism that exceeds the requirement for protein and nucleotide synthesis. Proc Natl Acad Sci U S A 2007;104(49):19345–19350. [DOI] [PMC free article] [PubMed] [Google Scholar]
- 2.Mullen AR, Wheaton WW, Jin ES, et al. Reductive carboxylation supports growth in tumour cells with defective mitochondria. Nature 2011;481(7381):385–388. [DOI] [PMC free article] [PubMed] [Google Scholar]
- 3.Wise DR, Ward PS, Shay JES, et al. Hypoxia promotes isocitrate dehydrogenase–dependent carboxylation of α-ketoglutarate to citrate to support cell growth and viability. Proc Natl Acad Sci U S A 2011;108(49):19611–19616. [DOI] [PMC free article] [PubMed] [Google Scholar]
- 4.Yang C, Ko B, Hensley CT, et al. Glutamine oxidation maintains the TCA cycle and cell survival during impaired mitochondrial pyruvate transport. Mol Cell 2014;56(3):414–424. [DOI] [PMC free article] [PubMed] [Google Scholar]
- 5.Vander Heiden MG, Cantley LC, Thompson CB. Understanding the Warburg effect: the metabolic requirements of cell proliferation. Science 2009;324(5930):1029–1033. [DOI] [PMC free article] [PubMed] [Google Scholar]
- 6.Wise DR, DeBerardinis RJ, Mancuso A, et al. Myc regulates a transcriptional program that stimulates mitochondrial glutaminolysis and leads to glutamine addiction. Proc Natl Acad Sci U S A 2008;105(48):18782–18787. [DOI] [PMC free article] [PubMed] [Google Scholar]
- 7.Gao P, Tchernyshyov I, Chang TC, et al. c-Myc suppression of miR-23a/b enhances mitochondrial glutaminase expression and glutamine metabolism. Nature 2009;458(7239):762–765. [DOI] [PMC free article] [PubMed] [Google Scholar]
- 8.Qing G, Li B, Vu A, et al. ATF4 regulates MYC-mediated neuroblastoma cell death upon glutamine deprivation. Cancer Cell 2012;22(5):631–644. [DOI] [PMC free article] [PubMed] [Google Scholar]
- 9.Ren P, Yue M, Xiao D, et al. ATF4 and N-Myc coordinate glutamine metabolism in MYCN-amplified neuroblastoma cells through ASCT2 activation. J Pathol 2015;235(1):90–100. [DOI] [PubMed] [Google Scholar]
- 10.Lieberman BP, Ploessl K, Wang L, et al. PET imaging of glutaminolysis in tumors by 18F-(2S,4R)4-fluoroglutamine. J Nucl Med 2011;52(12):1947–1955. [DOI] [PubMed] [Google Scholar]
- 11.Venneti S, Dunphy MP, Zhang H, et al. Glutamine-based PET imaging facilitates enhanced metabolic evaluation of gliomas in vivo. Sci Transl Med 2015;7(274):274ra17. [DOI] [PMC free article] [PubMed] [Google Scholar]
- 12.Qu W, Zha Z, Ploessl K, et al. Synthesis of optically pure 4-fluoro-glutamines as potential metabolic imaging agents for tumors. J Am Chem Soc 2011;133(4):1122–1133. [DOI] [PubMed] [Google Scholar]
- 13.Wahl RL, Jacene H, Kasamon Y, Lodge MA. From RECIST to PERCIST: evolving considerations for PET response criteria in solid tumors. J Nucl Med 2009;50(Suppl 1):122S–150S. [DOI] [PMC free article] [PubMed] [Google Scholar]
- 14.Cheng DT, Mitchell TN, Zehir A, et al. Memorial Sloan Kettering–integrated mutation profiling of actionable cancer targets (MSK-IMPACT): a hybridization capture-based next-generation sequencing clinical assay for solid tumor molecular oncology. J Mol Diagn 2015;17(3):251–264. [DOI] [PMC free article] [PubMed] [Google Scholar]
- 15.Franco J, Balaji U, Freinkman E, Witkiewicz AK, Knudsen ES. Metabolic reprogramming of pancreatic cancer mediated by CDK4/6 inhibition elicits unique vulnerabilities. Cell Reports 2016;14(5):979–990. [DOI] [PMC free article] [PubMed] [Google Scholar]
- 16.Basak NP, Roy A, Banerjee S. Alteration of mitochondrial proteome due to activation of Notch1 signaling pathway. J Biol Chem 2014;289(11):7320–7334. [DOI] [PMC free article] [PubMed] [Google Scholar]
- 17.Sheikh TN, Patwardhan PP, Cremers S, et al. Abstract 4450: CB839, an orally bioavailable glutaminase inhibitor, shows potent antitumor activity in vitro against models of soft tissue sarcoma and chondrosarcoma. Cancer Res 2015;75(15 Suppl):4450. [Google Scholar]
- 18.Qie S, Chu C, Li W, Wang C, Sang N. ErbB2 activation upregulates glutaminase 1 expression which promotes breast cancer cell proliferation. J Cell Biochem 2014;115(3):498–509. [DOI] [PMC free article] [PubMed] [Google Scholar]
- 19.Kim MM, Parolia A, Dunphy MP, Venneti S. Non-invasive metabolic imaging of brain tumours in the era of precision medicine. Nat Rev Clin Oncol 2016;13(12):725–739. [DOI] [PMC free article] [PubMed] [Google Scholar]
- 20.Salamanca-Cardona L, Keshari KR. (13) C-labeled biochemical probes for the study of cancer metabolism with dynamic nuclear polarization-enhanced magnetic resonance imaging. Cancer Metab 2015;3(1):9. [DOI] [PMC free article] [PubMed] [Google Scholar]
- 21.Hu W, Zhang C, Wu R, Sun Y, Levine A, Feng Z. Glutaminase 2, a novel p53 target gene regulating energy metabolism and antioxidant function. Proc Natl Acad Sci U S A 2010;107(16):7455–7460. [DOI] [PMC free article] [PubMed] [Google Scholar]
- 22.Chen R, Nishimura MC, Kharbanda S, et al. Hominoid-specific enzyme GLUD2 promotes growth of IDH1R132H glioma. Proc Natl Acad Sci U S A 2014;111(39):14217–14222. [DOI] [PMC free article] [PubMed] [Google Scholar]
- 23.Yang C, Sudderth J, Dang T, Bachoo RM, McDonald JG, DeBerardinis RJ. Glioblastoma cells require glutamate dehydrogenase to survive impairments of glucose metabolism or Akt signaling. Cancer Res 2009;69(20):7986–7993. [DOI] [PMC free article] [PubMed] [Google Scholar]
- 24.Timmers HJ, Kozupa A, Chen CC, et al. Superiority of fluorodeoxyglucose positron emission tomography to other functional imaging techniques in the evaluation of metastatic SDHB-associated pheochromocytoma and paraganglioma. J Clin Oncol 2007;25(16):2262–2269. [DOI] [PubMed] [Google Scholar]
- 25.Cancer Genome Atlas Research Network . Comprehensive molecular characterization of clear cell renal cell carcinoma. Nature 2013;499(7456):43–49. [DOI] [PMC free article] [PubMed] [Google Scholar]
- 26.Pavlova NN, Thompson CB. The emerging hallmarks of cancer metabolism. Cell Metab 2016;23(1):27–47. [DOI] [PMC free article] [PubMed] [Google Scholar]
- 27.Carey BW, Finley LW, Cross JR, Allis CD, Thompson CB. Intracellular α-ketoglutarate maintains the pluripotency of embryonic stem cells. Nature 2015;518(7539):413–416. [DOI] [PMC free article] [PubMed] [Google Scholar]
- 28.Gross MI, Demo SD, Dennison JB, et al. Antitumor activity of the glutaminase inhibitor CB-839 in triple-negative breast cancer. Mol Cancer Ther 2014;13(4):890–901. [DOI] [PubMed] [Google Scholar]
- 29.Szeliga M, Bogacińska-Karaś M, Różycka A, Hilgier W, Marquez J, Albrecht J. Silencing of GLS and overexpression of GLS2 genes cooperate in decreasing the proliferation and viability of glioblastoma cells. Tumour Biol 2014;35(3):1855–1862. [DOI] [PMC free article] [PubMed] [Google Scholar]
- 30.Lieberman B, Qu W, Ploessl K, et al. Uptake of optically pure 18F-4-fluoro-L-glutamines in tumor cells by glutaminolysis. J Nucl Med 2010;51(Suppl 2):249. [Google Scholar]
- 31.Boza JJ, Dangin M, Moënnoz D, et al. Free and protein-bound glutamine have identical splanchnic extraction in healthy human volunteers. Am J Physiol Gastrointest Liver Physiol 2001;281(1):G267–G274. [DOI] [PubMed] [Google Scholar]
- 32.Cooper AJ, Krasnikov BF, Pinto JT, Kung HF, Li J, Ploessl K. Comparative enzymology of (2S,4R)4-fluoroglutamine and (2S,4R)4-fluoroglutamate. Comp Biochem Physiol B Biochem Mol Biol 2012;163(1):108–120. [DOI] [PMC free article] [PubMed] [Google Scholar]
- 33.Ploessl K, Wang L, Lieberman BP, Qu W, Kung HF. Comparative evaluation of 18F-labeled glutamic acid and glutamine as tumor metabolic imaging agents. J Nucl Med 2012;53(10):1616–1624. [DOI] [PubMed] [Google Scholar]
- 34.Rabinovitz M, Olson ME, Greenberg DM. Effect of glutamine analogs on amino acid incorporation into protein of some normal and neoplastic cells in vitro. Cancer Res 1959;19(4):388–392. [PubMed] [Google Scholar]
- 35.Salwiczek M, Nyakatura EK, Gerling UI, Ye S, Koksch B. Fluorinated amino acids: compatibility with native protein structures and effects on protein-protein interactions. Chem Soc Rev 2012;41(6):2135–2171. [DOI] [PubMed] [Google Scholar]
Associated Data
This section collects any data citations, data availability statements, or supplementary materials included in this article.