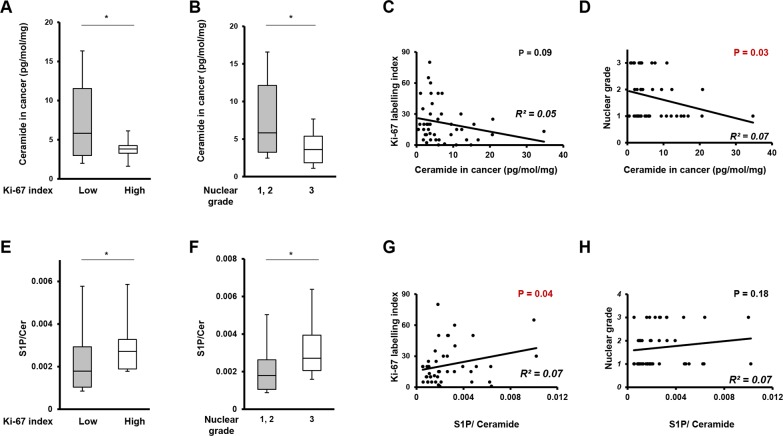
Figure 7. The correlation between ratio of ceramide, the ratio of ceramide to S1P or sphingosine and cell proliferation potency.
(A) The comparison of ceramide levels in breast cancer tissue between patients with Ki-67 index. Mean values are shown by the horizontal lines. *, P<0.05 for high Ki-67 index vs. low Ki-67 index. (B) The comparison of ceramide levels in breast cancer tissue between patients with high nuclear grade (Nuclear Grade 3) and patients with low nuclear grade (Nuclear Grade 1 and 2). Mean values are shown by the horizontal lines. *, P<0.05 for high nuclear grade vs. low nuclear grade. (C) The correlation between ceramide levels in breast cancer tissue and Ki-67 index. The correlation between two variables is denoted by R2. (D) The correlation between ceramide levels in breast cancer tissue and nuclear grade. The correlation between two variables is denoted by R2. (E) The comparison of the ratio of S1P to ceramide in breast cancer tissue between patients with high Ki-67 index and patients with low Ki-67 index. Mean values are shown by the horizontal lines. *, P<0.05 for high Ki-67 index vs. low Ki-67 index. (F) The comparison of the ratio of S1P to ceramide in breast cancer tissue between patients with high nuclear grade (Nuclear Grade 3) and patients with low nuclear grade (Nuclear Grade 1 and 2). Mean values are shown by the horizontal lines. *, P<0.05 for high nuclear grade vs. low nuclear grade. (G) The correlation between the ratio of S1P to ceramide in breast cancer tissue and Ki-67 index. The correlation between two variables is denoted by R2. (H) The correlation between the ratio of S1P to ceramide in breast cancer tissue and nuclear grade. The correlation between two variables is denoted by R2.

